


South East Queensland: Supporting information
For the water account period 1 July 2024 to 30 June 2025
- The total storage volume in the South East Queensland region increased by 5% during the reporting year, finishing at 87.4% full on 30 June 2025.
- Total water inflows to the South East Queensland region during 2024–25 were 9,641 GL, approximately 55% higher than the previous year.
- Approximately 60% of the water resources in the South East Queensland region were used, primarily for diversions to the urban supply system.
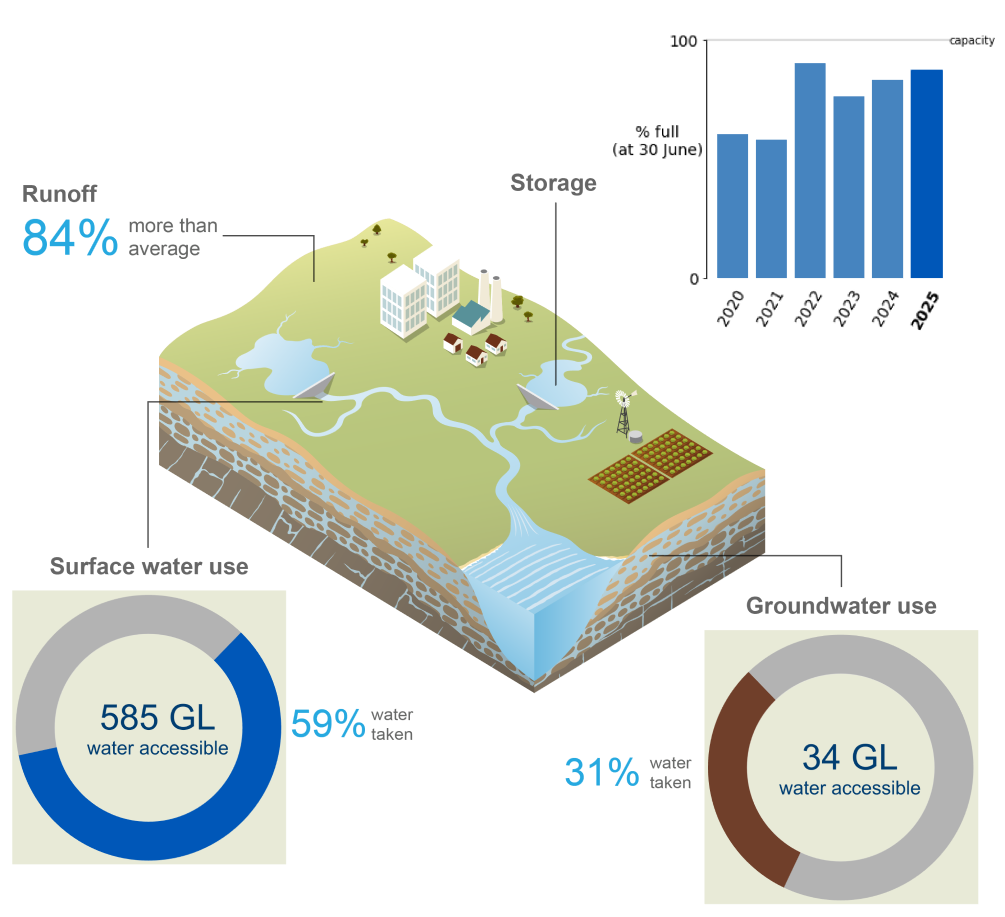
This section provides a detailed breakdown of water assets, liabilities, flows, availability, and use in the South East Queensland region over the past six water accounting periods, outlining where water is stored and how it is used across the region.
For further information, scroll down this page or click on the links below:
Water assets
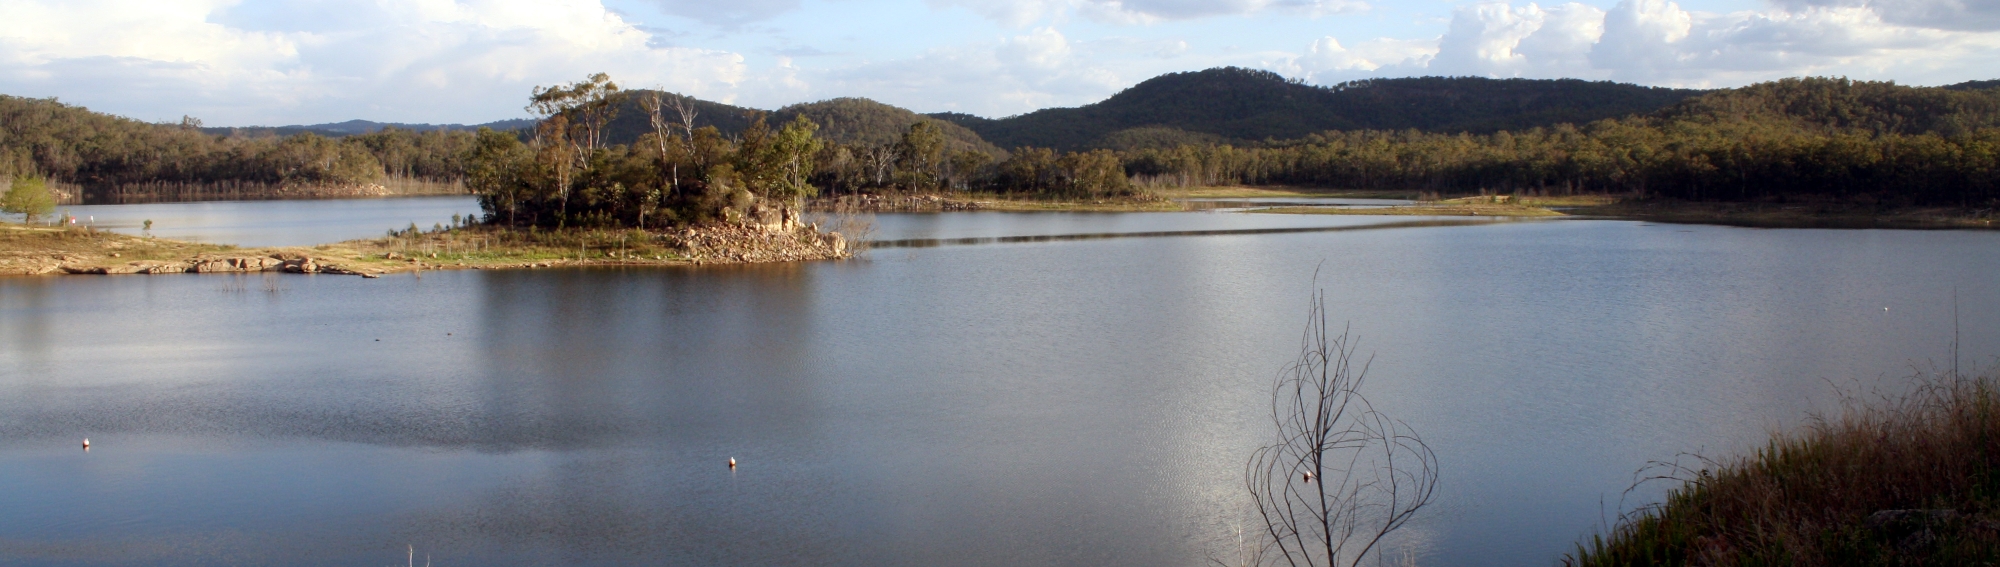
- Total water assets in the South East Queensland region on 30 June 2025 were 2,251 GL, approximately 5% higher than the previous year, entirely due to increases in surface water assets.
- Around 99% of the region’s water assets were held in surface water storages, while groundwater aquifers accounted for the remaining volume of total water assets.
- A detailed breakdown of water assets in the South East Queensland region is available in the Statement of Water Assets and Water Liabilities.
Surface water assets
| Surface water | 2025 | 2024 | 2023 | 2022 | 2021 | 2020 |
| Atkinson | 30,537 | 24,178 | 22,527 | 30,428 | 1,357 | 1,637 |
| Baroon Pocket | 61,054 | 59,660 | 45,847 | 60,653 | 57,718 | 55,902 |
| Bill Gunn | 6,905 | 6,796 | 5,212 | 6,939 | 320 | 200 |
| Cedar Pocket | 749 | 734 | 513 | 740 | 700 | 616 |
| Clarendon | 24,088 | 15,552 | 20,237 | 23,993 | 60 | 60 |
| Cooloolabin | 8,181 | 7,841 | 5,747 | 8,270 | 5,737 | 6,498 |
| Cressbrook Creek | 77,150 | 65,420 | 72,468 | 79,096 | 28,429 | 28,443 |
| Engoggera | 4,260 | 4,197 | 4,109 | 4,306 | 4,257 | 4,138 |
| Ewen Maddock | 16,474 | 16,278 | 12,955 | 16,281 | 15,144 | 13,454 |
| Gold Creek | 812 | 761 | 671 | 829 | 805 | 714 |
| Hinze | 309,662 | 306,562 | 276,617 | 311,810 | 304,377 | 292,946 |
| Lake Kurwongbah | 14,199 | 14,052 | 12,785 | 14,215 | 14,148 | 13,514 |
| Lake MacDonald | 3,997 | 8,075 | 6,808 | 8,088 | 8,122 | 8,042 |
| Lake Manchester | 26,256 | 26,034 | 25,530 | 25,963 | 25,908 | 25,509 |
| Leslie Harrison | 13,261 | 12,790 | 11,190 | 13,048 | 12,892 | 11,798 |
| Little Nerang | 6,264 | 6,326 | 6,088 | 6,303 | 5,382 | 5,402 |
| Maroon | 44,465 | 44,217 | 43,265 | 44,414 | 44,006 | 25,169 |
| Moogerah | 83,181 | 80,892 | 74,507 | 84,308 | 34,798 | 23,736 |
| North Pine | 111,778 | 138,490 | 115,665 | 145,412 | 141,383 | 131,323 |
| Perseverance | 26,944 | 25,673 | 25,298 | 26,944 | 7,474 | 7,474 |
| Poona | 614 | 518 | 475 | 487 | 554 | 658 |
| Somerset | 301,854 | 302,269 | 299,818 | 311,569 | 270,546 | 296,486 |
| Wappa | 4,728 | 4,712 | 4,684 | 4,714 | 4,710 | 4,699 |
| Wivenhoe | 1,034,023 | 937,372 | 831,680 | 1,048,125 | 484,462 | 564,817 |
| Accessible total | 2,211,436 | 2,109,399 | 1,924,696 | 2,276,935 | 1,473,289 | 1,523,235 |
| Dead storage | 6,464 | 6,464 | 6,464 | 6,464 | 6,464 | 6,464 |
| Total storage | 2,217,900 | 2,115,863 | 1,931,160 | 2,283,399 | 1,479,753 | 1,529,699 |
| Total capacity | 2,537,064 | 2,537,064 | 2,537,064 | 2,537,064 | 2,537,064 | 2,537,064 |
| % full | 87.4% | 83.4% | 76.1% | 90.0% | 58.3% | 60.3% |
- The total storage volume in the South East Queensland region increased by 5% during 2024–25, finishing the year at 87.4% full on 30 June 2025.
- Over the past four years, total storage in the South East Queensland region has remained well above the long-term average of 74%, reflecting a sustained period of high water availability across the region.
- Wivenhoe Reservoir, located on the Brisbane River, holds 46% of South East Queensland’s total surface water storage. Together with the Hinze, North Pine, and Somerset reservoirs, these four storages account for approximately 82% of the region’s total storage capacity.
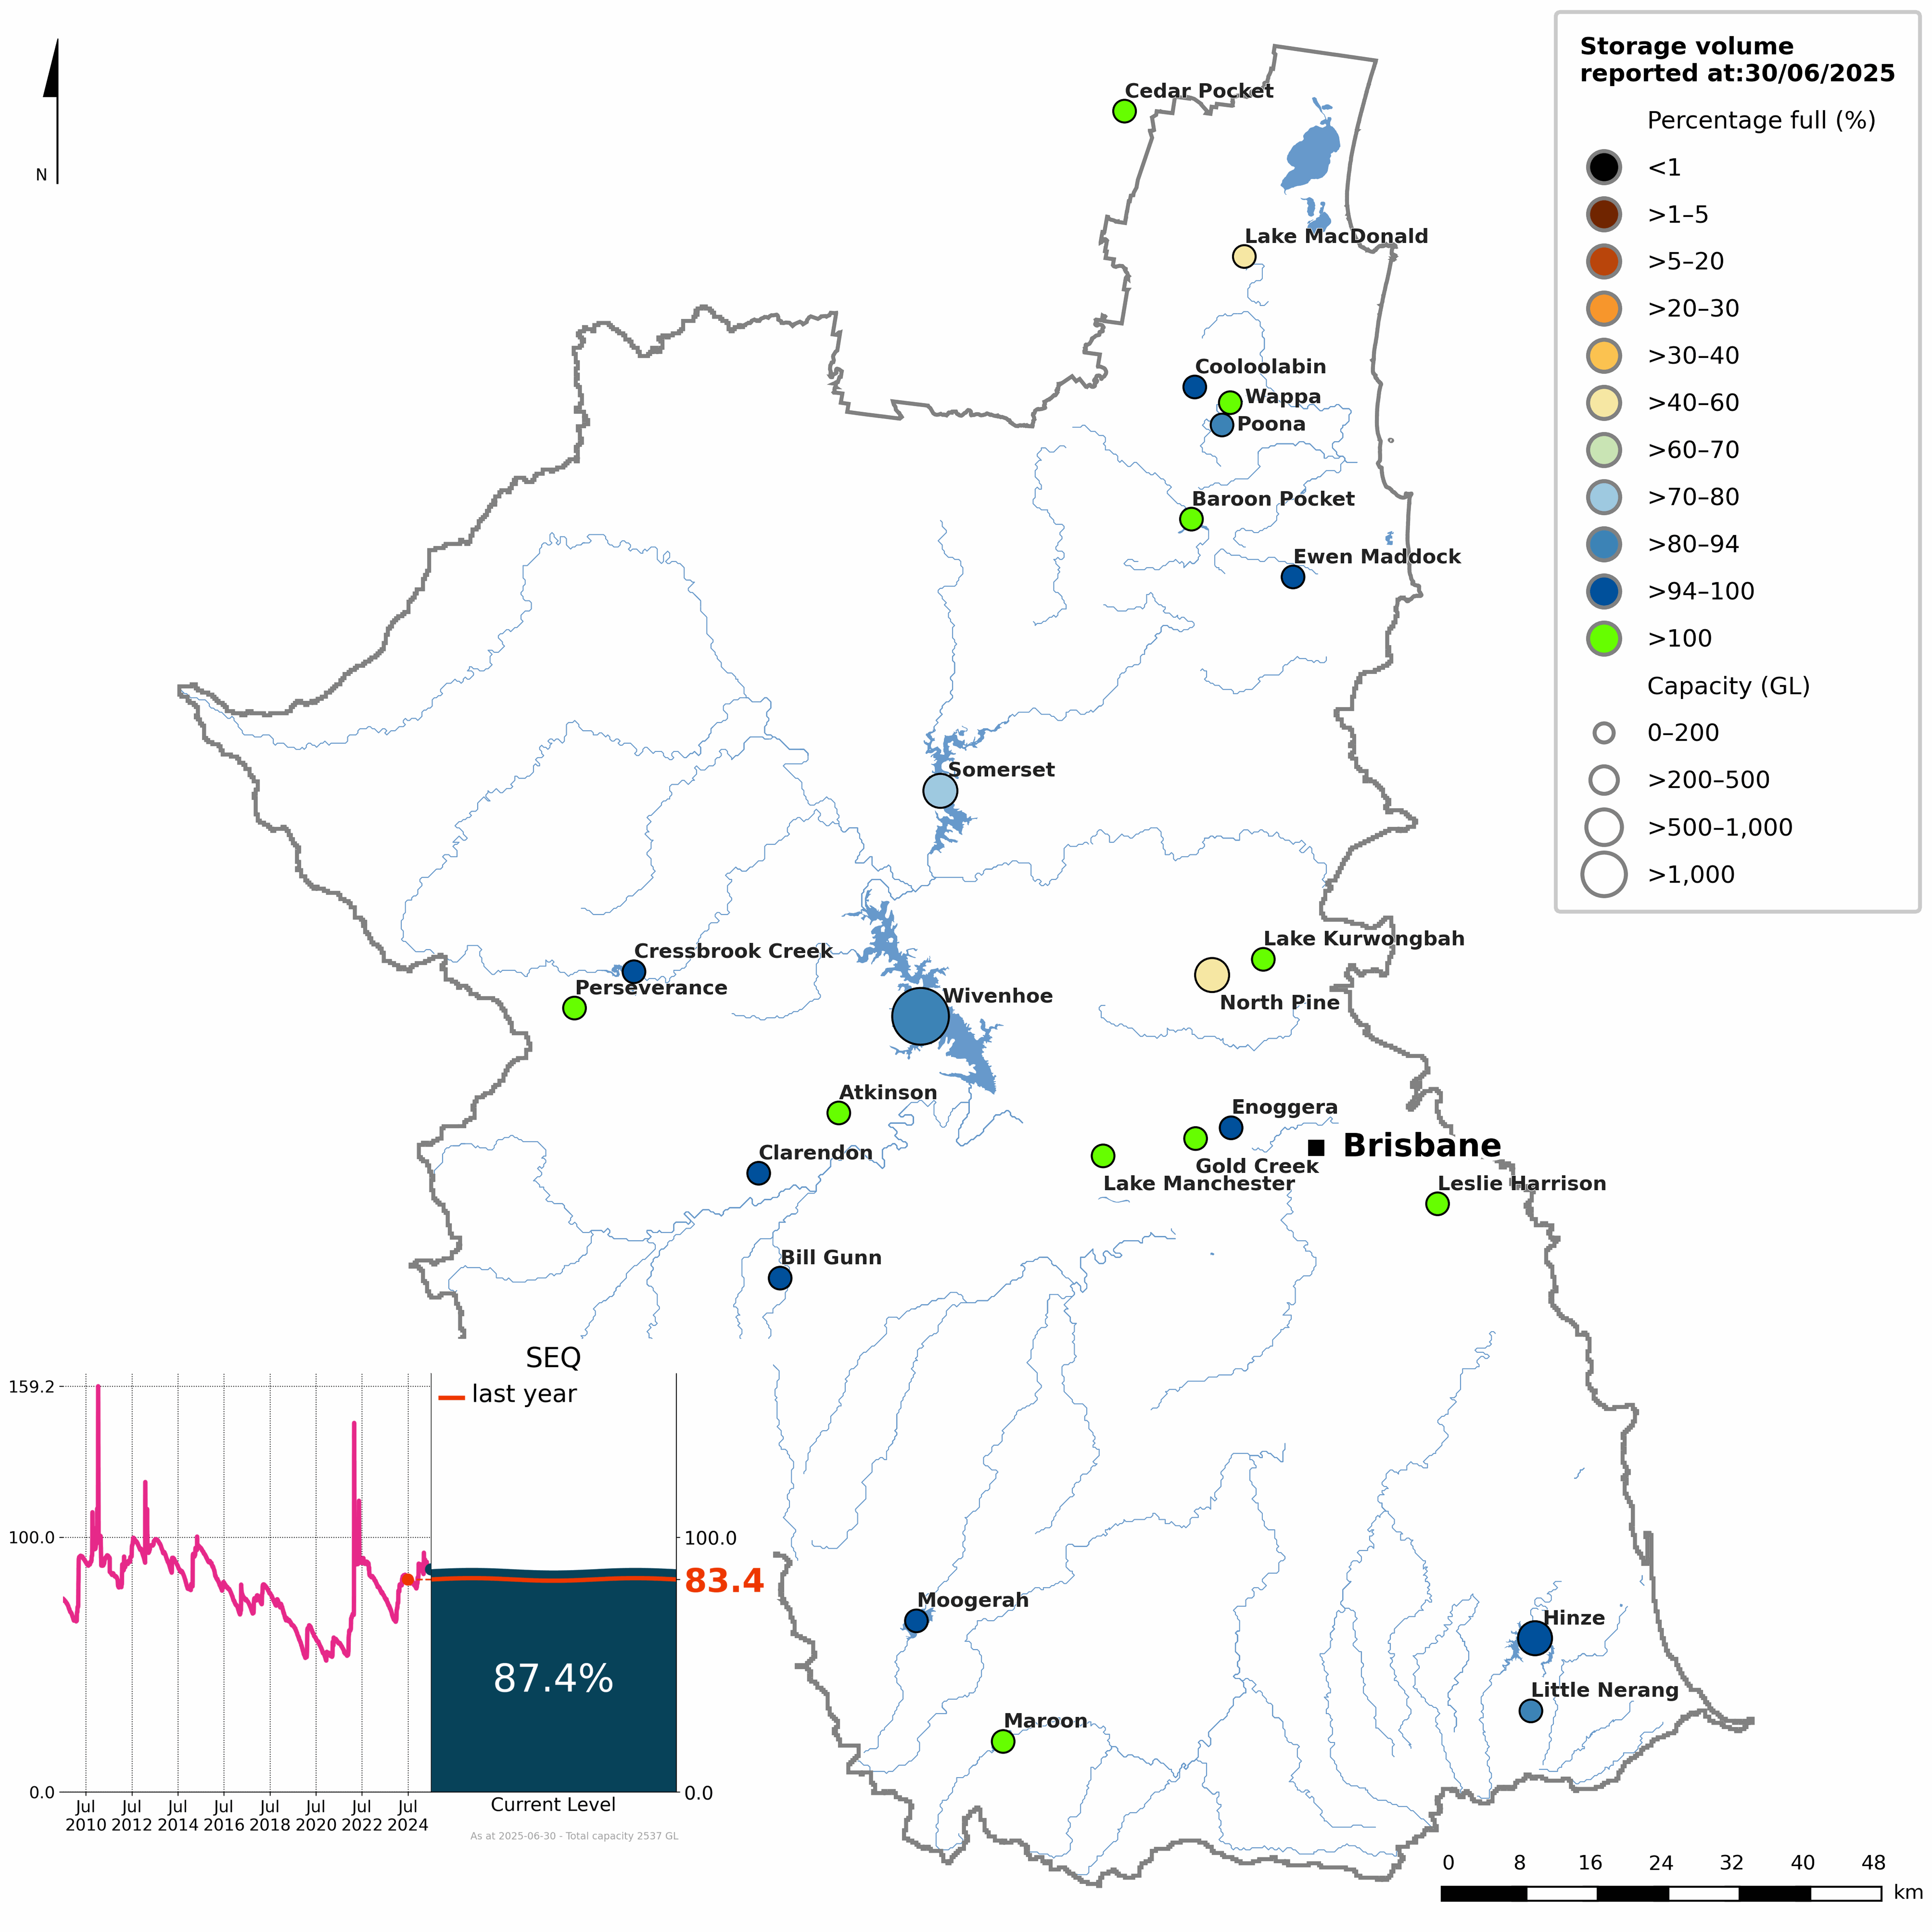
Figure S1 Percentage-full volume on 30 June 2025 for each storage and total storage volume since July 2009 (inset)
- The total storage volume in the South East Queensland region began the 2024–25 year at 83.4% full.
- Storage levels remained relatively stable throughout winter and spring, fluctuating between 80% and 85% full, reaching their lowest point in mid-November at around 80%.
- From late November to early December, storages experienced a short-lived increase, rising to around 90% full, with up to 400 mm falling across several catchments during this period.
- Over summer, storages gradually declined to around 85% full by the end of February, with no significant rainfall events boosting storage volumes.
- In early March, Tropical Cyclone Alfred delivered heavy rainfall across the Gold Coast and Hinterland areas, causing storage volumes to rise sharply from 86% to 93% full.
- Following the impacts of Tropical Cyclone Alfred, storages fell back below 90% full by the end of March but remained above 85% full through to the end of the reporting year.
- More detailed information on individual storages in the South East Queensland region is available on the Bureau of Meteorology's Water Information Dashboard.
Water liabilities
- Water liabilities in the South East Queensland region refer to the volume of allocation remaining on licence entitlements at the end of the reporting year (30 June).
- As there are no carryover provisions for water supply licences in the South East Queensland region, any unused portion of allocation is forfeited at the end of the reporting year. Consequently, the closing balance for all entitlement types in the South East Queensland region is 0 ML.
- A more detailed description of water allocations and entitlements in the South East Queensland region is provided in the Water use section.
Surface water liabilities
| Description | 2025 | 2024 | 2023 | 2022 | 2021 | 2020 | |
| Opening balance at 01 July | 0 | 0 | 0 | 0 | 0 | 0 | |
| add | Allocations | 59,122 | 67,293 | 67,293 | 67,293 | 67,293 | 67,293 |
| less | Allocated diversions | 17,152 | 26,693 | 21,835 | 12,782 | 25,431 | 48,273 |
| less | Adjustments and forfeitures | 41,970 | 40,600 | 45,458 | 54,511 | 41,862 | 19,020 |
| Closing balance at 30 June | 0 | 0 | 0 | 0 | 0 | 0 | |
| Description | 2025 | 2024 | 2023 | 2022 | 2021 | 2020 | |
| Opening balance at 01 July | 0 | 0 | 0 | 0 | 0 | 0 | |
| add | Entitlements | 520,112 | 520,112 | 483,113 | 483,113 | 483,113 | 483,113 |
| less | Diversions to the urban system | 324,718 | 338,715 | 323,172 | 294,590 | 310,807 | 351,788 |
| less | Adjustments and forfeitures | 195,394 | 181,397 | 159,941 | 188,523 | 172,306 | 131,325 |
| Closing balance at 30 June | 0 | 0 | 0 | 0 | 0 | 0 | |
- Surface water allocations for individual users in the South East Queensland region decreased by a little over 10% in 2024–25 to 59 GL, the lowest volume recorded since reporting began in 2011, while urban water entitlements remained unchanged from the previous reporting year.
- For individual users, approximately 70% (42 GL) of surface water allocations were forfeited on 30 June 2025.
- The urban system held 520 GL of surface water entitlements in 2024–25, with 325 GL diverted for urban supply. The remaining entitlement volume (195 GL) was forfeited at the end of the reporting year.
- No allocated or entitled surface water volume was carried over into the 2025–26 water year.
Groundwater liabilities
| Description | 2025 | 2024 | 2023 | 2022 | 2021 | 2020 | |
| Opening balance at 01 July | 0 | 0 | 0 | 0 | 0 | 0 | |
| add | Allocations | 28,395 | 28,395 | 28,395 | 28,395 | 28,395 | 28,395 |
| less | Allocated extractions | 4,523 | 5,776 | 5,648 | 3,631 | 7,510 | 11,222 |
| less | Adjustments and forfeitures | 23,872 | 22,619 | 22,747 | 24,764 | 20,885 | 17,173 |
| Closing balance at 30 June | 0 | 0 | 0 | 0 | 0 | 0 | |
- Groundwater allocations for individual users in the South East Queensland region were 28 GL during 2024–25, in line with recent years.
- Approximately 85% (24 GL) of groundwater allocations were forfeited on 30 June 2025, reflecting low extraction rates across the region.
- No groundwater allocation volume was carried over into the 2025–26 water year.
Water flows
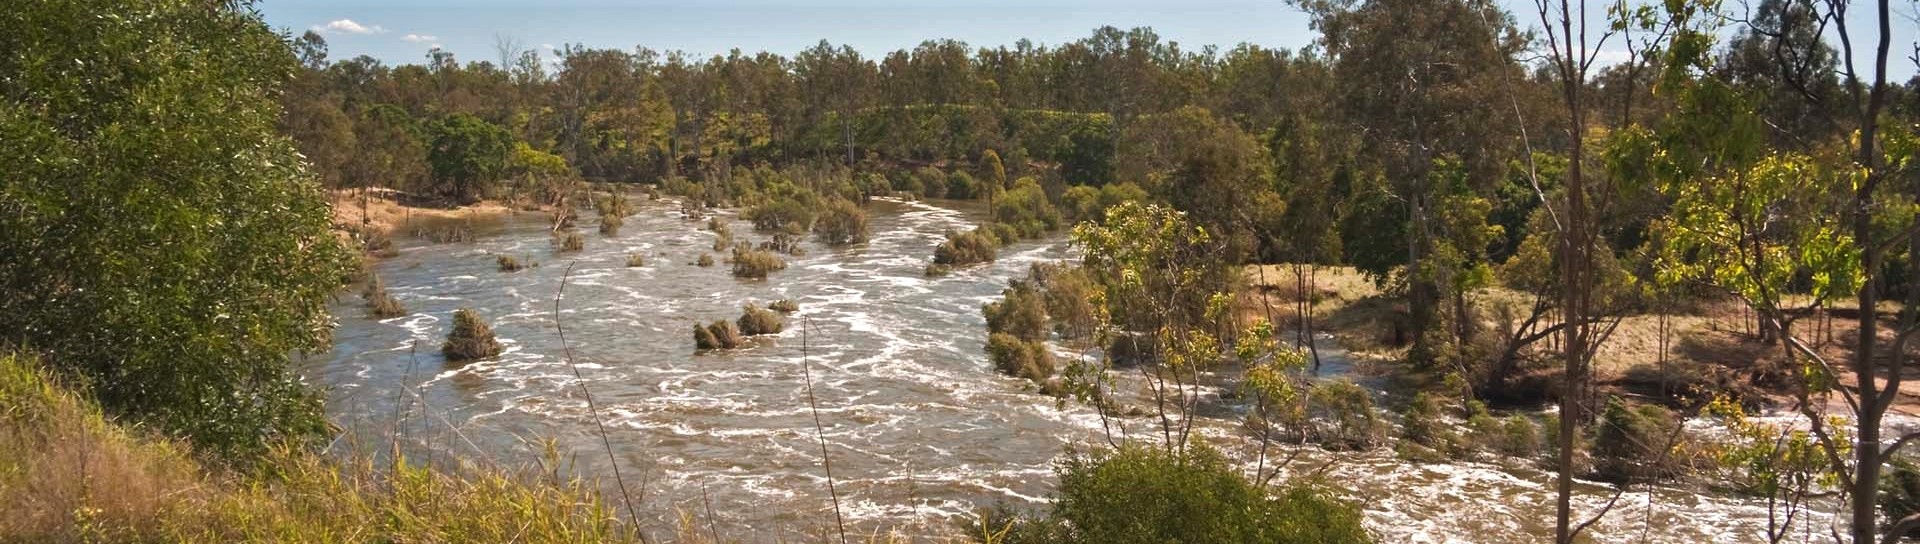
- Water flows in the South East Queensland region describe the movement of water between surface water, groundwater, and the urban system.
- A summary of total inflows and outflows for each water store is provided below.
- For a detailed breakdown of inflows and outflows in the South East Queensland region, refer to the Statement of Changes in Water Assets and Water Liabilities.
| Water inflows | 2025 | 2024 | 2023 | 2022 | 2021 | 2020 |
| Surface water inflows | 8,168,448 | 5,016,360 | 1,763,315 | 16,083,199 | 4,177,359 | 3,364,834 |
| Groundwater inflows | 779,483 | 483,637 | 429,847 | 874,103 | 551,359 | 285,333 |
| Urban system inflows | 692,620 | 659,121 | 611,022 | 664,704 | 624,016 | 642,762 |
| Total water inflows | 9,640,551 | 6,159,118 | 2,804,184 | 17,622,006 | 5,352,734 | 4,292,929 |
- Total water inflows to the South East Queensland region during 2024–25 were 9,641 GL, approximately 55% higher than the previous year, and slightly below 50% above the average of 6,475 GL, largely reflecting increased surface water inflows.
- Surface water made up around 85% of total inflows, primarily driven by runoff, which accounted for about 90% of surface water inflows.
- Recharge from surface water dominated groundwater inflows, which represented approximately 8% (780 GL) of total inflows.
- The remaining inflows were associated with the urban system (693 GL), mostly from surface water diversions and wastewater collected.
| Water outflows | 2025 | 2024 | 2023 | 2022 | 2021 | 2020 |
| Surface water outflows | 9,366,209 | 4,719,465 | 3,078,873 | 17,973,433 | 4,520,399 | 3,069,941 |
| Groundwater outflows | 10,590 | 19,413 | 16,179 | 8,808 | 19,146 | 26,231 |
| Urban system outflows | 614,155 | 610,489 | 543,391 | 617,098 | 590,007 | 607,146 |
| Total water outflows | 9,990,954 | 5,349,367 | 3,638,443 | 18,599,339 | 5,129,552 | 3,703,318 |
- Total water outflows from the South East Queensland region during 2024–25 were 9,991 GL, approximately 85% higher than the previous year, and approximately 55% above the average of 6,537 GL, driven by increased surface water outflows.
- Surface water dominated total outflows, representing around 95% of the total, mainly through river outflows to sea.
- Extractions by individual users and the urban system comprised all groundwater outflows, which accounted for less than 1% of total outflows.
- The remaining outflows were associated with the urban system (614 GL), largely through discharge to sea and the supply of drinking water to urban customers.
Water availability
| Surface water | 2025 | 2024 | 2023 | 2022 | 2021 | 2020 |
| Water availability | 9,861,478 | 6,752,251 | 3,919,624 | 17,021,459 | 5,448,191 | 4,899,604 |
| Water accessible | 584,662 | 592,850 | 556,066 | 556,136 | 555,904 | 555,904 |
| Water taken | 347,298 | 370,853 | 350,667 | 313,102 | 341,736 | 405,149 |
| % water accessible taken | 59% | 63% | 63% | 56% | 61% | 73% |
- Surface water availability in the South East Queensland region during 2024–25 was 9,862 GL, around 45% higher than the previous reporting year, and 78% above the long-term average of 5,537 GL.
- Changes in water availability in the South East Queensland region are heavily influenced by runoff patterns.
- Surface water accessible for take in the South East Queensland region was 585 GL in 2024–25, slightly lower than the previous year, but 6% above the average of 552 GL.
- Water taken from surface water resources in the South East Queensland region decreased by 6% compared to last year, but remained 10% above the average of 316 GL.
- Overall, approximately 60% of the accessible surface water for take in the South East Queensland region was taken during 2024–25, with the majority used for diversions to the urban system.
Water use
Consumptive use
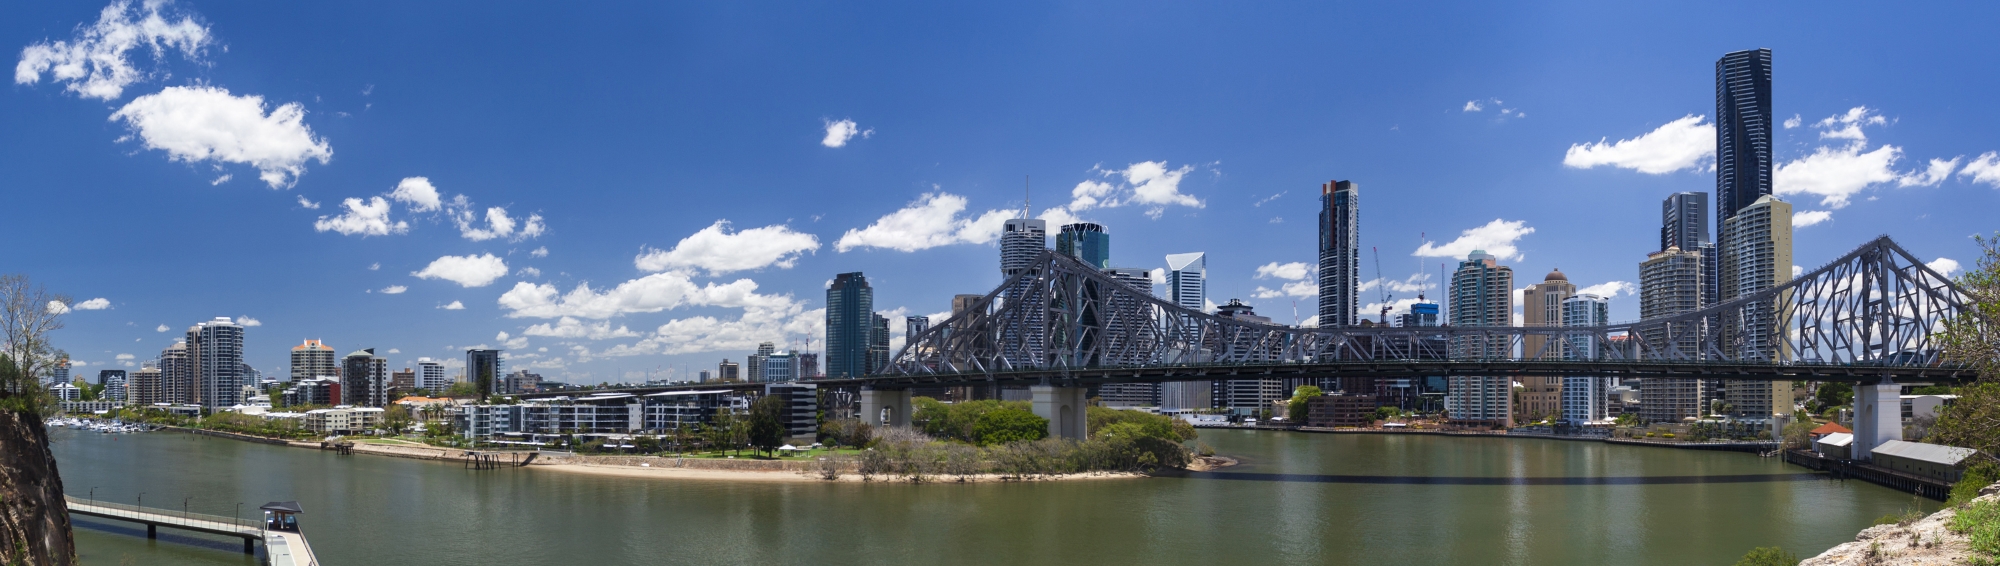
- A total of 358 GL of water was taken from surface water and groundwater resources for consumptive use in the South East Queensland region during 2024–25, around 8% less than the previous year, primarily due to reduced surface water diversions to the urban system.
| Surface water | 2025 | 2024 | 2023 | 2022 | 2021 | 2020 |
| Individual users | 18,588 | 28,146 | 23,565 | 14,520 | 26,937 | 49,555 |
| Inter-region | 3,992 | 3,992 | 3,930 | 3,992 | 3,992 | 3,806 |
| Urban system | 324,718 | 338,715 | 323,172 | 294,590 | 310,807 | 351,887 |
| Total | 347,298 | 370,853 | 350,667 | 313,102 | 341,736 | 405,149 |
- Surface water diversions across the South East Queensland region during 2024-25 totalled 347 GL, a 6% decrease from the previous year, but remained 10% above the average of 316 GL.
- Geater than 90% of surface water was supplied to the urban system, mainly to Seqwater, Queensland’s bulk water supply authority.
- Individual users accounted for around 5% of total diversions, while the remaining volume was diverted to inter-region users with statutory rights.
| Groundwater | 2025 | 2024 | 2023 | 2022 | 2021 | 2020 |
| Individual users | 6,268 | 13,636 | 10,024 | 5,176 | 11,966 | 18,350 |
| Urban system | 4,322 | 5,777 | 6,155 | 3,632 | 7,180 | 7,881 |
| Total | 10,590 | 19,413 | 16,179 | 8,808 | 19,146 | 26,231 |
- Groundwater extractions across the South East Queensland region totalled 11 GL during 2024–25, a 45% decrease compared to the previous year.
- Approximately 60% (6 GL) of groundwater was extracted by individual users, with the remaining volume supplied to the urban system.
Allocations and diversions
| Surface water | 2025 | 2024 | 2023 | 2022 | 2021 | 2020 |
| Individual users | ||||||
| Carryover | 0 | 0 | 0 | 0 | 0 | 0 |
| Allocated announcements | 59,122 | 67,293 | 67,293 | 67,293 | 67,293 | 67,293 |
| Allocated diversions | 17,152 | 26,693 | 21,835 | 12,782 | 25,431 | 48,273 |
| % used | 29% | 40% | 32% | 19% | 38% | 72% |
| Urban users | ||||||
| Carryover | 0 | 0 | 0 | 0 | 0 | 0 |
| Allocated entitlements | 520,112 | 520,112 | 483,113 | 483,113 | 483,113 | 483,113 |
| Allocated diversions | 324,718 | 338,715 | 323,172 | 294,590 | 310,807 | 351,788 |
| % used | 62% | 65% | 67% | 61% | 64% | 73% |
| Total | ||||||
| Carryover | 0 | 0 | 0 | 0 | 0 | 0 |
| Allocations | 579,234 | 587,405 | 550,406 | 550,406 | 550,406 | 550,406 |
| Allocated diversions | 341,870 | 365,408 | 345,007 | 307,372 | 336,238 | 400,061 |
| % used | 59% | 62% | 63% | 56% | 61% | 73% |
- Total surface water allocations in the South East Queensland region during 2024–25 were 579 GL, of which approximately 60% (342 GL) was diverted, primarily to the urban system.
- Allocated entitlements to the urban system accounted for approximately 90% (520 GL) of total surface water allocations, with around 60% (325 GL) of this volume diverted for urban water supply.
- Surface water allocations for individual users totalled 59 GL, representing around 10% of total allocations, though only 30% (17 GL) of this volume was diverted during the year.
- Urban water use dominated total diversions, accounting for approximately 95% of all surface water diverted across the region.
- Overall, surface water diversions in the South East Queensland region during 2024–25 were lower than the previous year, but remained above the average, reflecting ongoing demand for urban water supply.
| Groundwater | 2025 | 2024 | 2023 | 2022 | 2021 | 2020 |
| Carryover | 0 | 0 | 0 | 0 | 0 | 0 |
| Allocated announcements | 28,395 | 28,395 | 28,395 | 28,395 | 28,395 | 28,395 |
| Allocated extractions | 4,523 | 5,776 | 5,648 | 3,631 | 7,510 | 11,222 |
| % used | 16% | 20% | 20% | 13% | 26% | 40% |
- Total groundwater allocations in the South East Queensland region during 2024–25 were 28 GL, consistent with volumes allocated over the past five years, entirely for private and commercial purposes.
- Approximately 15% (5 GL) of the allocated groundwater was extracted during the year, around 20% lower than the previous year, and 10% below the average extraction volume of 5 GL.
- There are no groundwater entitlements for urban users in the South East Queensland region.
Urban supply system
| Water sources | 2025 | 2024 | 2023 | 2022 | 2021 | 2020 |
| Surface water | 324,718 | 338,715 | 323,172 | 294,590 | 310,807 | 351,788 |
| Groundwater | 4,322 | 5,777 | 6,155 | 3,632 | 7,180 | 7,881 |
| Desalinated water | 8,265 | 9,627 | 7,240 | 12,714 | 19,486 | 13,805 |
| Inter-region inflow | 0 | 0 | 0 | 0 | 7 | 14 |
| Total urban water supplied | 337,305 | 354,119 | 336,567 | 310,936 | 337,480 | 373,488 |
- A total of 337 GL of water was supplied to the urban system in the South East Queensland region during 2024–25, around 5% less than the previous year, but 11% above the average of 305 GL.
- Surface water storages continued to be the primary source of supply, contributing greater than 95% of the total volume.
- Desalinated water provided approximately 2% of the total supply in 2024–25, with the remaining volume sourced from groundwater. No inter-region inflows were recorded during the year.
- The contribution of desalinated water decreased by 14% compared to last year, but remained 20% (approximately) above the average contribution of 7 GL.
- For more information on the use of desalinated water in the South East Queensland region, visit Seqwater's Water Treatment website.
| Supply of drinking water | 2025 | 2024 | 2023 | 2022 | 2021 | 2020 |
| Residential customers | 216,822 | 217,834 | 211,674 | 206,125 | 219,223 | 222,264 |
| Commercial & industrial customers | 61,017 | 73,958 | 76,028 | 80,149 | 88,429 | 89,977 |
| Agricultural & irrigation customers | 684 | 34,057 | 1,317 | 17,499 | 16,264 | 39,475 |
| Other customers | 11,652 | 2,003 | 2,223 | 1,843 | 1,724 | 2,203 |
| Total drinking water used | 290,175 | 327,852 | 291,242 | 305,616 | 325,640 | 353,919 |
- A total of 290 GL of drinking water (excluding recycled water) was supplied to urban customers in the South East Queensland region during 2024–25.
- Residential customers accounted for the majority of demand, using 217 GL (approximately 75% of total drinking water supplied).
- Commercial and industrial customers used 61 GL (around 20% of total consumption), while agricultural and irrigation customers used less than 1 GL.
- Other customers—including small commercial operations, community services, and institutional users—used 12 GL, representing approximately 5% of total drinking water use.
- Overall, drinking water use in 2024–25 remained within the typical range observed over the past decade, reflecting stable demand across the region.