


Sydney: Supporting information
")
Introduction
The following set of notes provides consolidated reports for each of the water stores and systems within the Sydney region during the 2014–15 year. The water stores and systems included in the region are shown in Figure N1.
For a more detailed description of the region, please refer to the General description section of the 'Contextual information'.

Figure N1 Water stores and systems within the Sydney region
Information on all water flows to and from each water store and system are presented in this note, including between-store flows and transfers that are not presented in the water accounting statements. The between-store flows and transfers that occur in the region are presented in Figure N2.

Figure N2 Between–store flows that occur within the Sydney region
The between-store flows and transfers (Figure N2), which are eliminated from the region's water accounting statements, are shown in italics throughout the following set of notes. The allocation announcement, forfeiture and allocation remaining items associated with each between-store abstraction (red arrows in Figure N2) are also shown in italics in the following notes.
Surface water store
The Sydney region surface water store has four components:
- storages
- regulated rivers
- unregulated rivers
- lakes and wetlands.
A reconciliation of the surface water Statement of Water Assets and Water Liabilities and Statement of Water Flows is provided in Table N2. Further details on assets, liabilities and flows are provided in the following sections.
Methods used to derive reported volumes can be found in the Quantification approach note.
| 2015 ML | 2014 ML | |
| Opening surface water store | 2,388,070 | 2,838,384 |
| Inflows | 5,481,488 | 2,148,258 |
| Outflows | (5,171,009) | (2,526,255) |
| Balancing item | (33,583) | (72,317) |
| Closing surface water store | 2,664,966 | 2,388,070 |
| comprises: | ||
| Water assets | 2,667,333 | 2,390,437 |
| Water liabilities | – | – |
| Net water assets | 2,667,333 | 2,390,437 |
Assets and liabilities
Physical assets
Physical asset volumes, including water held in reservoirs, lakes and wetlands, at 30 June 2015 were:
- storages—2,661,678 ML
- unregulated rivers—3,288 ML.
The volume of water in regulated rivers, lakes and wetlands, could not be quantified due to a lack of data and a suitable quantification approach; however, the volume of water held in channels and lakes is considered to be relatively small compared to the volume held in storages.
The location of each storage within the Sydney region and the volume of water in each storage (including dead storage), as a percentage of total storage capacity at the end of the 2014–15 year is shown in Figure N3.

Figure N3 Percentage-full volume for each storage in Sydney region on 30 June 2015
The overall storage volume within the Sydney region increased during the 2014–15 year from 83% to 93% capacity. The volume in most storages increased during the year. Five storages (Bundanoon, Danjera, Farmers Creek No. 2, Medway and Tallowa) were at capacity on both 30 June 2014 and 30 June 2015.
The largest storage in the region is Lake Burragorang (Warragamba Dam). Its capacity of 2,031,000 ML represents approximately 70% of the Sydney region's total storage capacity (2,862,622 ML). On 30 June 2015, Lake Burragorang was at more than 93% capacity and other large storages including Avon, Cordeaux, Nepean, Tallowa and Woronora were at more than 90% capacity. Cataract reservoir was 84% full.
Catchment runoff was the main contributor for the increase to storage volumes. During the 2014–15 year, 2,112,749 ML of surface water runoff reached the storages within the region. This volume was approximately 36% of the total runoff that reached rivers and storages. The runoff volume to the storages was more than double compared to that observed for the 2013–14 year.
Total volume of water within each storage at 30 June 2015, compared with the previous year and the 5-year average, is given in Figure N4.

Figure N4 Total volume of water in each storage at 30 June 2015 compared with the previous year and the 5-year mean
The overall increase in storage during the 2014–15 year can be attributed to increased runoff due to the higher rainfall experienced across the region compared with the 2013–14 year (see Climate and water overview).
For unregulated river reaches, where data were available, static volume of water stored was estimated (3,288 ML). These reaches were Capertee River (Glen Davis to upper Colo), Coxs River (Lithgow–Kelpie Point), Shoalhaven River (Kadoona–Fossickers Flat) and Wollondilly River (Jooriland–Golden Valley).
Non-physical assets
Non-physical assets represent claims on water on behalf of the region. For the Sydney region, the inter-region claim on water (2,367 ML) is the carryover associated with the Fish River Water Supply Scheme for WaterNSW and Energy Australia for the 2014–15 year. Each agency has an annual maximum allocation entitlement from the Fish River Water Supply Scheme to supply water to their storages. The maximum carryover volume is 20% of the total allocation entitlement (WaterNSW: 3,650 ML and Energy Australia: 8,184 ML) into the following year.
Liabilities
Surface water liabilities in the Sydney region refer to the volume of surface water allocation remaining on licence entitlements at the end of the 2014–15 year for:
- individual users—0 ML
- urban water system—0 ML.
The water supply licences for the region have a water management year that ends on 30 June. The portion of surface water allocation that has not been abstracted at the end of the water year is either forfeited or is carried over into the next water year. According to the Water Sharing Plan for the Greater Metropolitan Region Unregulated River Water Sources (NSW Office of Water 2011a), carryover of any unused allocation at the end of the year is allowed. The maximum volume of carry-over allowed is determined by the rules in the water sharing plan and the volume of water diverted under the licence. Due to limited data availability, however, the carryover volume could not be quantified. Therefore, for the purposes of the 2015 Account, it is assumed the entire unused portion of the allocation is forfeited and the allocation remaining is zero.
Further information on all entitlements and allocation arrangements are detailed in the Surface water rights note.
Inflows and outflows
A schematic diagram representing all the inflows and outflows associated with the surface water store in the Sydney region is provided in Figure N5.

Figure N5 Water inflows and outflows for the surface water store within the Sydney region during the 2014-15 year
Surface water inflows
Total inflows to surface water were 5,481,488 ML and comprised the following:
- Precipitation—155,848 ML
- Runoff—5,239,511 ML
- Delivery: inter-region—3,068 ML
- Discharge: wastewater—83,053 ML
- Discharge: user—8 ML.
The largest natural water inflow during the 2014–15 year was runoff. This volume reflects the above average rainfall experienced across the region (see Climate and water overview) and is more than twice of that in 2013–14 year. It includes 2,112,749 ML that reached surface water storages (see Surface water assets).
Precipitation represents the volume of rainfall that fell on the major storages and river reaches within the region. Groundwater discharge to surface water was another notable natural surface water inflow but could not be quantified due to lack of data.
The total diversion during the year under inter-region agreements was 3,068 ML. It was the volume of water received under inter-basin claim on the Fish River Water Supply Scheme by WaterNSW and Energy Australia.
The remaining two transfers of water to the surface water store during the 2014–15 year were discharge from the urban water system (83,053ML) and direct discharge by users (8 ML). Direct discharge by users represents water discharged from Wallerawang Power Station to the Coxs River upstream of Lake Lyell.
Surface water outflows
Total outflows from surface water were 5,171,009 ML and comprised the following:
- Evaporation—166,963 ML
- Outflow—4,403,694 ML
- Allocated diversion: urban system—542,895 ML
- Allocated diversion: individual users—24,927 ML
- Diversions: statutory rights—32,530 ML.
The largest natural water outflow is the river outflow from the region (4,403,694 ML), which refers to the annual volume of flow to the sea during the 2014–15 year. The flow volume to the sea comprises of natural runoff leading to sea, rule-based environmental flow releases, other unspecified releases and spills from most downstream storages and weirs to rivers, and treated water releases from wastewater treatment plants. This outflow is more than twice which occurred during the previous year, which primarily reflects more water availablilty in these rivers compared with that of 2013–14 year (see Climate and water overview).
Evaporation from surface water during the 2014–15 year was 166,963 ML, which represents evaporation from the major storages and river sections within the region. Total evaporation during the 2014–15 year was slightly less than that of 2013–14 year, which may be attributed to increased rainfall (and hence cloud cover) that occurred during the 2014–15 year (see Climate and water overview). More than 45% of the total volume of evaporation from surface water in the region occurs at Lake Burragorang (Warragamba Dam).
Allocated water diversions from the surface water store are described below. The volume of surface water leakage to landscape and groundwater could not be quantified accurately due to lack of data.
Allocated diversions
Surface water allocation diversions within the Sydney region represent:
- water diversion from surface water for urban water supply system by WaterNSW and other urban entitlement holders
- entitled diversion of allocated surface water for individual users.
WaterNSW, the region's sole bulk water supplier, diverts surface water to water utilities within the region. In addition, several water utilities divert surface water under their local water utility entitlements. During the 2014–15 year, 542,895 ML of surface water was diverted to Sydney's urban water supply system (Figure N6), which accounts for approximately 96% of the total allocation diversion of 567,822 ML.

Figure N6 Surface water allocations and diversions for the urban water system during the 2014–15 year
The volume diverted to the urban water system includes:
- water diverted by WaterNSW to urban holders: Sydney Water Corporation, Shoalhaven City Council, Wingecarribee Shire Council, Goulburn Mulwaree Council, raw and unfiltered water supplied to retail customers
- water diverted by other urban entitlement holders: Goulburn Mulwaree Council, Lithgow City Council and Wingecarribee Shire Council.
Figure N7 shows the surface water diverted by WaterNSW and other urban water holders to water utilities for the urban supply system during the 2014–15 year.

Figure N7 Surface water diversions for the urban system by WaterNSW and other urban water holders during the 2014–15 year
The entitled diversion of allocated surface water for individual users during the 2014–15 year was 24,927 ML, which accounts for approximately 4% of the total allocation diversion (567,822 ML). The diversions from Cox River (7,315 ML) were for power generation at Mt Piper and Wallerawang power stations. The remaining volume, 225 ML to individual holders (stock and domestic) and 17,387 ML to other lumped holders was diverted from the Hawkesbury and lower Nepean rivers.
The Water access and use note provides more information on water entitlements related to surface water allocation diversions.
Diversions: statutory rights
Statutory surface water rights in the Sydney region are made up of two main categories: cultural rights (27 ML) and riparian rights (32,503 ML). The annual extraction is assumed to be the volume stated in the water sharing plans Greater Metropolitan Region Unregulated River Water Sources'and Water Sharing Plan for the Kangaroo River Water Source'.
Surface water balancing item
The surface water balance (Table N6) yielded a balance of -33,583 ML. This is approximately 1% of the total surface water store volume at the end of the 2014–15 year and less than 1% of the total surface water inflows during the 2014–15 year. The nagative balancing item indicates that either the inflows are too high or the outflows are too low.
It is likely that the balancing item is primarily attributed to uncertainties associated with the runoff to surface water (a large source of surface water increase), river outflow from the region (a large source of surface water decrease) and the lack of an estimate of surface water discharge to groundwater.
WaterNSW used mass balance calculations to estimate the runoff volume to its storages and the Bureau estimated runoff volumes from a rainfall–runoff model for storages not managed by the WaterNSW. The Bureau calculated the runoff at several gauging stations and also estimated the runoff for ungauged area from the rainfall–runoff model. It is reasonable to expect a 10–20% uncertainty around the estimated runoff volume.
The river outflow to sea is mainly based on measured flow data collected at the most downstream gauging stations along rivers, environmental flow releases, and modelled data for ungauged river reaches and tidal streams. There are uncertainties associated with the model calculations and the gauged flows used (see Quantification approaches). As such, outflow volume to sea is likely to have a 5–10% uncertainty.
| Volume ML | |
| Opening balance at 1 July 2014 | 2,388,070 |
| Total surface water inflows | 5,481,488 |
| Total surface water outflows | (5,171,009) |
| Closing balance at 30 June 2015 | (2,664,966) |
| Balancing item | (33,583) |
Groundwater store
The groundwater store is not discussed for the Sydney region as volumes related to groundwater store could not be quantified in a way that was complete, neutral, and free from material error. Also, it is not recognised in the water accounting statements as its contribution is very minimal.
Urban water system
The Sydney region's urban water system has three core components:
- Water supply: raw water transfers, water treatment and potable water supply
- Wastewater: collections, transfers and treatment
- Recycled water supply.
A reconciliation of the urban water Statement of Water Assets and Water Liabilities and Statement of Water Flows is provided in Table N7. Further details on assets, liabilities and flows are provided in the following sections.
Methods used to derive reported volumes can be found in the Quantification approach note.
| 2015 ML | 2014 ML | |
| Opening urban water store | 0 | 0 |
| Inflows | 1,091,984 | 1,039,643 |
| Outflows | (1,082,771) | (1,027,109) |
| Balancing item | (9,116) | (12,534) |
| Closing urban water store | 97 | 0 |
| comprises: | ||
| Water assets | 453 | 356 |
| Water liabilities | 0 | 0 |
| Net water assets | 453 | 356 |
Assets and liabilities
Physical assets
Physical assets at 30 June 2015 were 97 ML and that was the water held in the distribution pipe network and service reservoirs of Wingecarribee Shire Council. The volume of water within the urban water supply system in other utilities and also wastewater and recycled water systems could not be quantified due to a lack of available data.
Non-physical assets
Nonphysical assets represent the following claims on water:
- Surface water: 0 ML
- Inter-region: 356 ML.
The urban inter-region claim on water (356 ML) is the surface water claim on the Fish River Water Supply Scheme for Lithgow City Council . There are no groundwater licence entitlements for the urban water system. These claims are equivalent to the volume of surface water allocation remaining for urban water supply licence entitlements at the end of the 2014–15 year. Details are provided in tables N8 and N9.
Further information on all entitlements and allocation arrangements are detailed in the Surface water rights note.
Liabilities
There are no urban water liabilities in the Sydney region.
Inflows and outflows
A schematic diagram representing all the inflows and outflows associated with the urban water system in the Sydney region is provided in Figure N8.

Figure N8 Water inflows and outflows for the urban water system within the Sydney region during the 2014–15 year
A detailed breakdown of the inflows and outflows of the urban water system components are provided in the Urban water balance diagram.
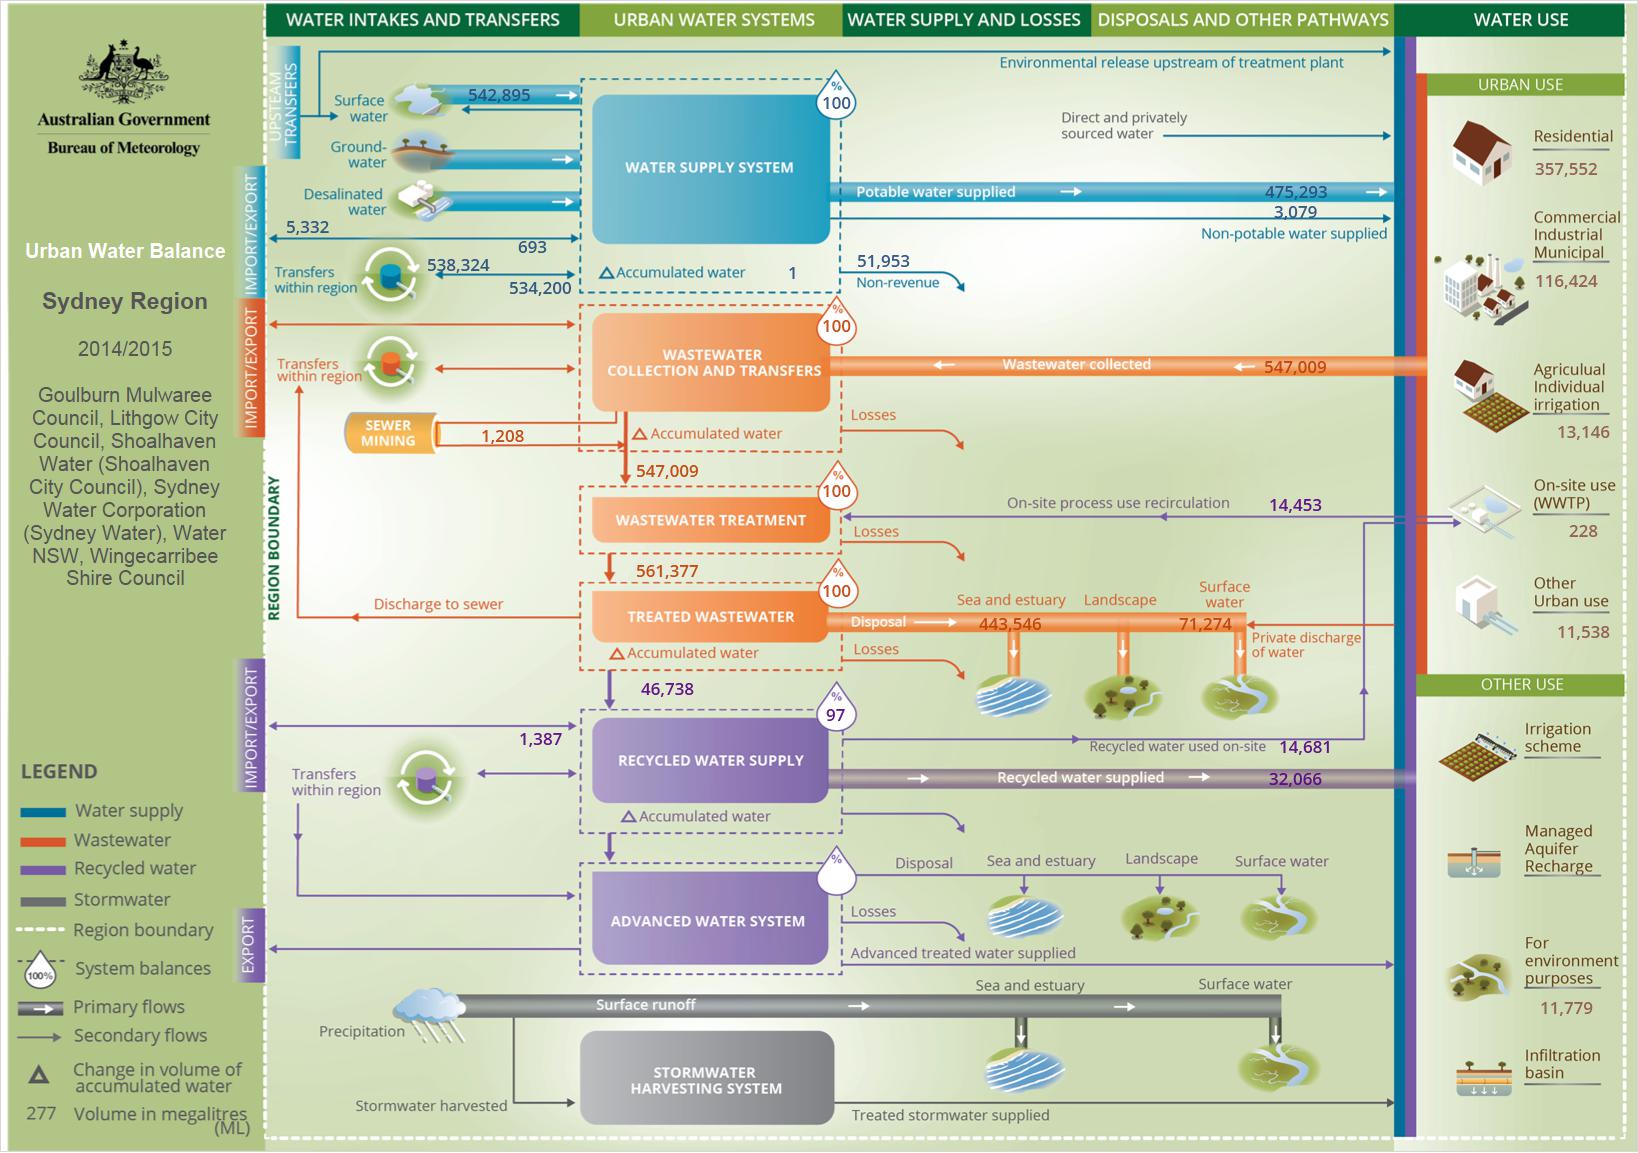
Water supply inflows
Total inflows to the water supply system were 543,588 ML and were sourced from:
- Allocated diversion: surface water—542,895 ML
- Delivery: inter-region agreement—693 ML.
Surface water is the main source for the Sydney's urban water supply system (Figure N9). Allocated diversion of surface water consists more than 99% of inflows to the system during the 2014–15 year. The total volume of surface water diverted to the urban water supply system during the 2014–15 year (543,588 ML) was relatively unchanged from the previous year (557,820 ML).
Allocated diversion (542,895 ML) consists of mostly water supplied by WaterNSW to water utilities (538,472 ML) with the balance diverted by water utilities under its entitlements. WaterNSW diverted more than 99% of its diversion to Sydney Water Corporation (516,222 ML) from its reserviors, with diversion from Prospect reservoir being the highest (408,308 ML).
Delivery of water under inter-region agreement (693 ML) contributed less than 1% of urban water supply, which is similar to volumes for previous years. This delivery refers to surface water diversion from Fish River Water Supply Scheme by Lithgow City Council.
Desalinated water was not provided to the Sydney region's urban water supply system during the 2014–15 year.
Further information on supply system inflows is available in the Supply inflows table.

Figure N9 Water sources and total volume sourced for the Sydney region's water supply system during the 2014–15 year compared with the previous year and the 5-year average
Wastewater and recycled water inflows
Total wastewater collected during the 2014–15 year was 547,009 ML, a 14% increase from the previous year. The volume of wastewater collected by each water authority is given in Figure N10. Recycled water imported into the region was 1,387 ML during the year.

Figure N10 Wastewater inflows and outflows at each water authority during the 2014–15 year
Water supply outflows
Total outflows from the water supply system decreased by approximately 2% compared with the previous year. Total outflows were 535,657 ML and comprised the following:
- Supply system delivery: urban users—478,372 ML
- Supply system transfer: inter-region—5,332 ML
- Supply system discharge: surface water—0 ML
- Leakage: groundwater—37,210 ML
- Other supply system decreases—14,743 ML.

Figure N11 Outflows from the water supply system
Further information on supply system outflows is available in the supply outflows table.
A comparison of water supply outflows with the previous year is provided in Figure N11. Delivery to urban users was relatively unchanged compared with the previous year, similar to the relatively unchanged inflows to the water supply system during the 2014–15 year (see Water supply inflows above). Sydney Water Corporation delivered 463,273 ML to urban users from its supply system which was more than 96% of supply system delivery to urban users in the region (478,372 ML).
Transfer to outside the Sydney region made up of 1% supply system outflows. It was the volume (5,332 ML) transfered by Shoalhaven City Council to its own utility area outside the Sydney region.
Losses from the urban supply system (51,953 ML) were 6% less compared with the previous year. This included 'Leakage: groundwater' and 'Other supply system decreases'. The volume of 'Other supply system decreases' comprised operational losses and all other non-revenue water from the urban water supply system, such as consumer meter inaccuracies and unauthorised consumption.
Wastewater and recycled water outflows
Total outflows from the wastewater and recycled water system increased by approximately 14% compared with the previous year. Total outflows were 547,114 ML and comprised the following:
- Evaporation—0 ML
- Recycled water delivery: urban users—20,515 ML
- Discharge: sea—443,546 ML
- Wastewater and recycled water discharge: surface water—83,053 ML
- Other wastewater and recycled water system decreases—0 ML.

Figure N12 Outflows from the wastewater and recycled water systems
The largest outflow from the wastewater system is treated wastewater discharged into the sea (443,546 ML) by the following water authorities:
- Sydney Water Corporation (443,094 ML)
- Shoalhaven City Council (452 ML).
In addition to this volume, treated wastewater and recycled water discharged to the streams and wetlands was 83,053 ML (see Figure N12) during the 2014–15 year, an increase of 39% compared with the previous year. Approximately 88% of this volume (72,970 ML) was discharged by Sydney Water Corporation. A portion of the treated wastewater discharged to streams by Sydney Water Corporation is specifically for environmental benefit. During the 2014–15 year, 11,779 ML of highly treated recycled water was released from the St Marys advanced water recycling plant to contribute to the healthy flow and water quality of the Hawkesbury-Napean River.
Recycled water delivery to urban users (20,515 ML) during the 2014–15 year was similar to that of previous year. Sydney Water delivered 16,843 ML of recycled water to users, mostly from the Wollongong Water Recycling Plant (7,056 ML). Gouldburn Mulwaree council recycled almost 100% of its collected wastewater for delivery to urban users (Figure N10).
Evaporation losses, and other wastewater and recycled water system decreases were not reported for the 2014–15 year. These losses were considered to be relatively small and their omission would not have a material impact on the water balance of the urban water system.
Recirculation of treated wastewater and recycled water that occurs in the system may be subjected to additional treatment and/or re-use on site. The reported urban system outflows exclude any such recirculated volumes in the system.
Further information on wastewater and recycled water system outflows is available in the wastewater outflows table.
Urban water system balancing item
The urban water balance (Table N10) yielded a balance item of –9,116 ML. This is less than 1% of the total urban water system inflows during the year 2014–15 year.
| Volume ML | |
| Opening balance at 1 July 2014 | 0 |
| Total urban water system inflows | 1,091,984 |
| Total urban water system outflows | (1,082,771) |
| Closing balance at 30 June 2015 | (97) |
| Balancing item | (9,116) |
The misbalance may be due to a number of factors, such as metering inaccuracies, unaccounted losses and inaccuracies in the estimation of certain volumes.
Unaccounted-for difference
The volume recognised in the water accounting statements (-42,699 ML) represents the total unaccounted-for difference for the Sydney region for the 2014–15 year.
The unaccounted-for difference is the volume necessary to reconcile the opening water storage and closing water storage with the total water inflows and total water outflows reported in the water accounting statements. It is calculated according to Table N11.
| Volume ML | |
| Opening water storage balance (1 July 2014) | 2,388,070 |
| Total water inflows | 5,947,524 |
| Total water outflows | (5,627,832) |
| Closing water storage balance (30 June 2015) | (2,665,063) |
| Unaccounted-for difference | (42,699) |
The unaccounted–for difference can also be calculated by summing the volumes necessary to reconcile (balance) the opening and closing storage with the water inflows and outflows of each of the separate water stores of the region, as shown in Table N12.
| Volume ML | |
| Surface water store | (33,583) |
| Groundwater store | – |
| Urban water system | (9,116) |
| Unaccounted-for difference | (42,699) |
Table N12 shows that the unaccounted-for difference volume is primarily explained by the balancing item of the surface water store. The surface water balancing item is largely attributed to uncertainty associated with with runoff and river outflow, and the volume of river and floodplain losses not being able to be quantified (see Surface water note).