


Melbourne: Climate and water
For the water account period 1 July 2024 to 30 June 2025
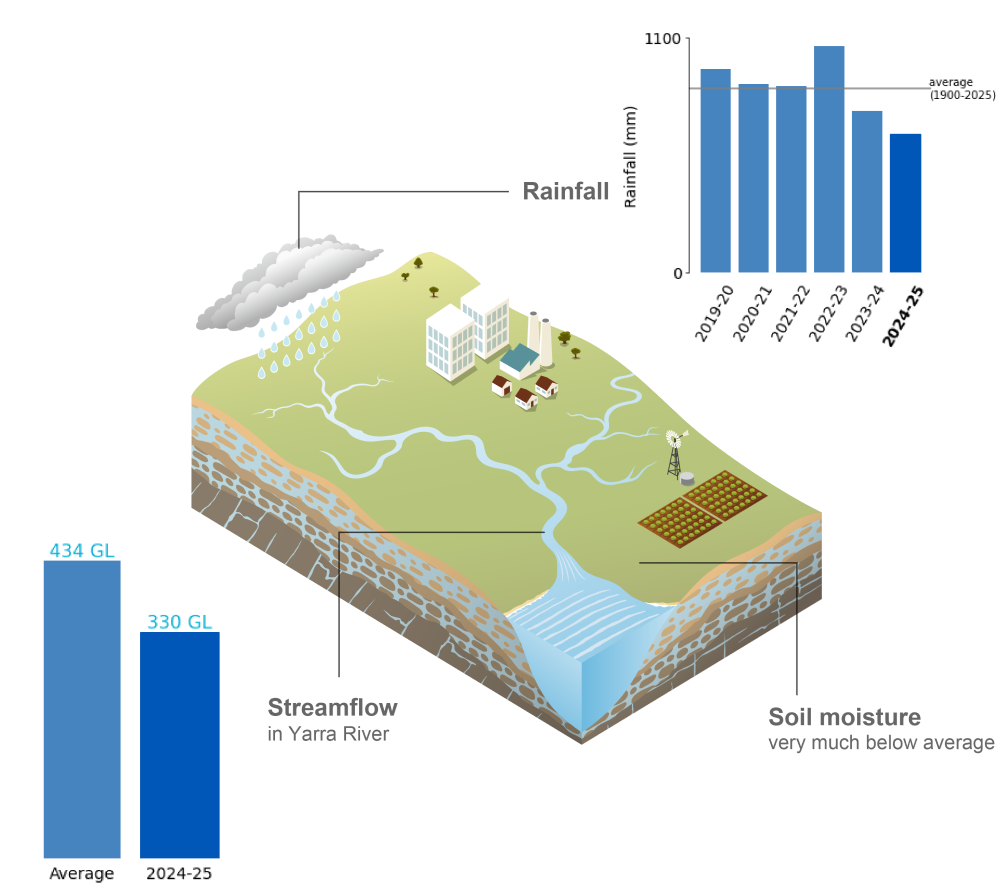
- Rainfall in the Melbourne region during 2024–25 was very much below average,despite isolated rainfall events.
- Soil moisture in the root zone (0–1 m depth) was very much below average across much of the region, reflecting persistent rainfall deficiencies and limited soil moisture recharge throughout the year.
- Streamflows across the region were well below average for most of 2024–25.
For further information on the climate and water conditions across the Melbourne region during the current reporting period, scroll down this page or click on the links below:
About the region
- The Melbourne region experiences a temperate oceanic climate, characterised by four distinctive seasons, with mild to cold winters and warm to hot summers.
- Rainfall is generally consistent throughout the year, though higher totals are more common between June and November.
- Streamflows in the region’s rivers typically reflect the seasonal distribution of rainfall throughout the year. Higher flows and storage inflows tend to occur between June and August, while lower streamflows are more prominent from January to April.
Climate conditions
Rainfall
Figure C1 Annual and monthly rainfall deciles for the Melbourne region during the 2024–25 reporting period
- Total area-averaged rainfall in the Melbourne region during 2024–25 was 648 mm around 25% below the long-term average of 861 mm.
- Two rain-bearing systems delivered more than 150 mm to parts of the region in July, particularly in the east, resulting in above to very much above average rainfall with some areas recording in the highest on decile range.
- Despite a predominantly negative Southern Annular Mode persisting in August, the region very much below average rainfall.
- Rainfall remained below average through spring and summer, consistent with generally unfavourable large-scale climate patterns on rainfall across the region.
- Despite well above-average sea surface temperatures in surrounding waters during autumn, rainfall during the season was very dry, contributing to below to very much below average for April and May.
- In late June, a pre-frontal trough combined with several cold fronts and low-pressure systems delivered very much above average rainfall to the western areas of the region, bringing monthly totals close to average.
- Further information on Australia’s climate and water during the 2024–25 reporting period can be found in the Financial Year Climate and Water Statement 2024–25.
Figure C2 Total monthly rainfall for the Melbourne region during the 2024–25 reporting period, compared with the average and percentiles for the region
- July was the only month during the 2024–25 reporting period to record rainfall above the 90th percentile.
- From August to June, rainfall remained below average in every month, with August and May ranking below the 10th percentile, while April ranked just above the 10th percentile.
Actual evapotranspiration
Figure C3 Annual and monthly actual evapotranspiration deciles for the Melbourne region during the 2024–25 reporting period
- Total area-averaged actual evapotranspiration was below to very much below average across most of the Melbourne region during 2024–25, reflecting persistently dry conditions that limited water availability throughout much of the reporting period.
- Evapotranspiration was below average across much of the region in July, due to prolonged cloud cover reducing solar radiation.
- Following the high rainfall in July, evapotranspiration increased slightly during the final month of winter and into early spring, though it remained average to below average across much of the region.
- Although rainfall was below average throughout spring and summer, evapotranspiration remained close to average across most catchments in December and January, supported by higher temperatures and residual soil moisture from winter rainfall that sustained vegetation growth before conditions dried out.
- From February onwards, evapotranspiration remained average to below average across most catchments through to June, reflecting the influence of the region’s second-driest November-to-May period on record, which limited water availability through to the end of the reporting period.
Soil moisture
Figure C4 Annual and monthly soil moisture deciles for the Melbourne region during the 2024–25 reporting period
- Total area-averaged soil moisture in the root zone (0–1 m depth) was very much below average across most of the Melbourne region during 2024–25, reflecting persistent rainfall deficiencies, high evaporative demand, and limited moisture retention throughout much of the year.
- Despite the above average rainfall in July, soil moisture levels showed limited increase early in the reporting period, as antecedent dry months in May and June 2024 reduced the effectiveness of rainfall in increasing soil moisture.
- From August onwards, soil moisture remained predominantly below average, with limited rainfall failing to adequately replenish moisture across the region’s soils.
- Dry conditions persisted through summer and autumn, with only minor and short-lived improvements in December and January, though soil moisture remained average to below average across most catchments.
- By the end of autumn, soil moisture was very much below average across almost the entire region, with isolated patches of the lowest soil moisture on record for May emerging where cumulative rainfall deficiencies were greatest.
- Further information on soil moisture conditions across the Melbourne region during the 2024–25 reporting period is available on the Australian Water Outlook.
Streamflow responses
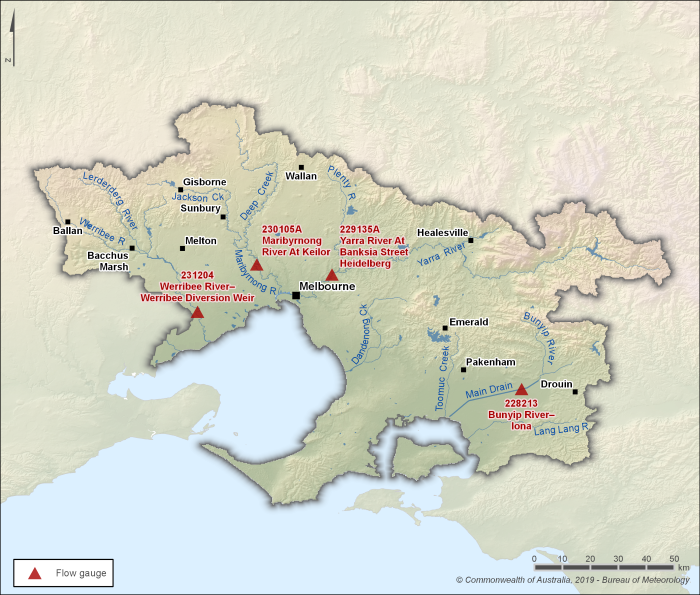
Figure C5 Key flow gauging stations along the main rivers within the Melbourne region
- There are four main river systems within the Melbourne region: the Bunyip, Maribyrnong, Werribee, and Yarra river catchments.
- Streamflows in the Maribyrnong, Werribee, and Yarra rivers are influenced by diversions for consumptive use, as well as by dam operations and spills, while flows in the Bunyip River are less affected by these factors.
- Four gauging stations (shown in Figure C5) are used to represent seasonal flow patterns in the region’s rivers.
Figure C6 Total monthly flow for major rivers in the Melbourne region during the 2024–25 reporting period, compared with the average and percentiles for each gauging station
- Streamflows across the Melbourne region were well below average during 2024–25, reflecting the persistence of dry conditions that left river systems heavily depleted for much of the reporting period.
- Although rainfall anomalies were greater across the eastern half of the region, the typically wetter Bunyip and Yarra river catchments recorded streamflows below their long-term averages.
- The drier western catchments of the Maribyrnong and Werribee rivers recorded less than half their long-term average streamflows, reflecting lower rainfall totals and limited response to isolated rainfall events such as those in July.
- Rainfall in July led to streamflows increasing in the Bunyip and Yarra river catchments, peaking above the 90th percentile at both sites. As most of the July rainfall was concentrated in the east, streamflows in the Maribyrnong and Werribee rivers remained largely unchanged.
- From August through to December, when streamflows in the region are typically at their highest, flows at all sites remained below average, consistent with the ongoing low rainfall in the region.