


Melbourne: Key findings
For the water account period 1 July 2024 to 30 June 2025
- Very much below average rainfall in the Melbourne region during 2024–25 contributing to decreased surface water inflows into the region's surface water storages.
- Streamflows across the region were well below average for most of 2024–25.
- Total storage volume in the Melbourne region decreased by 17.3% during the reporting period, finishing at 71.7% full on 30 June 2025.
Climate and water
Rainfall

648 mm
25% below the average of 861 mm
Streamflow

below average
for most of the year
Storage

71.7% full

17.3% less than last year
Water use from all sources
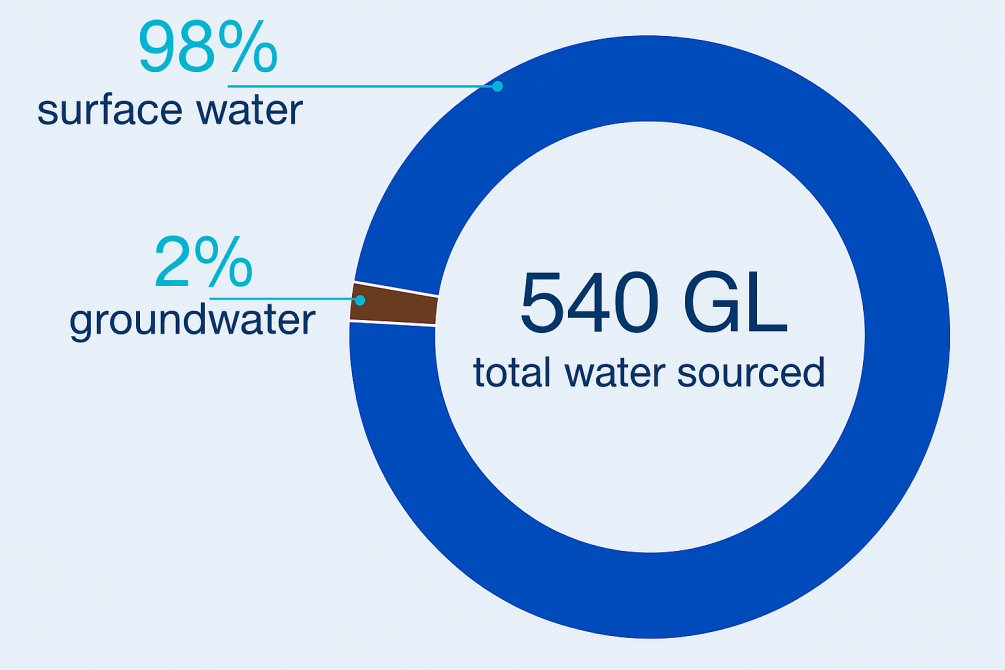
Water sourced
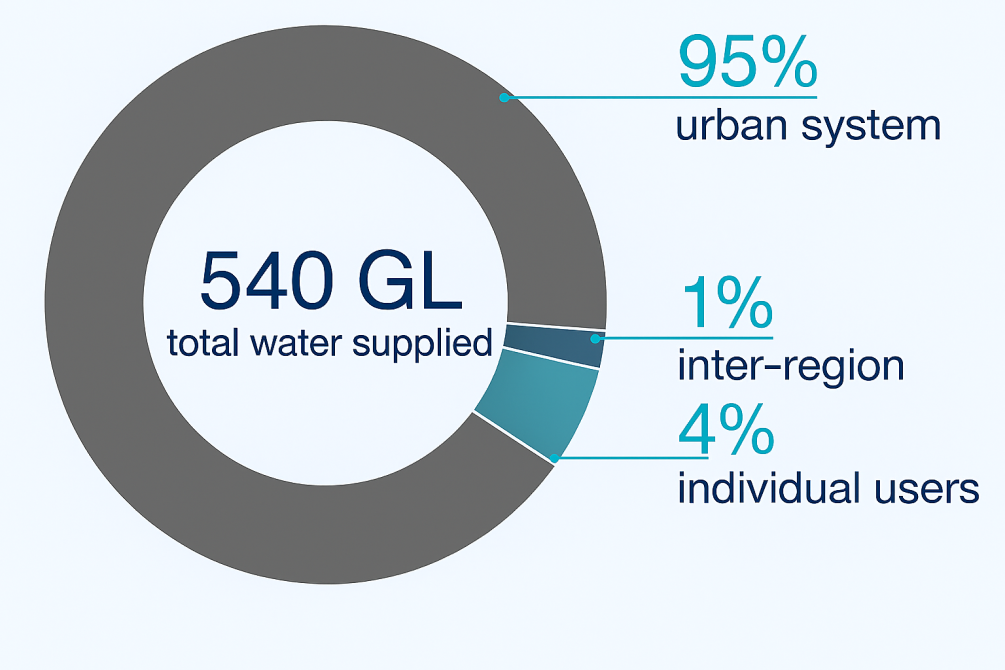
Water supplied
Water status of water resources
Water availability
2,520 GL
surface water available in 2024–25
11% less than last year
Water accessible
614 GL
total surface water and groundwater accessible in 2024–25

5% more than last year
Water taken
540 GL
total surface water and groundwater taken in 2024–25
5% more than last year