


Melbourne: Supporting information
For the water account period 1 July 2024 to 30 June 2025
- Very much below rainfall in the Melbourne region during 2024–25 contributing to decreased surface water inflows into the region's surface water storages.
- Total storage volume in the Melbourne region decreased by 17.3% during the reporting period, finishing at 71.7% full on 30 June 2025.
- Approximately 88% of surface water and groundwater resources in the Melbourne region were taken, mainly for surface water diversions to the urban system.
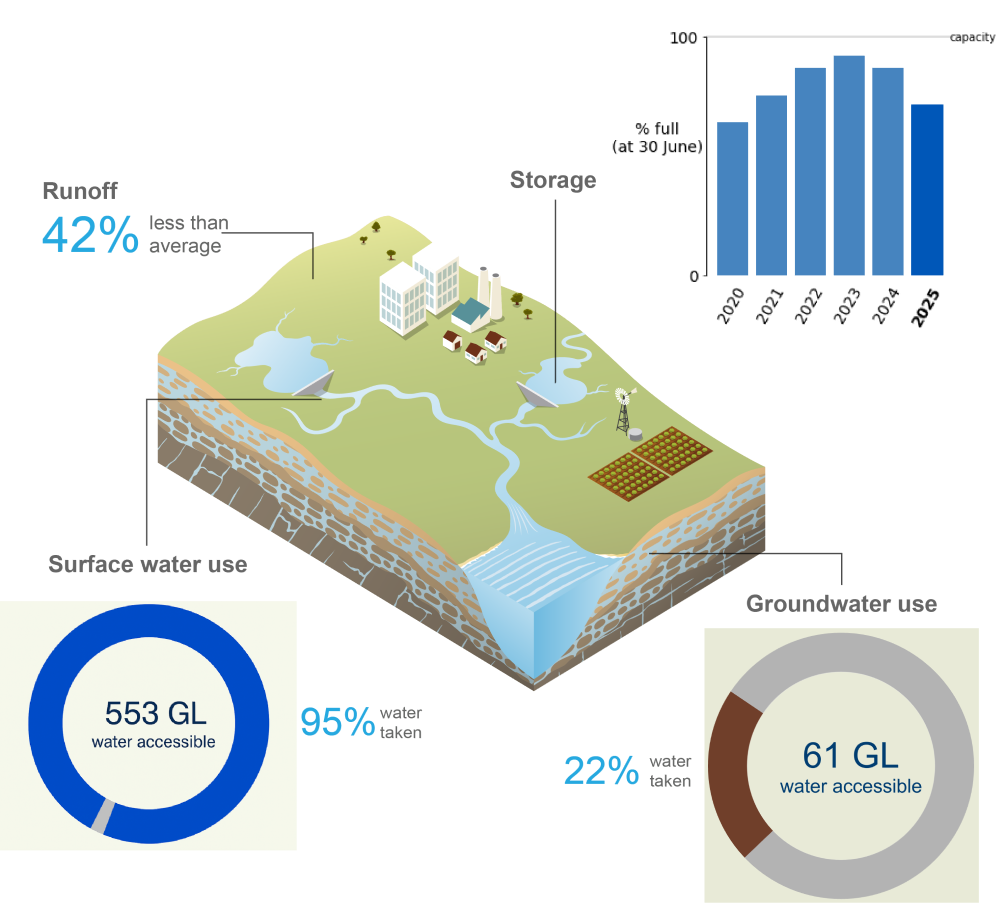
This section provides a detailed breakdown of water assets, liabilities, flows, availability, and use in the Melbourne region over the past six water accounting periods, outlining where water is stored and how it is used across the region.
For further information, scroll down this page or click on the links below:
Water assets
- Total water assets in the Melbourne region on 30 June 2025 were 1,788 GL, approximately 15% lower than the previous reporting period, entirely due to decreases in surface water assets.
- Around 80% of the region's water assets were held in surface water storages, with inter-region claims on surface water accounting for a little over 15% of the total assets.
- Groundwater aquifers made up approximately 2% of total water assets, while the remaining volume was contained within the region's urban water supply system.
- A detailed breakdown of water assets in the Melbourne region is available in the Statement of Water Assets and Water Liabilities.
Surface water assets
| Surface water | 2025 | 2024 | 2023 | 2022 | 2021 | 2020 |
| Cardinia | 170,737 | 243,742 | 247,580 | 235,252 | 207,773 | 208,122 |
| Greenvale | 18,969 | 19,815 | 23,585 | 25,433 | 22,564 | 21,716 |
| Maroondah | 7,493 | 6,144 | 22,470 | 12,950 | 21,251 | 22,177 |
| Melton | 897 | 7,590 | 11,036 | 12,146 | 14,376 | 10,030 |
| Merrimu | 21,036 | 27,913 | 28,742 | 23,693 | 14,921 | 10,245 |
| O'Shannassy | 2,552 | 2,310 | 3,250 | 3,180 | 3,117 | 2,594 |
| Pykes Creek | 11,141 | 17,330 | 19,666 | 17,322 | 20,371 | 16,344 |
| Rosslynne | 16,162 | 20,936 | 23,886 | 16,019 | 10,043 | 5,492 |
| Silvan | 34,849 | 34,941 | 35,525 | 34,980 | 36,656 | 35,551 |
| Sugarloaf | 45,270 | 84,212 | 93,545 | 93,011 | 83,417 | 90,115 |
| Tarago | 32,474 | 37,755 | 37,918 | 37,836 | 37,924 | 31,536 |
| Thomson | 844,392 | 990,778 | 1,032,372 | 962,548 | 789,695 | 638,910 |
| Upper Yarra | 117,401 | 119,600 | 135,057 | 138,972 | 128,308 | 79,116 |
| Yan Yean | 21,092 | 28,306 | 29,151 | 29,257 | 27,006 | 26,030 |
| Accessible total | 1,344,465 | 1,641,372 | 1,743,783 | 1,642,599 | 1,417,422 | 1,197,978 |
| Dead storage | 76,623 | 76,623 | 76,623 | 76,623 | 76,623 | 76,623 |
| Total storage | 1,421,088 | 1,717,995 | 1,820,406 | 1,719,222 | 1,494,045 | 1,274,601 |
| Total capacity | 1,980,744 | 1,980,744 | 1,980,744 | 1,980,744 | 1,980,744 | 1,980,744 |
| % full | 71.7% | 86.7% | 91.9% | 86.8% | 75.4% | 64.3% |
- The total storage volume in the Melbourne region decreased by 17.3% during 2024–25, finishing at 71.7% full on 30 June 2025.
- Although the Thomson Reservoir is located outside the Melbourne region, it holds approximately 55% of the region's total surface water storage capacity.
- Water is transferred from the Thomson Reservoir to the Upper Yarra Reservoir via the Thomson–Yarra pipeline for distribution within the Melbourne region’s urban water supply system.
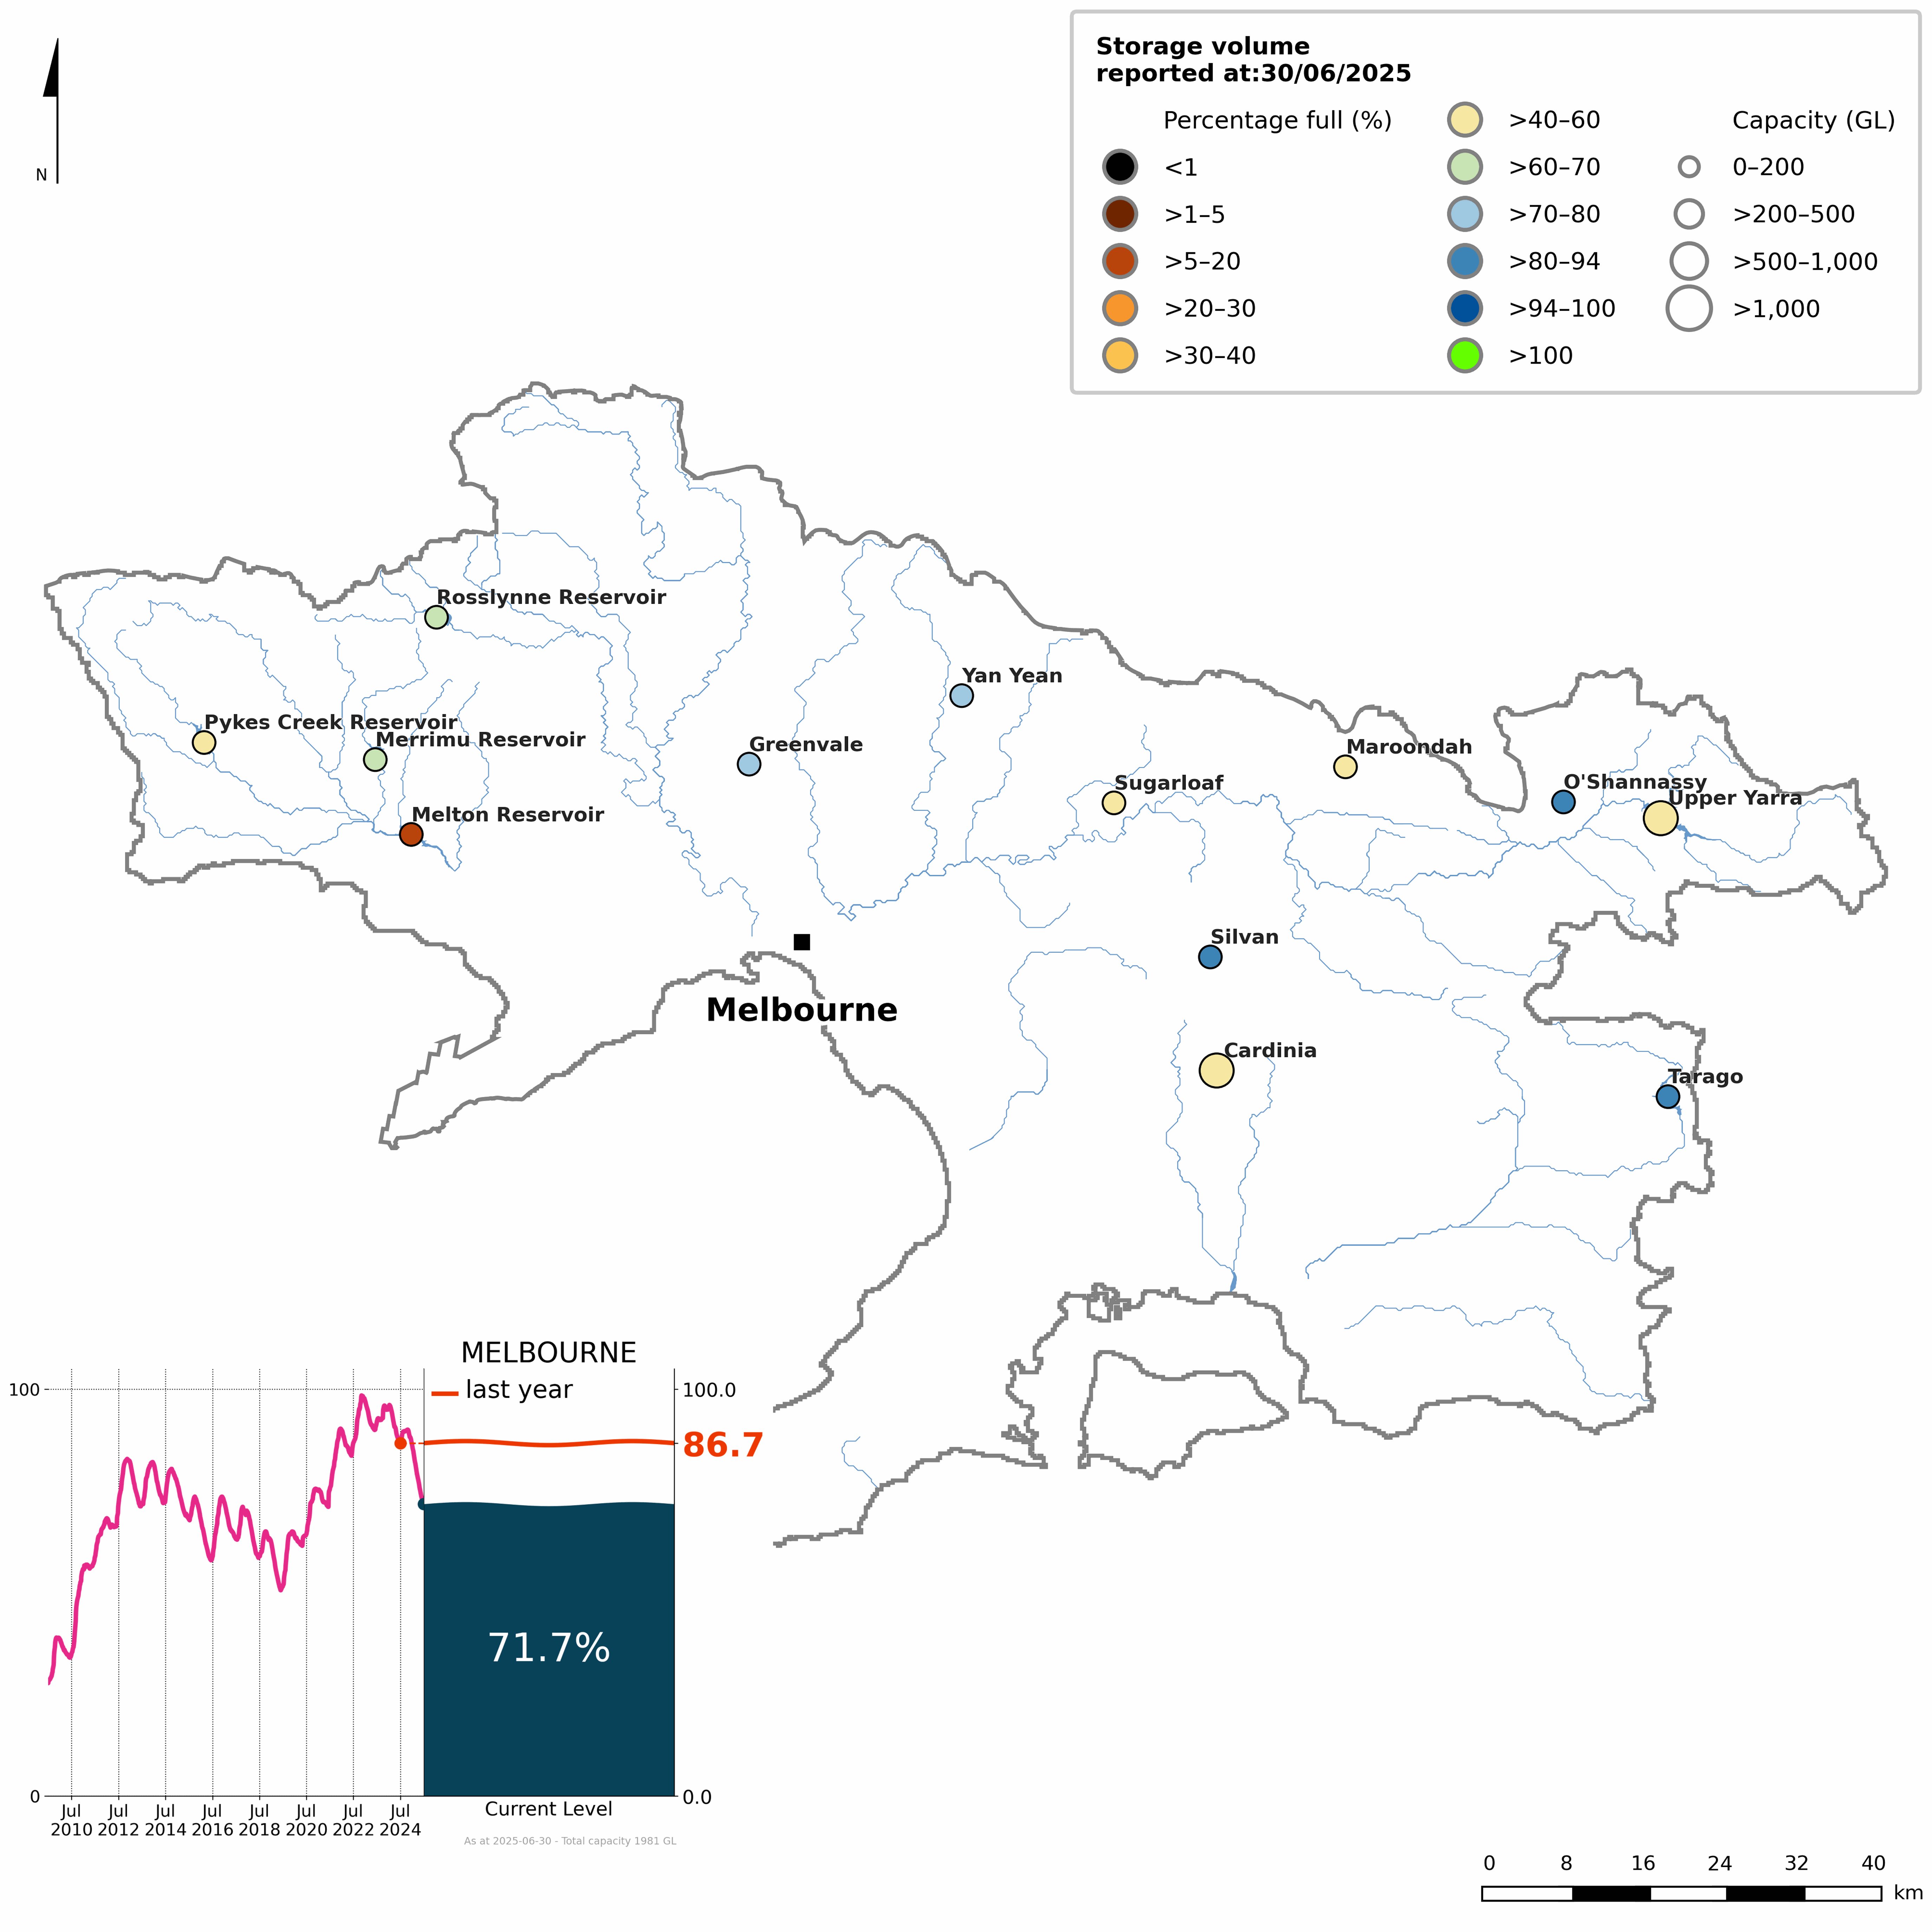
Figure S1 Percentage-full volume on 30 June 2025 for each storage and total storage volume since July 2009 (inset)
- The total storage volume in the Melbourne region began the 2024–25 reporting period at 87% full, the third-highest opening storage volume since 1980.
- In response to the region's fifth-wettest July on record, storage levels increased during the latter part of winter, reaching around 90% full by late August, and remaining relatively stable through to the end of October.
- From November, storage volumes steadily declined through to the end of the reporting period, following the region's second-driest November-to-May period on record.
- By 30 June 2025, the total storage volume in the Melbourne region was 72% full, down 17% from the previous reporting period, reflecting reflecting a decrease of surface water inflows to replenish the region's storages.
- More detailed information on individual storages in the Melbourne region is available on the Bureau of Meteorology's Water Information Dashboard.
Inter-region claims
- The Melbourne region holds bulk water entitlements to access water from two key inter-regional sources—Lake Eildon, part of the Goulburn and Murray systems, and Silver and Wallaby creeks, located in the Goulburn River catchment northeast of the region.
- Up to 66 GL of water may be diverted from Silver and Wallaby creeks into Melbourne's storage system over a rolling three-year period.
- From the Goulburn and Murray systems, up to 75 GL per year may be diverted, but only under limited circumstances, such as during periods of critical human need or to support local fire-fighting efforts.
- Water from these sources is delivered into the region via major pipelines, including the North–South Pipeline, and contributes to securing Melbourne's water supply during dry periods.
- More information on inter-region transfers is available in the Region description.
| Description | 2025 | 2024 | 2023 | 2022 | 2021 | 2020 | |
| Opening balance at 01 July | 294,916 | 294,916 | 294,768 | 293,945 | 362,808 | 399,661 | |
| add | Inter-region claims on surface water | - | - | 46,444 | 18,890 | 12,861 | 0 |
| less | Delivery received on surface water inter-region claims | - | - | 7 | 4 | 70,082 | 36,853 |
| less | Adjustments on inter-region claims on surface water | - | - | 46,289 | 18,063 | 11,642 | 0 |
| Closing balance at 30 June | 294,916 | 294,916 | 294,916 | 294,768 | 293,945 | 362,808 | |
- Inter-region claims data for the Melbourne region was not reported for the 2023–24 and 2024–25 reporting periods, with no additions, deliveries, or adjustments recorded in the table for these years.
- The opening and closing balance of inter-region claims on surface water remained at 295 GL during 2024–25; however, this reflects the unavailability of data required to update these balances, rather than actual inter-region claim activity.
Water liabilities
- Water liabilities in the Melbourne region refer to the volume of allocation remaining on licence entitlements and inter-region commitments at the end of the reporting period (30 June).
- Carryover provisions apply to most surface water supply licences in the Melbourne region, allowing any unused portion of allocation to be carried over into the next reporting period.
- No carryover provisions apply to groundwater supply licences or inter-region commitments; therefore, any unused allocation is forfeited at the end of the reporting period, resulting in a closing balance of 0 ML for these liability types.
- A more detailed description of water allocations in the Melbourne region is provided in the Water use section.
Surface water liabilities
| Description | 2025 | 2024 | 2023 | 2022 | 2021 | 2020 | |
| Opening balance at 01 July | 0 | 0 | 0 | 0 | 11,229 | 5,958 | |
| add | Allocations | 22,718 | 22,744 | 22,939 | 22,954 | 22,726 | 16,787 |
| less | Allocated diversions | 402 | 8,518 | 8,311 | 8,311 | 8,664 | 8,651 |
| less | Adjustments and forfeitures | 22,316 | 14,226 | 14,628 | 14,643 | 25,291 | 2,865 |
| Closing balance at 30 June | 0 | 0 | 0 | 0 | 0 | 11,229 | |
| Description | 2025 | 2024 | 2023 | 2022 | 2021 | 2020 | |
| Opening balance at 01 July | 0 | 0 | 0 | 0 | 0 | 0 | |
| add | Allocations | 8,155 | 8,155 | 5,625 | 5,225 | 5,225 | 5,225 |
| less | Allocated diversions | 4,749 | 4,503 | 4,178 | 3,337 | 3,647 | 4,263 |
| less | Adjustments and forfeitures | 3,406 | 3,652 | 1,447 | 1,888 | 1,578 | 962 |
| Closing balance at 30 June | 0 | 0 | 0 | 0 | 0 | 0 | |
- Surface water allocations for individual users in the Melbourne region during 2024–25 were 23 GL, similar to recent years, with no water carried over from the previous reporting period.
- Approximately 2% of surface water allocations for individual users was diverted across the Melbourne region, substantially lower than in previous reporting periods, with most allocations forfeited at the end of the year.
- Inter-region commitments in the Melbourne region were unchanged from the previous reporting period, entirely from bulk water entitlements held by South Gippsland Water, totalling 8 GL.
- 5 GL of inter-region commitments were delivered during the reporting period, with the remaining volume forfeited on 30 June 2025.
Groundwater liabilities
| Description | 2025 | 2024 | 2023 | 2022 | 2021 | 2020 | |
| Opening balance at 01 July | 0 | 0 | 0 | 0 | 0 | 0 | |
| add | Allocations | 60,820 | 66,610 | 66,017 | 66,633 | 67,987 | 65,464 |
| less | Allocated extractions | 13,036 | 15,559 | 16,322 | 16,781 | 17,560 | 18,279 |
| less | Adjustments and forfeitures | 47,784 | 50,451 | 49,695 | 49,852 | 50,427 | 47,185 |
| Closing balance at 30 June | 0 | 0 | 0 | 0 | 0 | 0 | |
- Groundwater allocations for individual users in the Melbourne region during 2024–25 were 61 GL, slightly lower than recent reporting periods, but within the typical range since the account commenced.
- Approximately 20% (13 GL) of groundwater allocations were extracted during the reporting period, around 15% lower than the previous year, and the lowest extraction volume since the Melbourne account was first published in 2010–11.
- As no carryover provisions apply to groundwater licences, the remaining volume of groundwater allocations (48 GL) was forfeited at the end of the reporting period.
Water flows
- Water flows in the Melbourne region describe the movement of water between surface water, groundwater, and the urban system.
- A summary of total inflows and outflows for each water store is provided below.
- For a detailed breakdown of inflows and outflows in the Melbourne region, refer to the Statement of Changes in Water Assets and Water Liabilities.
| Water inflows | 2025 | 2024 | 2023 | 2022 | 2021 | 2020 |
| Surface water inflows | 1,165,161 | 1,421,285 | 2,917,064 | 1,903,851 | 1,991,223 | 2,345,885 |
| Groundwater inflows | 547,336 | 654,136 | 801,743 | 718,286 | 684,641 | 604,260 |
| Urban system inflows | 926,222 | 893,066 | 870,924 | 859,122 | 832,175 | 852,922 |
| Total water inflows | 2,638,179 | 2,968,487 | 4,589,731 | 3,481,259 | 3,508,039 | 3,803,067 |
- Total water inflows to the Melbourne region during 2024–25 were 2,638 GL, approximately 10% lower than the previous reporting period, and 45% lower than the higher inflow volumes observed in 2022–23, reflecting decreased surface water inflows across the region.
- Surface water inflows contributed around 45% (1,165 GL) of total inflows, decreasing by a little under 20% compared to the previous reporting period, heavily influenced by reduced runoff into the region's surface water storages.
- Groundwater inflows made up close to 547 GL of total inflows, representing a 15% decrease from the previous reporting period, with recharge from the landscape comprising 60% of groundwater inflows.
- Urban system inflows accounted for the remaining volume (926 GL) of total inflows, slightly higher than the previous reporting period, primarily driven by changes in the diversion of surface water and wastewater collected.
| Water outflows | 2025 | 2024 | 2023 | 2022 | 2021 | 2020 |
| Surface water outflows | 1,545,860 | 2,001,644 | 3,673,809 | 2,260,848 | 1,967,155 | 2,029,340 |
| Groundwater outflows | 142,331 | 148,902 | 147,444 | 128,104 | 132,335 | 202,729 |
| Urban system outflows | 913,895 | 888,366 | 709,941 | 857,713 | 830,530 | 837,166 |
| Total water outflows | 2,602,086 | 3,038,912 | 4,531,194 | 3,246,665 | 2,930,020 | 3,069,235 |
- Total water outflows from the Melbourne region during 2024–25 were 2,602 GL, around 15% lower than the previous reporting period, and 45% below the elevated outflow volumes observed in 2022–23, reflecting decreases in the region's surface water inflows limiting outflow response.
- Surface water outflows represented the largest component of total outflows, accounting for approximately 60% (1,546 GL), declining by about 25% compared to the previous reporting period, largely due to a reduction in outflows to sea, recharge to groundwater, and overbank flow.
- Groundwater outflows made up slightly more than 5% (142 GL) of total outflows, similar to recent reporting periods, primarily driven by inter-region coastal outflows.
- Urban system outflows contributed the remaining 35% (914 GL) of total outflows, the highest volume since the account commenced in 2010–11, corresponding to increased supply of drinking water to urban customers.
Water availability
| Surface water | 2025 | 2024 | 2023 | 2022 | 2021 | 2020 |
| Water availability | 2,520,234 | 2,837,480 | 4,104,386 | 2,957,136 | 2,693,916 | 2,915,566 |
| Water accessible | 552,860 | 517,352 | 491,273 | 360,047 | 365,144 | 376,208 |
| Water taken | 527,138 | 499,474 | 475,198 | 343,516 | 338,275 | 361,153 |
| % water accessible taken | 95% | 97% | 97% | 95% | 93% | 96% |
- Surface water availability in the Melbourne region during 2024–25 was 2,520 GL, approximately 10% lower than the previous reporting period, and 40% below the elevated levels observed in 2022–23.
- Changes in water availability across the Melbourne region are heavily influenced by runoff. Generally, when runoff increases or decreases, water availability responds in a similar way.
- Surface water accessible for take was slightly higher than the previous reporting period, and the highest volume since the account commenced in 2010–11, with diversions to the urban system being the major component.
- Water taken from surface water resources in the Melbourne region was the highest in the account's history, corresponding to increased diversions to the urban system.
- Overall, approximately 95% of surface water accessible for take in the Melbourne region was taken, primarily for diversions to the urban system.
Water use
Consumptive use
- A total of 540 GL of water was taken from surface water and groundwater resources for consumptive use in the Melbourne region during 2024–25, around 5% higher than the previous reporting period, and the highest since the account commenced in 2010–11, largely driven by increased surface water diversions to the urban system.
| Surface water | 2025 | 2024 | 2023 | 2022 | 2021 | 2020 |
| Individual users | 8,856 | 17,633 | 19,916 | 19,916 | 19,503 | 18,974 |
| Inter-region | 4,749 | 4,503 | 4,178 | 3,337 | 3,647 | 4,263 |
| Urban system | 513,533 | 477,338 | 451,104 | 320,263 | 315,125 | 337,915 |
| Total | 527,138 | 499,474 | 475,198 | 343,516 | 338,275 | 361,152 |
- Surface water diversions in the Melbourne region during 2024–25 were 527 GL, around 5% higher than the previous reporting period, and the highest volume since the account commenced in 2010–11, reflecting increased diversions to the urban system.
- Approximately 97% of surface water diversions in the Melbourne region were to the urban system, while individual users accounted for less than 2% of total diversions.
- The remaining volume 5 GL of surface water diversions was taken by inter-region users with statutory rights under South Gippsland Water's bulk water entitlements.
| Groundwater | 2025 | 2024 | 2023 | 2022 | 2021 | 2020 |
| Individual users | 13,036 | 15,559 | 16,322 | 16,781 | 17,560 | 18,279 |
| Urban system | 90 | 51 | 81 | 61 | 76 | 72 |
| Total | 13,126 | 15,610 | 16,403 | 16,842 | 17,636 | 18,351 |
- Groundwater extractions in the Melbourne region during 2024–25 were 13 GL, approximately 15% lower than the previous reporting period.
- More than 99% of groundwater extractions were made by individual users, with the urban system accounting for the remaining volume of extractions.
Allocations and diversions
| Surface water | 2025 | 2024 | 2023 | 2022 | 2021 | 2020 |
| Individual users | ||||||
| Carryover | 0 | 0 | 0 | 0 | 11,229 | 5,958 |
| Allocated announcements | 22,718 | 22,744 | 22,939 | 22,954 | 22,726 | 16,787 |
| Allocated diversions | 402 | 8,518 | 8,311 | 8,311 | 8,664 | 8,651 |
| % used | 2% | 37% | 36% | 36% | 26% | 38% |
| Inter-region | ||||||
| Carryover | 0 | 0 | 0 | 0 | 0 | 0 |
| Allocated announcements | 8,155 | 8,155 | 5,625 | 5,225 | 5,225 | 5,225 |
| Allocated diversions | 4,749 | 4,503 | 4,178 | 3,337 | 3,647 | 4,263 |
| % used | 58% | 55% | 74% | 64% | 70% | 82% |
| Total | ||||||
| Carryover | 0 | 0 | 0 | 0 | 11,229 | 5,958 |
| Allocations | 30,873 | 30,899 | 28,564 | 28,179 | 27,951 | 22,012 |
| Allocated diversions | 5,151 | 13,021 | 12,489 | 11,648 | 12,311 | 12,914 |
| % used | 17% | 42% | 44% | 41% | 31% | 46% |
- Total surface water allocations in the Melbourne region during 2024–25 were 31 GL, similar to the previous reporting period, but higher than most others.
- Surface water allocations for individual users were 23 GL, consistent with recent reporting periods, though only around 2% of these allocations were used.
- Inter-region allocations remained unchanged from the previous reporting period, with South Gippsland Water holding two bulk water entitlements totalling 8 GL, of which less than 60% was diverted from the Tarago Reservoir and Tarago River, in accordance with the bulk water entitlement licences.
- Overall, approximately 15% of allocated surface water was diverted during the reporting period, around 60% lower than the previous reporting period.
| Groundwater | 2025 | 2024 | 2023 | 2022 | 2021 | 2020 |
| Individual users | ||||||
| Carryover | 0 | 0 | 0 | 0 | 0 | 0 |
| Allocated announcements | 60,820 | 66,010 | 66,017 | 66,633 | 67,987 | 65,464 |
| Allocated extractions | 13,036 | 15,559 | 16,322 | 16,781 | 17,560 | 18,279 |
| % used | 21% | 24% | 25% | 25% | 26% | 28% |
- Total groundwater allocations in the Melbourne region during 2024–25 were 61 GL, entirely for individual users, and the lowest since the 2016–17 reporting period.
- Approximately 20% (13 GL) of groundwater allocations in the Melbourne region were extracted by individual users during the reporting period, the lowest since 2010–11.
- As no carryover provisions apply to groundwater licences in the Melbourne region, all unused groundwater allocations were forfeited at the end of the reporting period.
Urban supply system
| Water sources | 2025 | 2024 | 2023 | 2022 | 2021 | 2020 |
| Surface water | 513,533 | 477,338 | 451,104 | 320,263 | 315,125 | 337,915 |
| Groundwater | 90 | 51 | 81 | 61 | 76 | 72 |
| Desalinated water | 0 | 0 | 4,182 | 125,000 | 125,000 | 118,132 |
| Total urban water supplied | 513,623 | 477,389 | 455,367 | 445,324 | 440,201 | 456,119 |
- A total of 514 GL of water was sourced to Melbourne's urban supply system during 2024–25, approximately 10% higher than the previous reporting period, and the highest volume since the account commenced in 2010–11, reflecting increased surface water diversions to the urban system.
- More than 99% of total urban supply in the Melbourne region came from surface water storages, around 8% higher than the previous reporting period, and the highest in the account's history.
- Groundwater accounted for less than 1% of the region's urban supply, while no water was supplied by the desalination plant during the reporting period.
- In April 2024, the Victorian Government announced that no desalinated water delivery was required during the 2024–25 financial year, due to adequate water availability across the Melbourne region.
- Since first operating in 2016–17, the desalination plant has delivered 456 GL of water to Melbourne's urban supply system, supporting water demand during periods of drier conditions.
- For more information on the use of desalinated water in the Melbourne region, visit the Victorian Desalination Plant website.
| Supply of drinking water | 2025 | 2024 | 2023 | 2022 | 2021 | 2020 |
| Residential customers | 322,269 | 309,293 | 180,062 | 301,497 | 302,632 | 296,720 |
| Commercial & industrial customers | 112,232 | 104,420 | 70,463 | 93,535 | 89,261 | 99,631 |
| Agricultural & irrigation customers | 158 | 0 | 0 | 0 | 0 | 107 |
| Other customers | 5,391 | 5,292 | 4,787 | 4,855 | 3,978 | 4,642 |
| Total drinking water used | 440,050 | 419,005 | 255,312 | 399,887 | 395,871 | 401,100 |
- A total of 440 GL of drinking water (excluding recycled water) was supplied to urban customers in the Melbourne region during 2024–25, slightly higher than the previous reporting period, and the highest volume since the account commenced in 2010–11.
- Residential customers accounted for the majority of drinking water use, comprising approximately 73% (322 GL) of total urban water use.
- Commercial and industrial customers used 112 GL of total consumption, while other users accounted for just over 1% (5 GL).
- The remaining volume of drinking water was supplied to agricultural and irrigation users, though they represented a negligible proportion of total urban water use.