


Ord: Climate and water
For the water account period 1 July 2024 to 30 June 2025
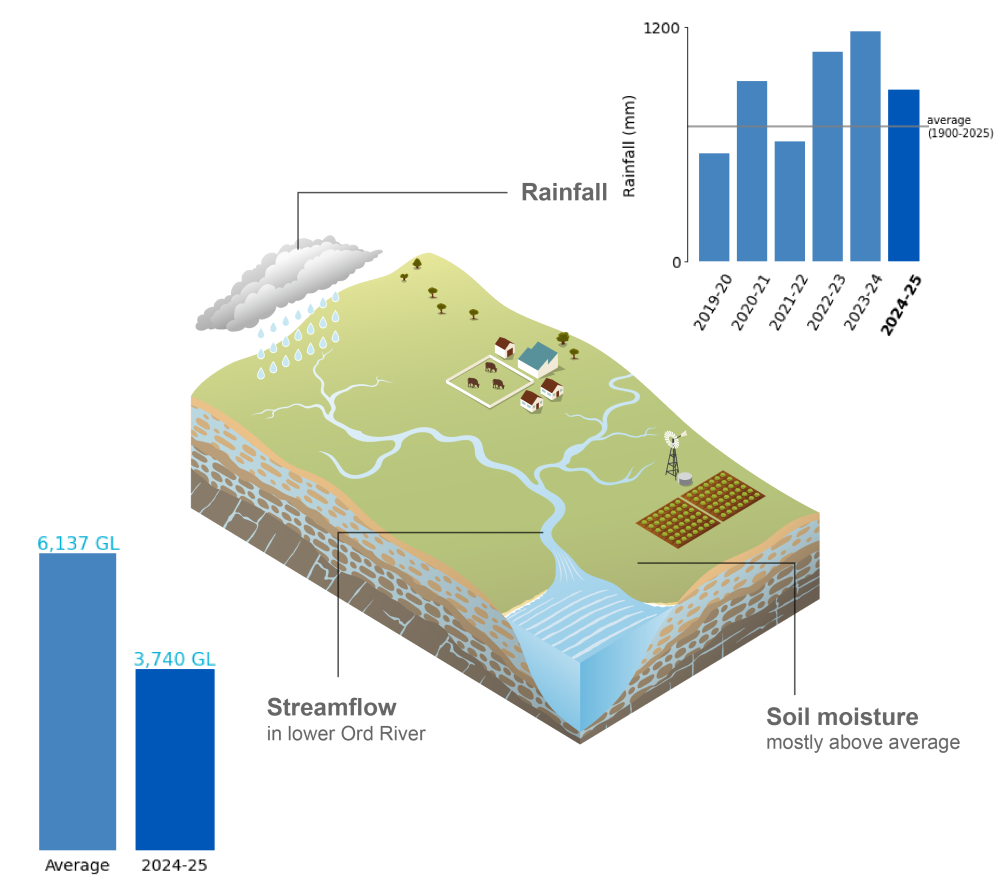
- Rainfall in the Ord region during 2024–25 was above average for the third consecutive year.
- Soil moisture in the root zone (0–1 m depth) was generally above average across much of the region, reflecting the influence of widespread rainfall during late September and late May.
- Streamflows remained below average across the region throughout much of the reporting period, despite above-average rainfall, with flows at all sites less than half the long-term average during the northern wet season.
For further information on the climate and water conditions across the Ord region during the current reporting period, scroll down this page or click on the links below:
About the region
- The Ord region experiences a tropical climate, characterised by hot, humid summers and warm, dry winters.
- Almost all of the region’s rainfall occurs during the northern wet season between October and April.
- Streamflows in the Ord River downstream of Lake Argyle are managed through water releases to maintain minimum environmental flows in the lower Ord River. Consequently, flows in the lower Ord River are perennial, while streamflows upstream of Lake Argyle can cease to flow during the dry season between May and September.
Climate conditions
Rainfall
Figure C1 Annual and monthly rainfall deciles for the Ord region during the 2024–25 reporting period
- Total area-averaged rainfall in the Ord region during 2024–25 was 878 mm, slightly greater than 25% above the long-term average of 692 mm, marking the third consecutive year of above-average rainfall.
- Little to no rainfall was observed across the region in July and August, which is relatively common during the middle of the dry season.
- An upper-level trough, combined with tropical moisture, triggered several days of widespread rainfall during late September, resulting in very much above average rainfall, with some areas recording highest on record.
- Widespread thunderstorm activity throughout November produced above to very much above average rainfall to the region.
- Despite the northern monsoon onset occurring much later than usual, beginning in early February, rainfall over summer was close to average across most of the region.
- Rainfall during the 2024–25 northern wet season was above the long-term average, accounting for approximately 85-90% of the total rainfall recorded during the reporting period.
- In late May, a north-west cloud band produced unseasonably widespread heavy falls across the region, resulting very much above average rainfall with areas in the south receiving highest decile on record.
- Further information on the 2024–25 northern wet season can be found in Australia's 2024–25 Northern Wet Season, while more details on Australia's climate and water during the 2024–25 reporting period can be found in the Financial Year Climate and Water Statement 2024–25.
Figure C2 Total monthly rainfall for the Ord region during the 2024–25 reporting period, compared with the average and percentiles for the region
- Rainfall in September and May was well above the 90th percentile, while November also exceeded the 90th percentile.
- No month during the wet season recorded rainfall below the 10th percentile.
- Outside of the wet season, rainfall in July, August, and June was close to zero, though this is not unusual for these months.
Actual evapotranspiration
Figure C3 Annual and monthly actual evapotranspiration deciles for the Ord region during the 2024–25 reporting period
- Total area-averaged actual evapotranspiration was above average to very much above average across most of the Ord region during 2024–25, consistent with above-average rainfall and sustained water availability throughout much of the reporting period.
- During July and August, evapotranspiration was generally above average to very much above average across much of the region, despite little to no rainfall, likely reflecting the retention of soil moisture and water availability following the previous wet season.
- In response to widespread rainfall during late September, evapotranspiration increased to very much above average across large parts of the region, with some areas recording their highest evapotranspiration on record for September.
- Throughout October to December, evapotranspiration remained above average to very much above average across most of the region, supported by favourable surface moisture conditions and widespread rainfall during spring and early summer.
- Although evapotranspiration eased back during January and February, it remained average to above average across parts of the region, indicating that available moisture was still sufficient despite the delayed onset of the northern monsoon.
- Following mixed conditions in March and April, evapotranspiration increased again during May and June, becoming above average to very much above average across most of the region in response to renewed moisture availability associated with late wet-season rainfall and unseasonably heavy falls during May.
Soil moisture
Figure C4 Annual and monthly soil moisture deciles for the Ord region during the 2024–25 reporting period
- Total area-averaged soil moisture in the root zone (0–1 m depth) was generally above average across much of the Ord region during 2024–25, reflecting above-average rainfall and improved soil moisture recharge throughout much of the reporting period.
- Despite little to no rainfall during July and August, soil moisture remained mostly average to above average across the Ord region, likely reflecting residual soil moisture carried over from the previous wet season.
- Widespread rainfall in late September drove a sharp increase in soil moisture, with conditions becoming very much above average across most of the region and some areas recording their highest soil moisture on record for the month.
- Conditions remained generally above average from October to December across much of the region, as repeated rainfall events helped maintain elevated soil moisture levels through spring and early summer.
- A gradual decline in soil moisture occurred from January to March, with conditions mostly returning to average across the region and some below-average pockets emerging by the end of summer as soil moisture stores were progressively depleted.
- Late wet-season rainfall and the widespread heavy falls in May contributed to a renewed increase in soil moisture, which became above average to very much above average across much of the region by the end of the reporting year.
- Further information on the soil moisture conditions across the Ord region during the 2024–25 reporting period is available on the Australian Water Outlook.
Streamflow responses
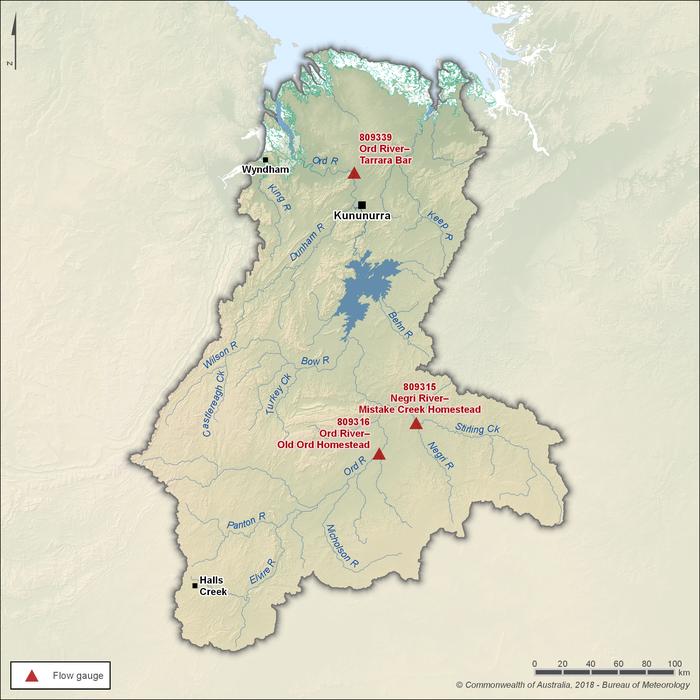
Figure C5 Key flow gauging stations along the main rivers within the Ord region
- The Upper Ord and Negri rivers are the two primary river systems that flow into Lake Argyle—one of the largest reservoirs in Australia.
- Three gauging stations, shown in Figure C5, are used to represent seasonal flow patterns in the region’s rivers, with two situated upstream of Lake Argyle on the Upper Ord and Negri rivers, and one monitoring flows downstream of Lake Argyle.
- Upstream of Lake Argyle, streamflows are usually low during the dry season and can periodically cease to flow.
- Downstream of Lake Argyle, the Ord River maintains perennial flows that are regulated by releases from Lake Argyle to support minimum environmental flows, hydroelectricity generation, consumptive use, dam operations, and storage overflows.
Figure C6 Total monthly flow for major rivers in the Ord region during the 2024–25 reporting period, compared with the average and percentiles for each gauging station
- Streamflows in the Ord region during 2024–25 were below average, with the strongest flow responses upstream of Lake Argyle occurring during the northern wet season between December and March, while flows in the Ord River downstream of Lake Argyle were highest in July due to sustained spill releases following storage levels exceeding 150% capacity in early 2024.
- At the two upstream gauging stations, streamflows were well below average, with the Negri River at Mistake Creek Homestead (Station 809315) and the Ord River at Old Ord Homestead (Station 809316) recording below their long-term averages.
- Downstream of Lake Argyle, the Ord River at Tararra Bar (Station 809339) recorded annual streamflows below the long-term average of 614 GL, despite elevated flows at the start of the reporting period associated with ongoing spill releases.
- During the dry season, streamflows in the Negri and Upper Ord rivers remained low, with little to no rainfall across the region. In contrast, flows in the lower Ord River remained close to the 90th percentile, supported by releases from Lake Argyle and Lake Kununurra prior to the wet season.
- With the onset of wet-season rainfall, streamflows at the upstream sites began to increase during December, peaking between January and February, but remained well below average throughout the wet season. Flows in the lower Ord River also declined during this period as regulated releases eased following reduced storage levels.
- From March onwards, streamflows at the upstream sites declined rapidly, returning to baseflow conditions as rainfall decreased, while flows in the lower Ord River also remained below average through this period.
- Despite unseasonably high rainfall during the final week of May, streamflows at all sites remained relatively low, with upstream rivers showing little response through to the end of the reporting period.