


Ord: Supporting information
For the water account period 1 July 2024 to 30 June 2025
- Rainfall in the Ord region during 2024–25 was above average for the third consecutive year, although runoff and surface water inflows into the region’s storages were below average.
- Total storage volume in the Ord region decreased by 15.7% during the reporting year, finishing at 96.2% full on 30 June 2025.
- Approximately 30% of the water resources accessible for take in the Ord region were used, primarily for surface water diversions to irrigation and agricultural users.
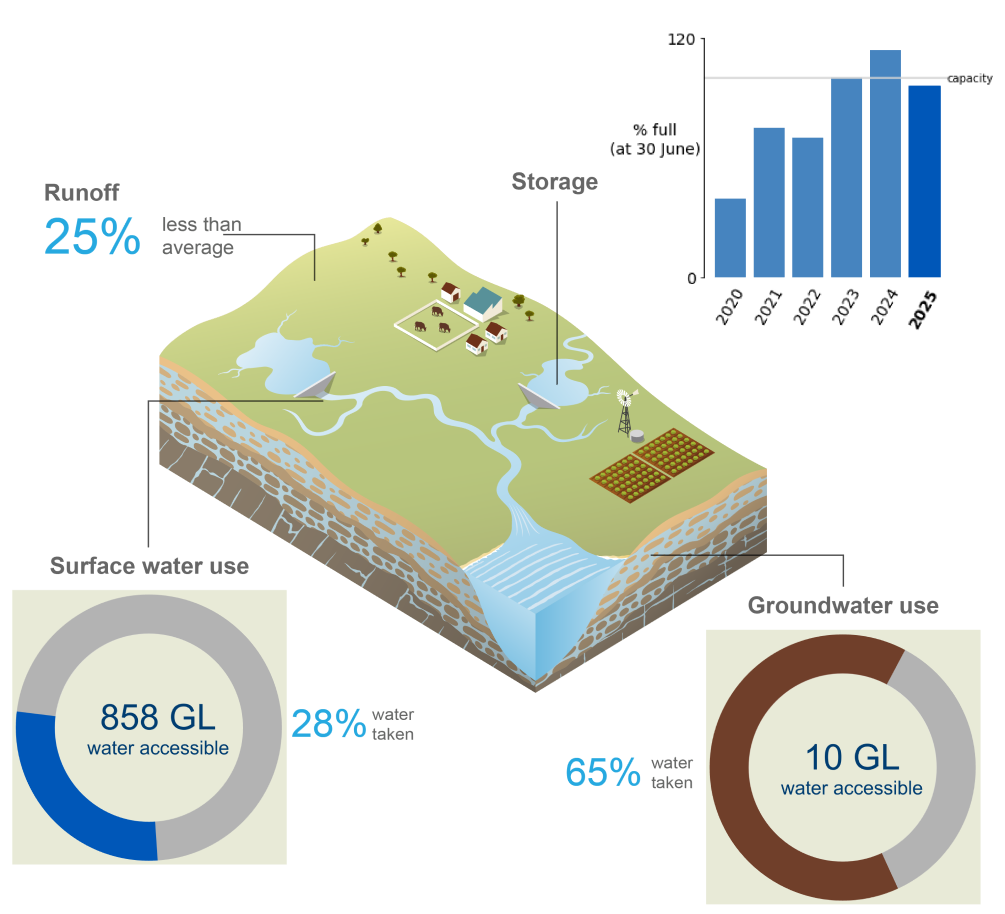
This section provides a detailed breakdown of water assets, liabilities, flows, availability, and use in the Ord region over the past six water accounting periods, outlining where water is stored and how it is used across the region.
For further information, scroll down this page or click on the links below:
Water assets
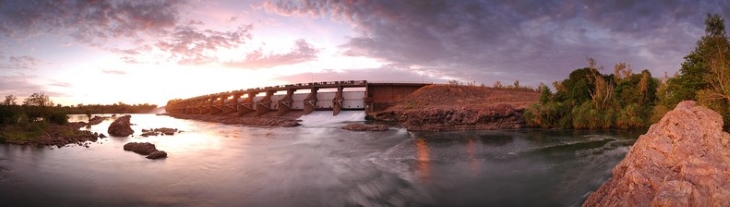
- Total water assets in the Ord region on 30 June 2025 were 10,462 GL, approximately 15% lower than the previous year, entirely due to decreases in surface water assets.
- More than 99% of the region’s water assets were held in surface water storages, while the remaining volume was contained in rivers.
- There are no groundwater assets in the Ord region.
- A detailed breakdown of water assets in the Ord region is available in the Statement of Water Assets and Water Liabilities.
Surface water assets
| Surface water | 2025 | 2024 | 2023 | 2022 | 2021 | 2020 |
| Argyle | 10,113,490 | 12,054,707 | 10,541,889 | 7,278,852 | 7,810,374 | 3,964,721 |
| Kununurra | - | - | - | - | - | - |
| Moochalabra | 1,705 | 1,808 | 1,680 | 1,697 | 1,602 | 1,563 |
| Accessible total | 10,115,195 | 12,056,515 | 10,543,569 | 7,280,549 | 7,811,976 | 3,966,284 |
| Dead storage | 331,667 | 330,984 | 329,885 | 330,061 | 331,436 | 332,413 |
| Total storage | 10,446,862 | 12,387,499 | 10,873,454 | 7,610,610 | 8,143,412 | 4,298,697 |
| Total capacity | 10,862,820 | 10,862,820 | 10,862,820 | 10,862,820 | 10,862,820 | 10,862,820 |
| % full | 96.2% | 114.0% | 100.1% | 70.1% | 75.0% | 39.6% |
- The total storage volume in the Ord region decreased by 16% during 2024–25, finishing at 96.2% full on 30 June 2025.
- This was the first time since 2021–22 that the region’s end-of-year storage volume had finished below 100% full, reflecting the abundance of water stored across the region in recent years.
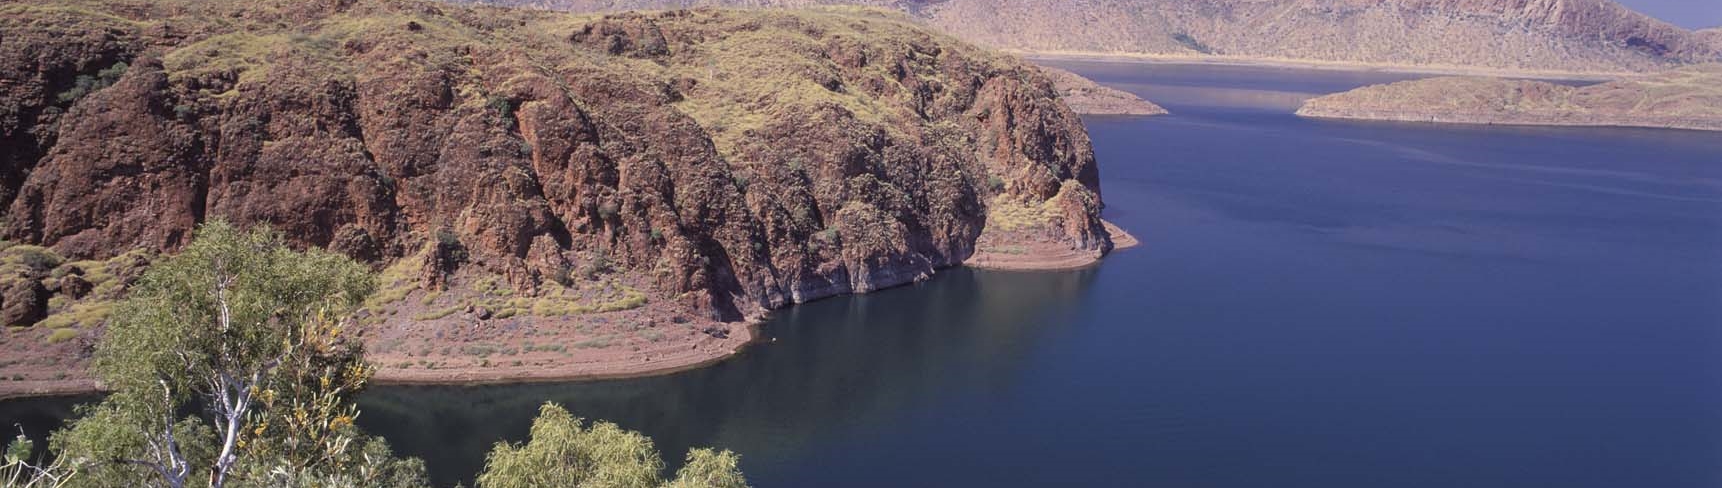
- Lake Argyle, which holds more than 99% of the region’s total surface water storage, is Western Australia’s largest and Australia’s second-largest freshwater man-made reservoir by volume.
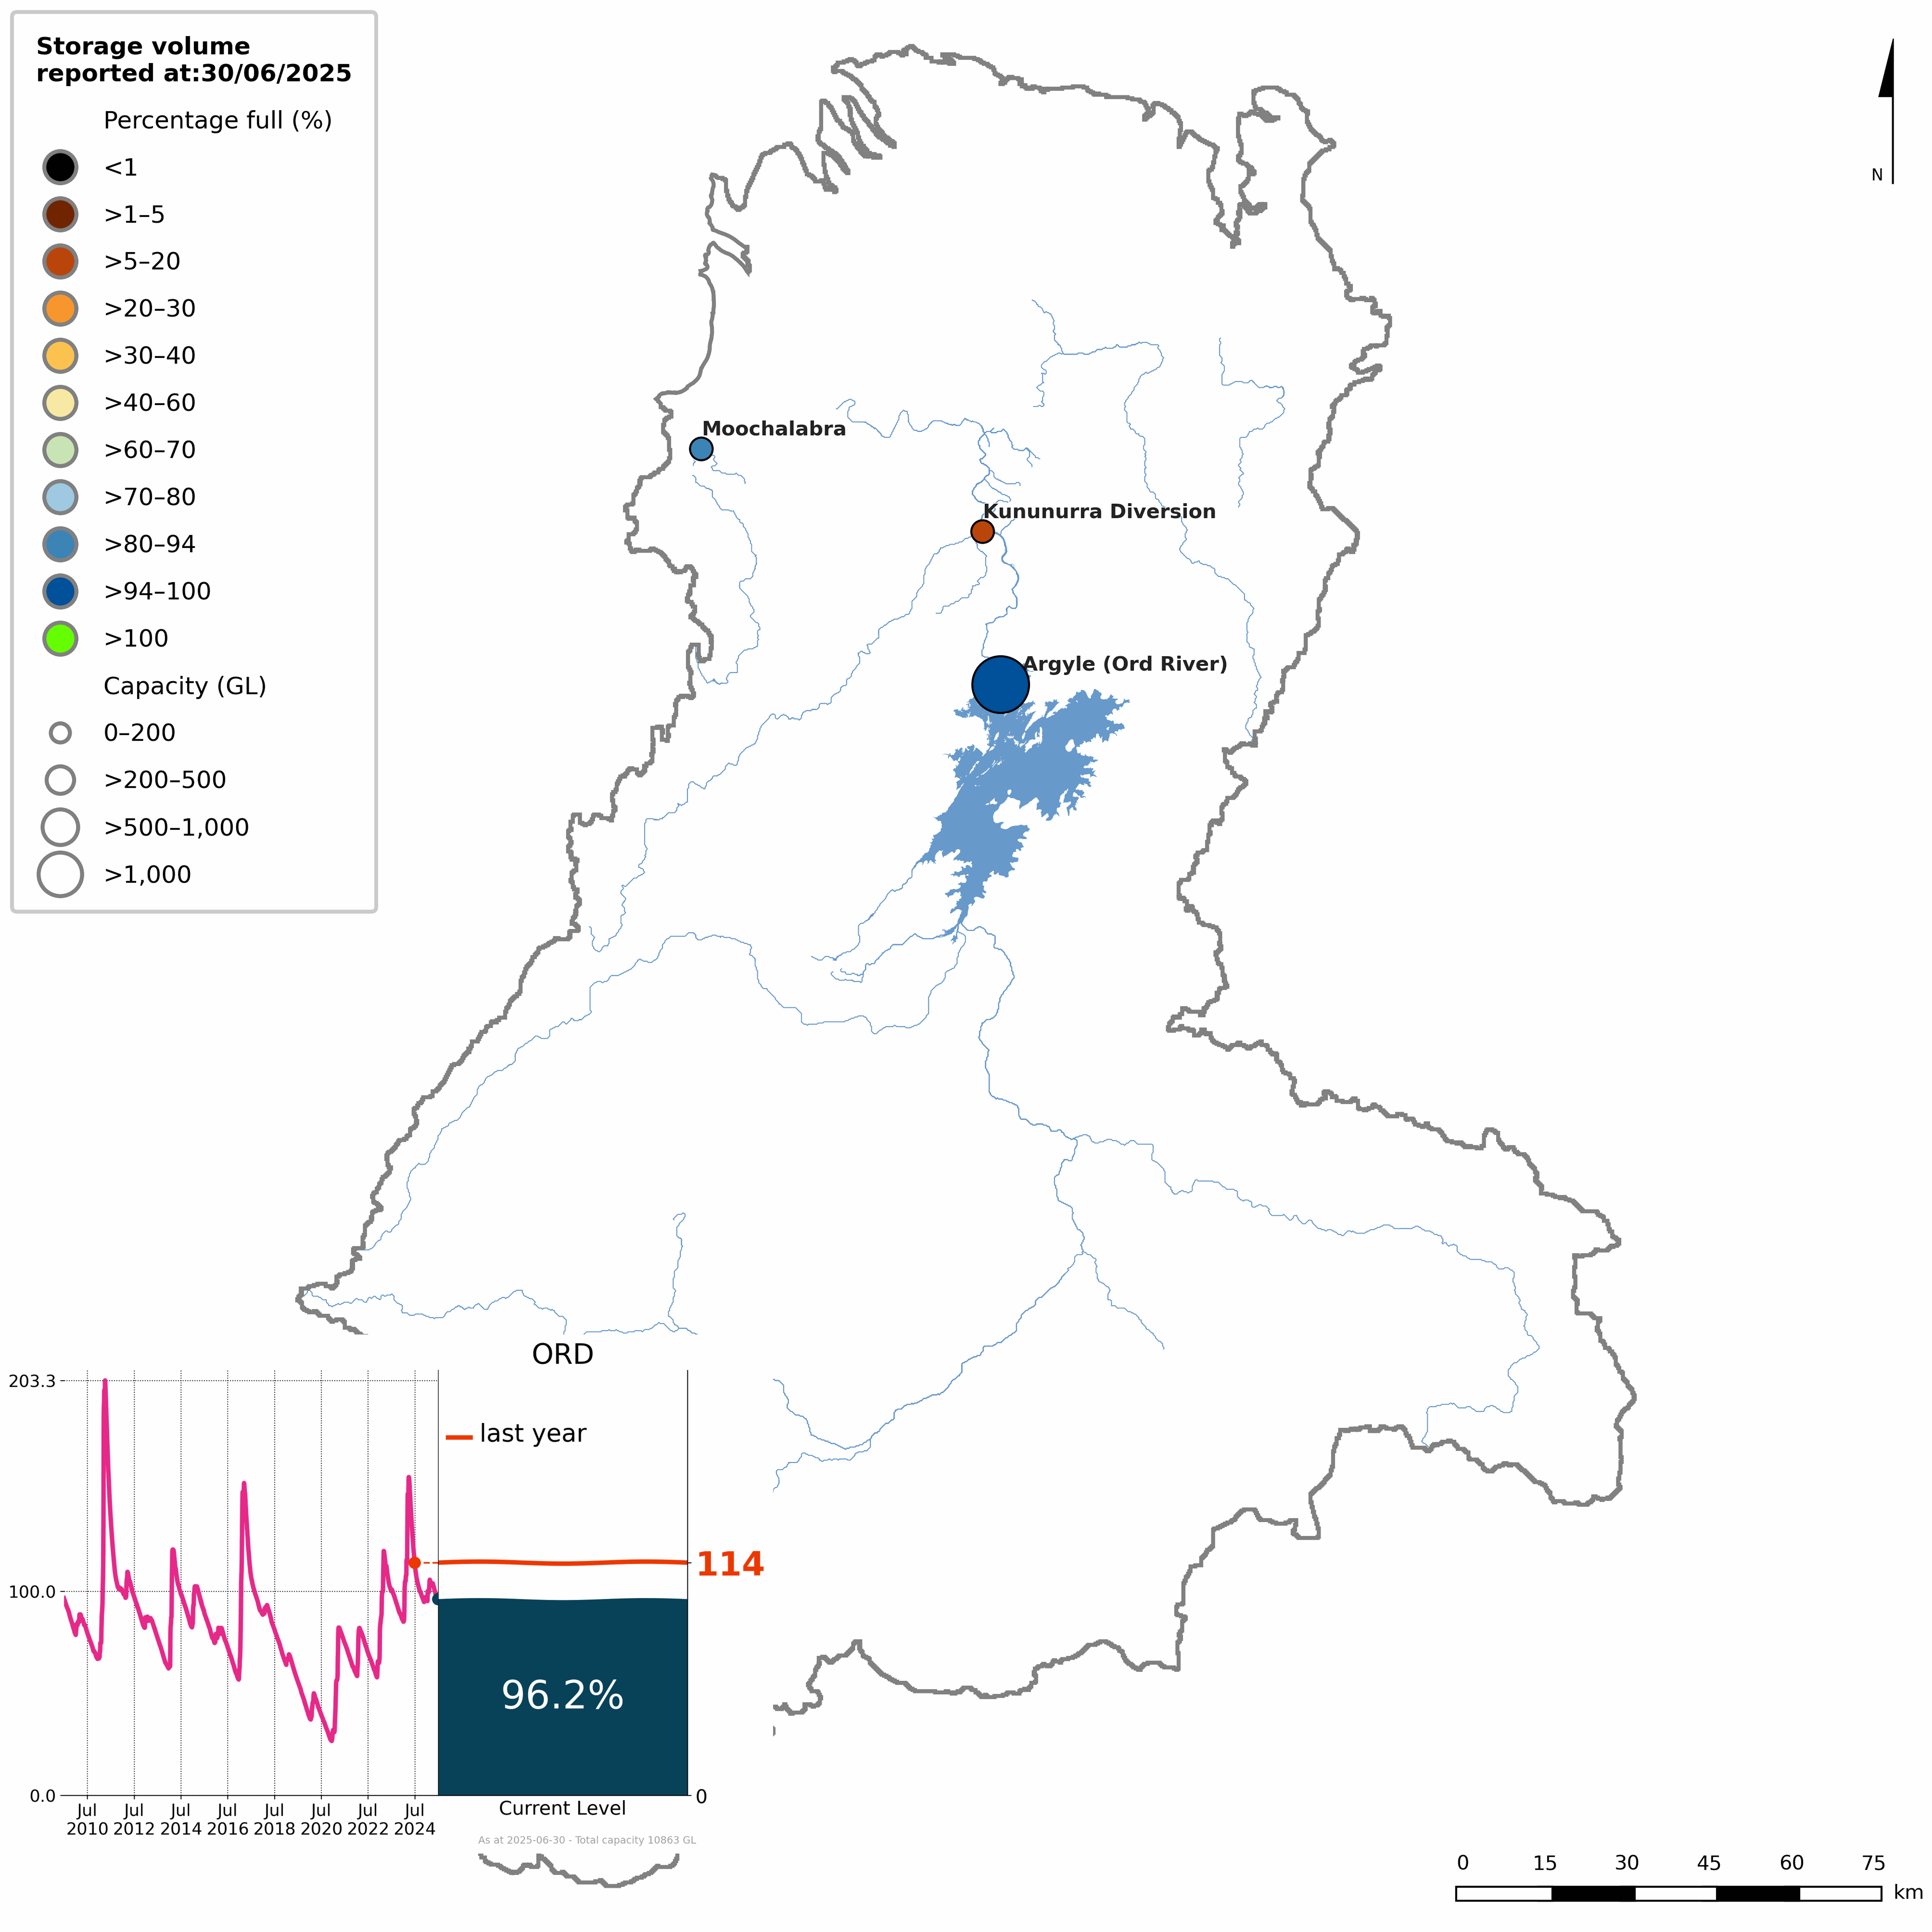
Figure S1 Percentage-full volume on 30 June 2025 for each storage and total storage volume since July 2009 (inset)
- The total storage volume in the Ord region began the 2024–25 year at 114% full, the highest opening storage volume since 2011–12.
- Throughout the dry season and into early spring, storage levels declined steadily due to overspill releases from Lake Argyle, with total storage volume falling below 100% full towards the end of September.
- Despite the region’s wet September, storage levels continued to decline through October and November, falling just below 95% full in the second half of November, likely due to continued releases to manage storage levels ahead of the wet season.
- In response to increased rainfall and inflows during November and early summer, storage levels remained relatively steady through to mid-January, around 95% full.
- Storages rose to 105% full in February; however, with no significant rainfall events during the latter part of the wet season, storage levels gradually declined through autumn, to just above 100% at the conclusion of the wet season.
- After unseasonably widespread heavy rainfall across the region in late May, storage increased briefly before continuing to decline through to the end of the reporting year.
- By 30 June 2025, the total storage volume in the Ord region was 96.2% full, down 16% from the start of the reporting year.
- More detailed information on individual storages in the Ord region is available on the Bureau of Meteorology’s Water Information Dashboard.
Water liabilities
- Water liabilities in the Ord region refer to the volume of allocation remaining on licence entitlements at the end of the reporting period (30 June).
- As most water supply licences in the Ord region do not align with the water year, which ends 30 June, the remaining allocation (carryover) represents the unused portion of the annual allocation for these entitlements.
- A more detailed description of water allocations in the Ord region is provided in the Water use section.
Surface water liabilities
| Description | 2025 | 2024 | 2023 | 2022 | 2021 | 2020 | |
| Opening balance at 01 July | 315,600 | 315,600 | 315,877 | 315,877 | 301,492 | 243,872 | |
| add | Allocations | 542,235 | 542,235 | 542,415 | 495,297 | 448,186 | 450,652 |
| less | Allocated diversions | 240,229 | 235,719 | 264,901 | 248,889 | 271,449 | 308,738 |
| less | Adjustments and forfeitures | 306,516 | 306,516 | 277,791 | 246,408 | 162,352 | 84,294 |
| Closing balance at 30 June | 311,090 | 315,600 | 315,600 | 315,877 | 315,877 | 301,492 | |
- Surface water allocations in the Ord region during 2024–25 were 542 GL, entirely for individual users, with an additional 316 GL carried over from the previous year.
- 240 GL of the total surface water volume accessible for take was diverted during the reporting year, slightly more than the previous year, primarily for agricultural and irrigation use.
- Around 307 GL was forfeited at the end of the reporting year in accordance with licence conditions, while the closing balance of surface water allocations on 30 June 2025 was 311 GL, slightly lower than the previous year.
Groundwater liabilities
| Description | 2025 | 2024 | 2023 | 2022 | 2021 | 2020 | |
| Opening balance at 01 July | 3,400 | 3,400 | 3,407 | 3,407 | 3,407 | 3,407 | |
| add | Allocations | 6,208 | 6,208 | 5,566 | 6,171 | 8,792 | 8,382 |
| less | Allocated extractions | 6,208 | 6,208 | 5,566 | 6,171 | 7,185 | 6,628 |
| less | Adjustments and forfeitures | 0 | 0 | 7 | 0 | 1,607 | 1,754 |
| Closing balance at 30 June | 3,400 | 3,400 | 3,400 | 3,407 | 3,407 | 3,407 | |
- Groundwater allocations in the Ord region during 2024–25 were 6 GL, entirely for individual users, with an additional 3 GL carried over from the previous year.
- All groundwater allocated during the reporting year was extracted, consistent with the previous year, resulting in no change to the volume of water carried over into the next reporting period.
- As no groundwater allocations were forfeited at the end of the reporting year, the closing balance of groundwater allocations on 30 June 2025 remained unchanged at 3 GL.
Water flows
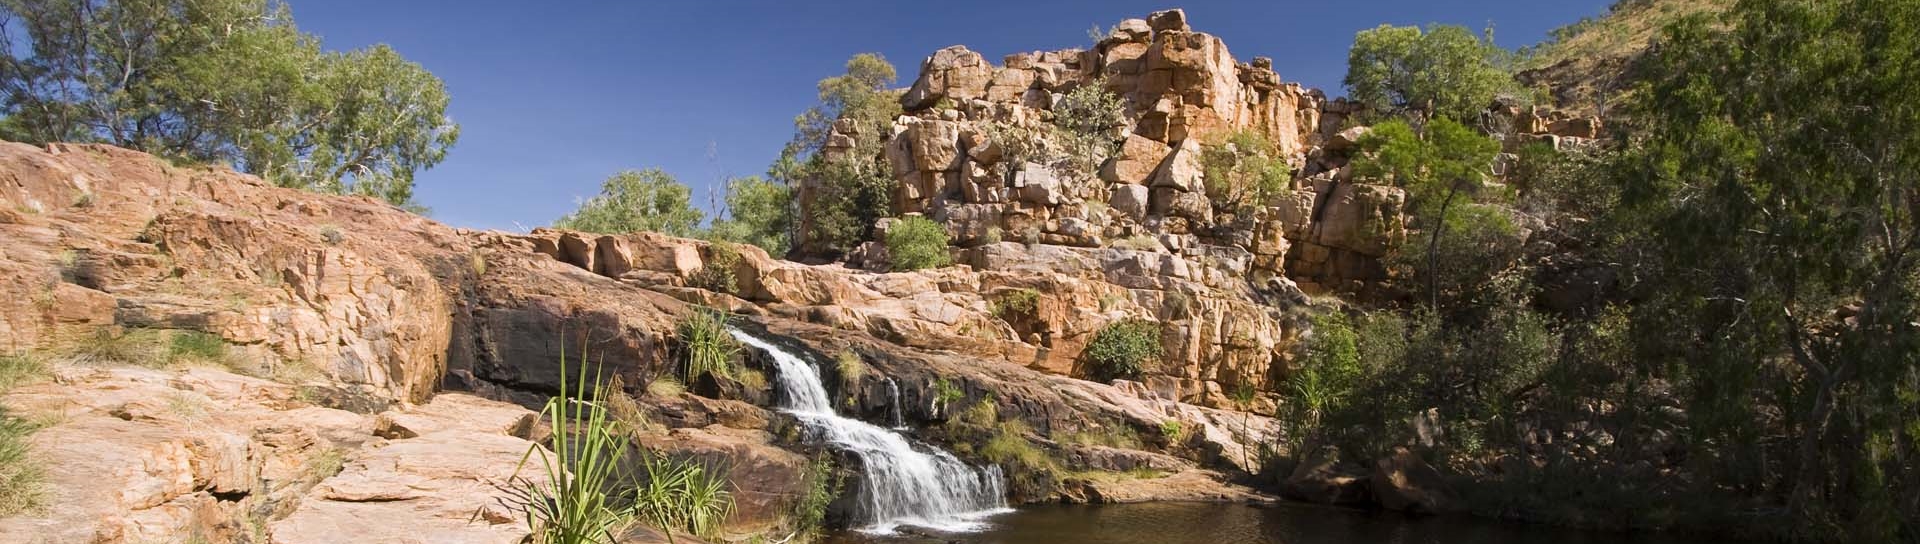
- Water flows in the Ord region describe the movement of water between surface water and groundwater stores.
- A summary of total inflows and outflows for each water store is provided below.
- For a detailed breakdown of inflows and outflows in the Ord region, refer to the Statement of Changes in Water Assets and Water Liabilities.
| Water inflows | 2025 | 2024 | 2023 | 2022 | 2021 | 2020 |
| Surface water inflows | 5,153,616 | 17,628,891 | 9,844,718 | 3,164,745 | 6,911,459 | 2,782,247 |
| Groundwater inflows | 429,621 | 768,922 | 605,239 | 352,342 | 445,529 | 329,380 |
| Total water inflows | 5,583,237 | 18,397,813 | 10,449,957 | 3,517,087 | 7,356,988 | 3,111,627 |
- Total water inflows to the Ord region during 2024–25 were 5,583.2 GL, less than a third of the previous year, primarily due to significantly lower runoff across the region.
- Surface water inflows contributed slightly over 90% (5,154 GL) of total inflows, with runoff accounting for above 80% of all surface water inflows.
- Runoff into the region’s surface water storages was less than a quarter of the previous year, decreasing by less than 75%, and was also 25% below the long-term average of 5,561 GL (based on area-averaged modelled data since July 1971).
- Groundwater inflows made up the remaining 8% of total inflows, entirely from recharge from surface water.
| Water outflows | 2025 | 2024 | 2023 | 2022 | 2021 | 2020 |
| Surface water outflows | 7,437,314 | 16,285,291 | 10,902,818 | 5,788,277 | 6,354,447 | 6,273,586 |
| Groundwater outflows | 6,208 | 6,208 | 5,566 | 6,171 | 7,185 | 6,628 |
| Total water outflows | 7,443,522 | 16,291,499 | 10,908,384 | 5,794,448 | 6,361,632 | 6,280,214 |
- Total water outflows from the Ord region during 2024–25 were 7,444 GL, less than half of the previous year, corresponding to the significant decrease in inflows across the region.
- Surface water outflows accounted for more than 99% of total outflows, largely from outflow to sea and evaporation from storages, which together contributed just under 90% of total water outflows.
- Outflow to sea from the region’s rivers was approximately 65% lower than the previous year, and 25% below the long-term average of 5,557 GL (based on area-averaged modelled data since July 1971), reflecting the reduction in water movement through the region during the reporting period.
- Groundwater outflows made up less than 1% of total outflows, entirely from allocated extractions by individual users.
Water availability
| Surface water | 2025 | 2024 | 2023 | 2022 | 2021 | 2020 |
| Water availability | 17,146,184 | 27,967,850 | 17,022,177 | 10,916,454 | 10,780,635 | 8,471,593 |
| Water accessible | 857,835 | 857,835 | 858,292 | 811,174 | 749,678 | 694,524 |
| Water taken | 240,229 | 235,719 | 264,901 | 248,889 | 271,449 | 308,738 |
| % water accessible taken | 28% | 27% | 31% | 31% | 36% | 44% |
- Surface water availability in the Ord region during 2024–25 was approximately 40% lower than the previous year, but remained 11% above the long-term average of 15,451 GL.
- Changes in water availability across the Ord region are strongly influenced by runoff. Generally, when runoff increases or decreases, water availability responds in a similar way.
- Despite the decrease in water availability, surface water accessible for take remained unchanged from the previous year, likely due to most licences reaching full allocation during the reporting period.
- Water taken from surface water resources in the Ord region were 240 GL, slightly higher than the previous year.
- Overall, approximately 30% of the surface water accessible for take in the Ord region was taken during 2024–25, primarily for allocated diversions to agricultural and irrigation users.
Water use
Consumptive use
- A total of 246 GL of water was taken from surface water and groundwater resources for consumptive use in the Ord region during 2024–25, slightly higher than the previous year, primarily due to increased surface water diversions to irrigation users.
| Surface water | 2025 | 2024 | 2023 | 2022 | 2021 | 2020 |
| Agriculture users | 51,002 | 51,002 | 46,404 | 29,057 | 20,224 | 23,764 |
| Commercial users | 416 | 416 | 416 | 467 | 329 | 394 |
| Industrial users | 13 | 13 | 13 | 13 | 0 | 0 |
| Irrigation users | 186,573 | 182,063 | 215,932 | 214,665 | 247,069 | 280,105 |
| Mining users | 647 | 647 | 601 | 3,036 | 2,220 | 2,868 |
| Park, gardens and recreation | 644 | 644 | 600 | 703 | 634 | 634 |
| Stock and domestic | 234 | 234 | 235 | 248 | 548 | 548 |
| Urban users | 700 | 700 | 700 | 700 | 425 | 425 |
| Total | 240,229 | 235,719 | 264,901 | 248,889 | 271,449 | 308,738 |
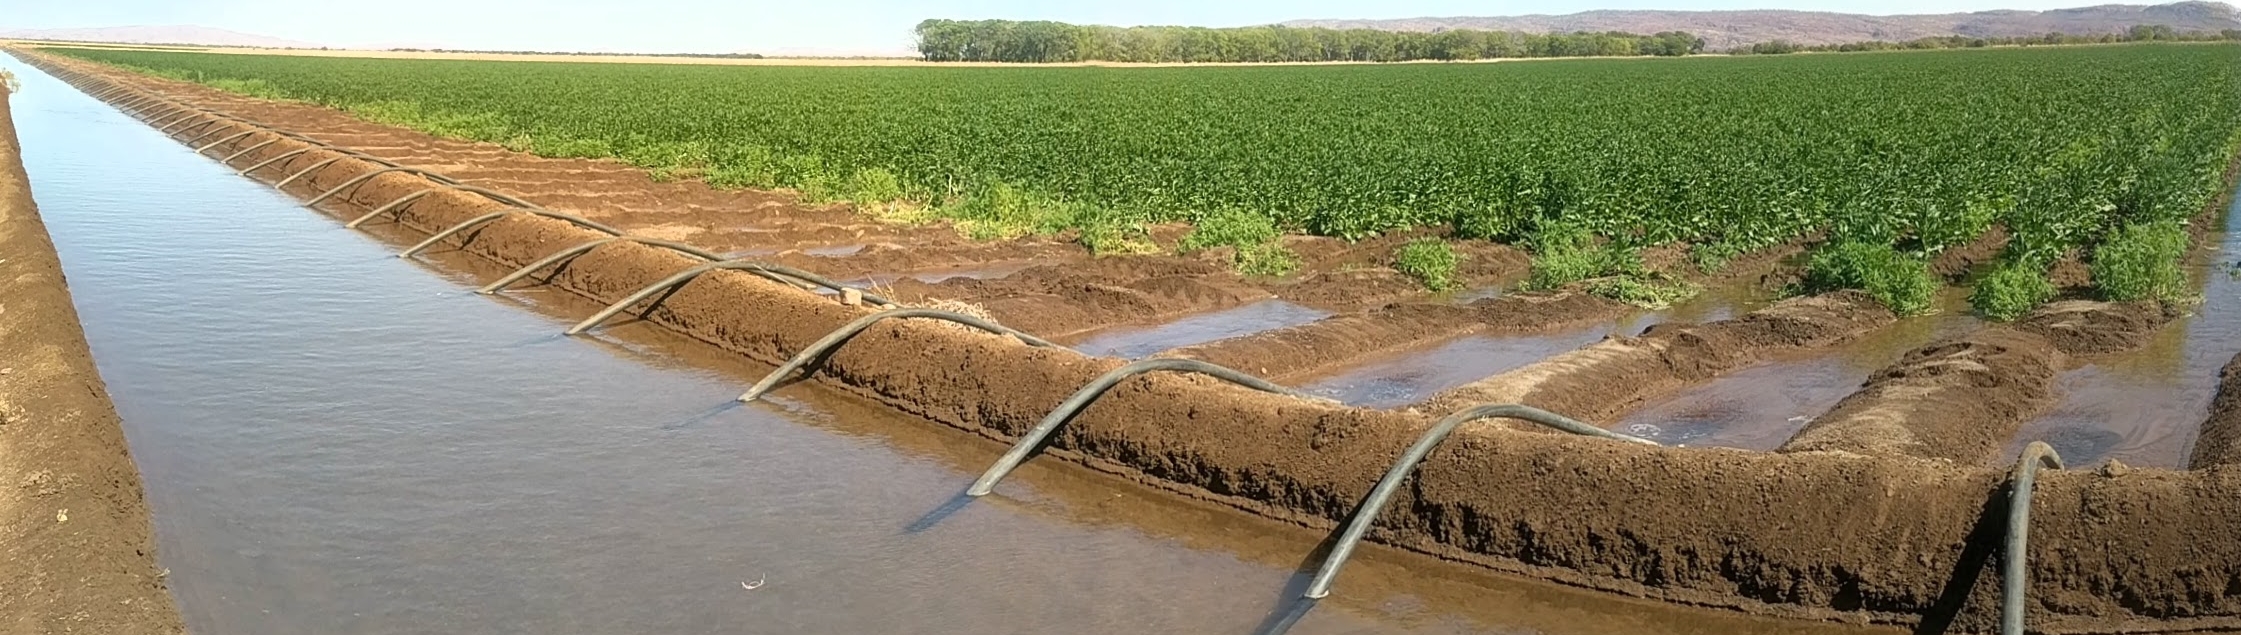
- Surface water diversions across the Ord region during 2024–25 were 240 GL, slightly higher than the previous year, primarily for irrigation users.
- Approximately 80% of surface water diversions in the Ord region were to irrigation users, while agricultural users accounted for a further a little over 20% of diversions.
- Metered water use in the Ord region is only available for the irrigation scheme.
| Groundwater | 2025 | 2024 | 2023 | 2022 | 2021 | 2020 |
| Agriculture users | 260 | 260 | 260 | 248 | 215 | 215 |
| Commercial users | 646 | 646 | 226 | 646 | 597 | 588 |
| Industrial users | 4 | 4 | 4 | 56 | - | - |
| Mining users | 2,411 | 2,411 | 2,209 | 2,289 | 4,386 | 3,828 |
| Parks, gardens and recreation | 75 | 75 | 55 | 60 | 31 | 41 |
| Stock and domestic | 112 | 112 | 112 | 172 | 178 | 178 |
| Urban users | 2,700 | 2,700 | 2,700 | 2,700 | 1,778 | 1,778 |
| Total | 6,208 | 6,208 | 5,566 | 6,171 | 7,185 | 6,628 |
- Groundwater extractions across the Ord region during 2024–25 were 6 GL, unchanged from the previous year, primarily for urban and mining users.
- Allocated extractions to urban users accounted for approximately 45% of total groundwater use, while mining users made up a little under 40% of extractions.
- The remaining volume of groundwater extractions was distributed across a range of smaller user groups, including commercial and agricultural users.
Allocations and diversions
| Surface water | 2025 | 2024 | 2023 | 2022 | 2021 | 2020 |
| Individual users | ||||||
| Carryover | 315,600 | 315,600 | 315,877 | 315,877 | 301,492 | 243,872 |
| Allocated announcements | 542,235 | 542,235 | 542,415 | 495,297 | 448,186 | 450,652 |
| Allocated diversions | 240,229 | 235,719 | 264,901 | 248,889 | 271,449 | 308,738 |
| % used | 28% | 27% | 31% | 31% | 36% | 44% |
- Total surface water allocations in the Ord region during 2024–25 were 542 GL, similar to the previous year, with an additional 316 GL of water carried over from the previous year.
- Approximately 30% (240 GL) of the total surface water volume accessible for take was diverted during the reporting year, primarily for irrigation and agricultural users.
- In recent years, water taken for irrigation scheme supply has been influenced by the expansion of the Goomig Farmlands (see Major water reforms), the development and viability of commercial enterprises, and the timing of major rainfall events.
| Groundwater | 2025 | 2024 | 2023 | 2022 | 2021 | 2020 |
| Individual users | ||||||
| Carryover | 3,400 | 3,400 | 3,407 | 3,407 | 3,407 | 3,407 |
| Allocated announcements | 6,208 | 6,208 | 5,566 | 6,171 | 8,792 | 8,382 |
| Allocated extractions | 6,208 | 6,208 | 5,566 | 6,171 | 7,185 | 6,628 |
| % used | 65% | 65% | 62% | 64% | 59% | 56% |
- Total groundwater allocations in the Ord region during 2024–25 were 6 GL, similar to the previous year, with an additional 3 GL of water carried over from the previous year.
- Approximately 65% (6 GL) of the total groundwater volume accessible for take was extracted during the reporting year, primarily for urban and mining supply.
- Metered water use is not available in the Ord region, so changes in groundwater extractions are associated with changes in water licences issued.