


Murray–Darling Basin: Key findings
For the water account period 1 July 2021–30 June 2022
- Total annual rainfall was above average for the second consecutive year.
- End-of-year storage was 91% full compared to 64% full the previous year.
- Water taken for consumptive water use was 8,669 GL, around 8% more than last year.
Climate and water
Rainfall
634 mm
above the average of 466 mm
Streamflow

above average
for much of the year
Storage

91% full

27% more than last year
Water use
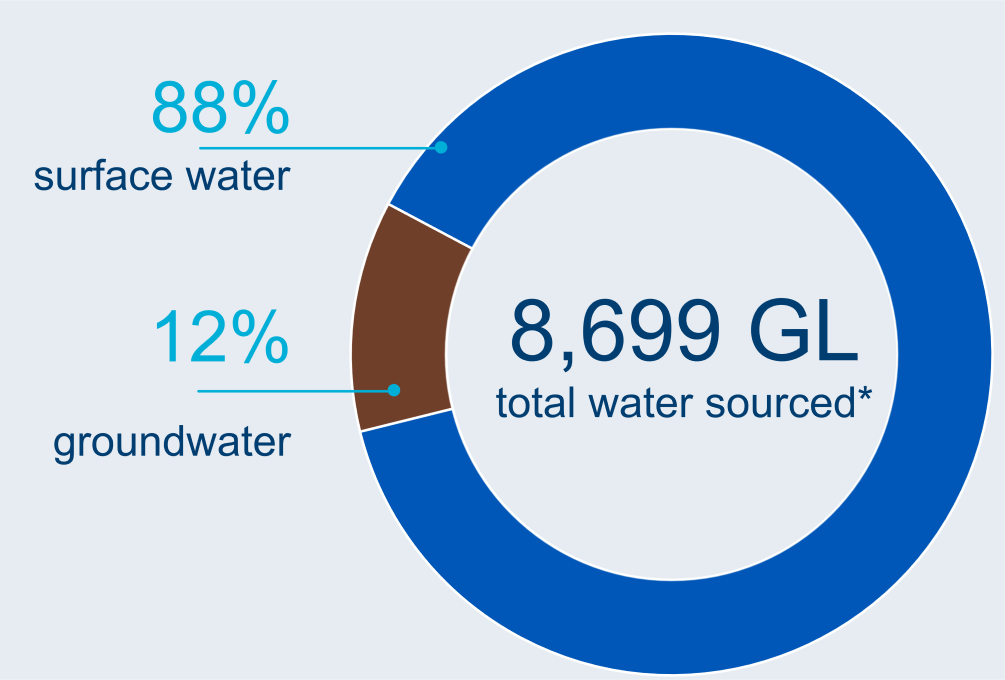
Water sourced
Water taken
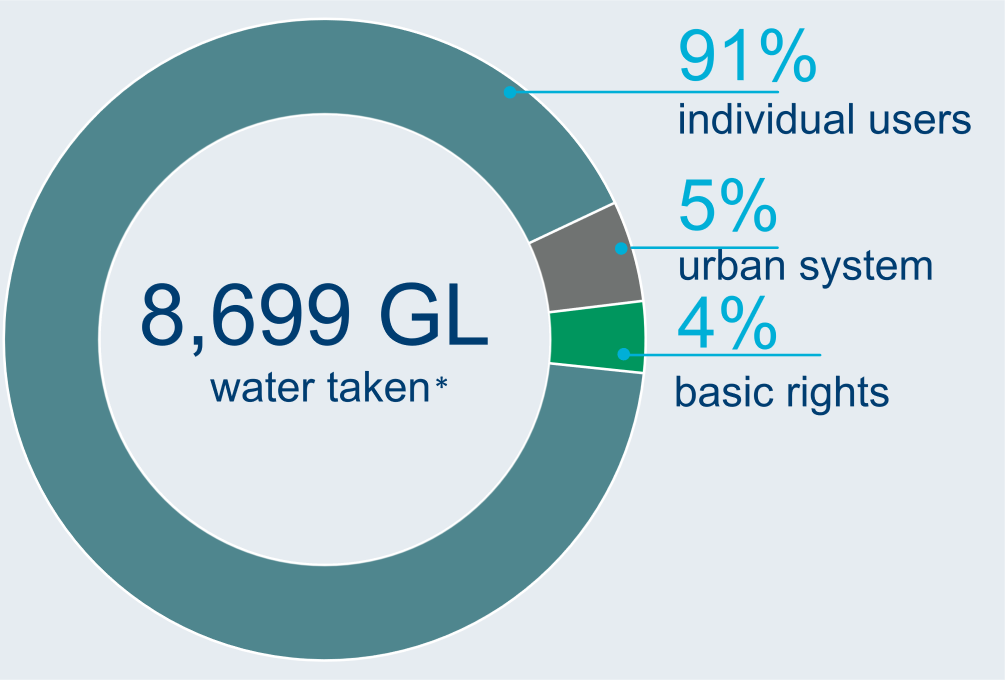
* water taken for consumptive use
Water status
Allocations
14,415 GL
total surface water and groundwater allocations
Water availability
52,700 GL
surface water available in 2021–22
Highest since 2011-12