


Murray–Darling Basin: Supporting information
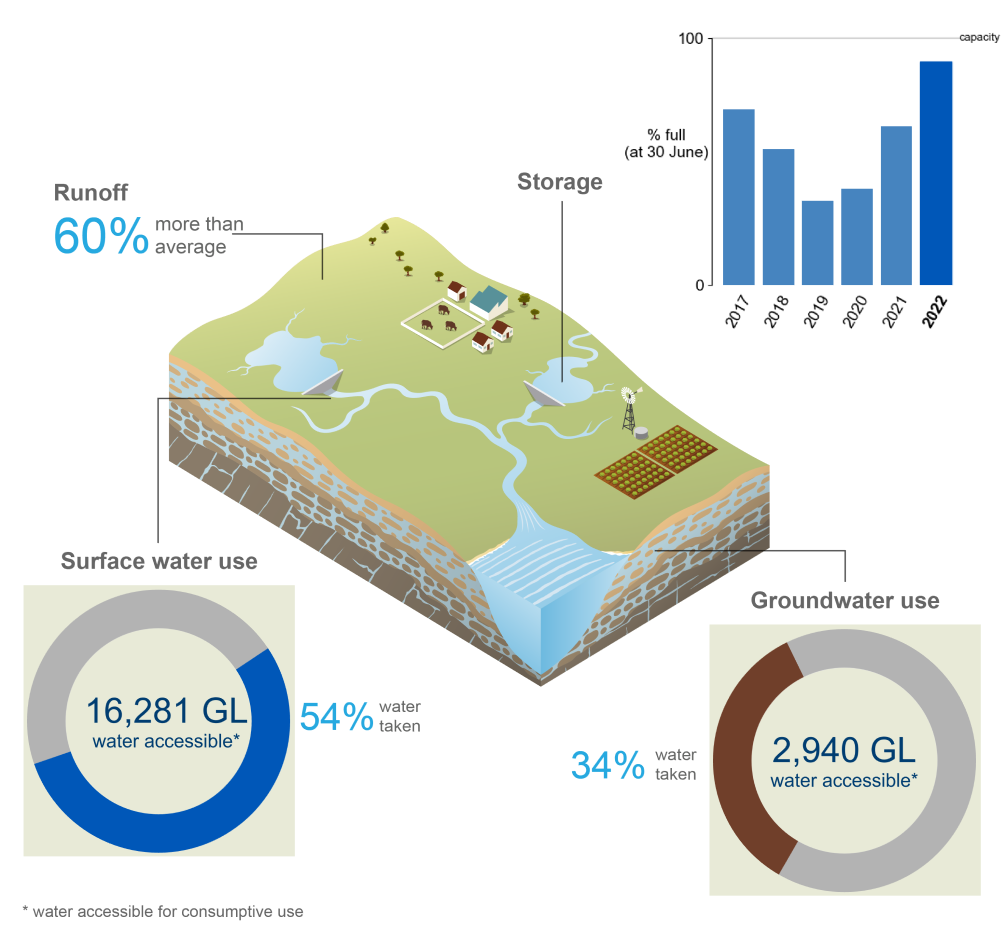
- Wetter conditions in 2021–22 contributed to above average runoff across the region.
- End-of-year storage was 91% full compared to 64% full the previous year.
- 51% of the total water accessible for use was taken for consumptive use, predominantly for irrigation and agricultural purposes.
For further information on the region's water accounting statements scroll down this page or click on the links below:
Water assets
")
- Water asset volumes in the region at 30 June 2022 totalled 29,081 GL. Surface water assets accounted for 88% of this volume.
Storages
| 2022 | 2021 | 2020 | 2019 | 2018 | 2017 | |
| Northern Basin | 4,458,996 | 2,532,584 | 821,148 | 405,581 | 1,494,725 | 3,011,172 |
| Southern Basin | 15,637,058 | 11,397,367 | 7,753,753 | 6,369,829 | 9,811,907 | 12,080,001 |
| Accessible total | 20,096,054 | 13,929,951 | 8,574,901 | 6,775,410 | 11,306,632 | 15,091,173 |
| Dead storage | 578,704 | 578,704 | 578,704 | 578,704 | 578,704 | 578,704 |
| Total storage | 20,674,758 | 14,508,655 | 9,153,605 | 7,354,114 | 11,885,336 | 15,669,877 |
| Total capacity | 22,685,480 | 22,685,480 | 22,685,480 | 22,685,480 | 22,685,480 | 22,685,480 |
| % full | 91.1% | 64.0% | 40.4% | 32.4% | 52.4% | 69.1% |
- Storage volumes increased from 64% full at 30 June 2021 to 91% full at 30 June 2022.
- This was the third consecutive annual increase in storage and the highest volume since 2011–12.
- Most of the storage infrastructure is located in the southern basin with a total capacity of 17,977 GL compared with 4,708 GL in the northern basin.
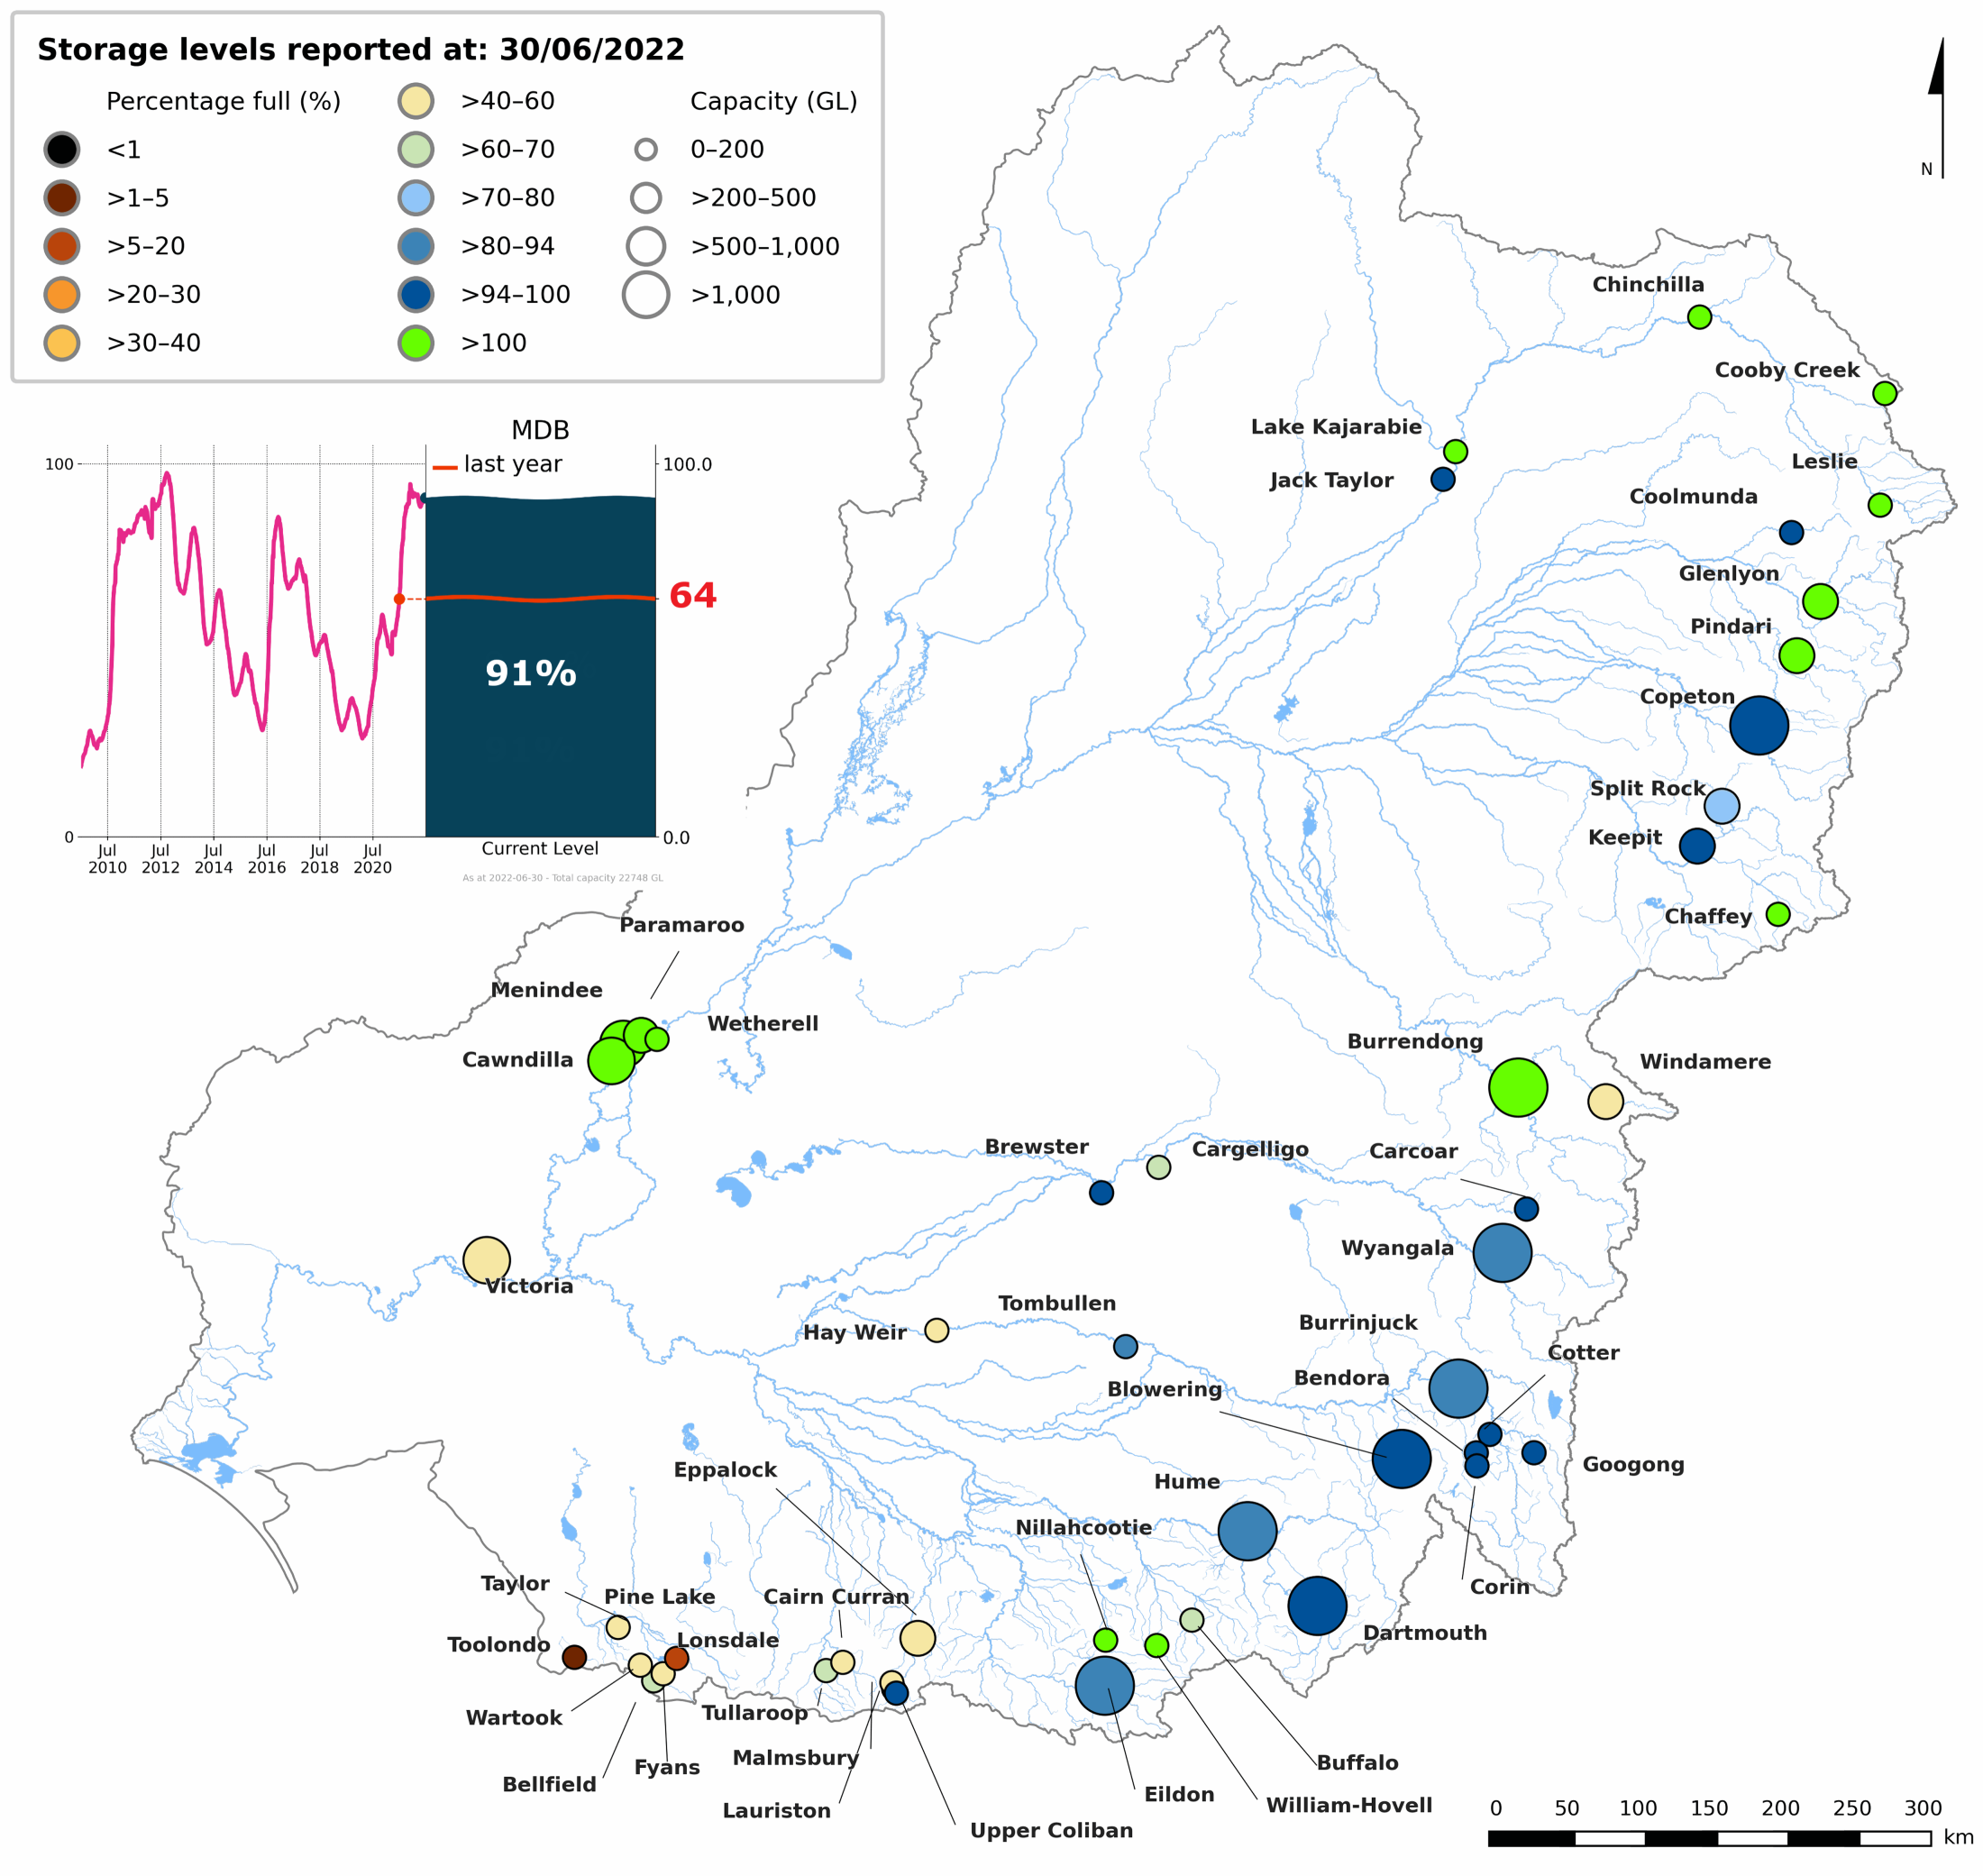
Figure S1 Percentage-full volume on 30 June 2022 for each storage and total storage volume from 2009–2022 (inset)
- Rainfall over winter and spring 2021 continued to fill storages so that many were reasonably full by the start of November, with some actively releasing to make airspace for high inflows.
- Record rainfall over November and subsequent high inflows, particularly in the north and east of the basin, resulted in many storages in New South Wales and the Australian Capital Territory reaching 100% and spilling.
- Total storages volumes increased by close to 25% over the July to December 2021 period.
- Continued rainfall maintained high storage volumes through to the end of the period, with the total storage volume at 30 June 2022 nearly 60% higher than at 30 June 2019.
- See the Bureau's 2021–22 Climate Report for more information.
- More detailed information on the individual storages within the region is available on the Bureau of Meteorology's Water Storage website.
Groundwater assets
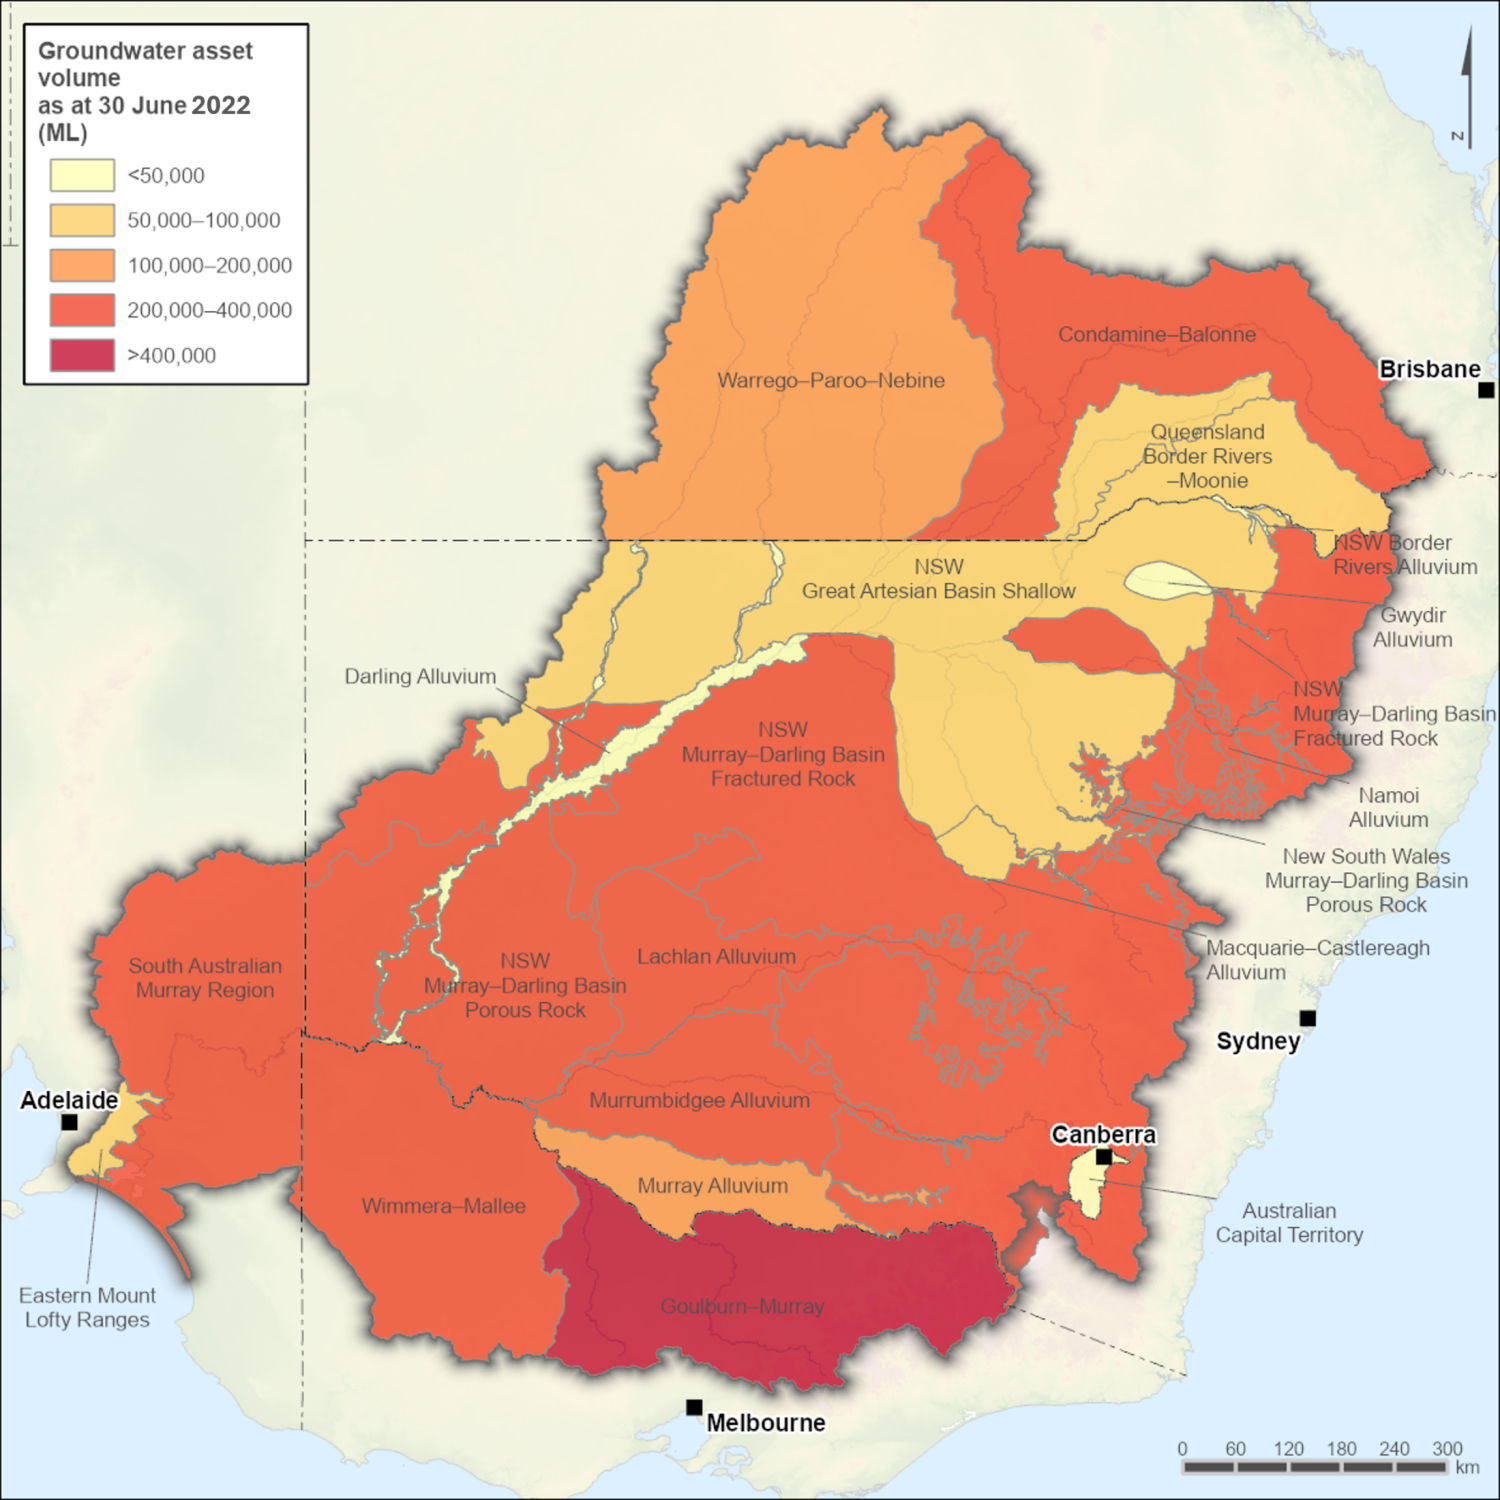
Figure S2 Groundwater sustainable
diversion limits in the Murray–Darling Basin region
- The groundwater asset volume for the region represents sustainable diversion limit volumes as provided by the Murray–Darling Basin Authority.
- The groundwater asset volume at the end of the year was the same as the previous year, reflecting no change to the region's sustainable diversion limits.
Water liabilities
")
- Water liabilities in the Murray–Darling Basin region refer to the volume of allocation remaining on licence entitlements at the end of the 2021–22 year.
| Description | Individual users (ML) | Urban system (ML) | Environmental purposes (ML) | |
| Opening balance at 1 July 2021 | 4,056,724 | 0 | 1,038,590 | |
| add | Allocation | 8,376,200 | 594,016 | 3,231,150 |
| add | Trade | 53,119 | (222) | 562,598 |
| less | Allocated diversion | 5,193,390 | 410,219 | 2,882,163 |
| less | Adjustment and forfeiture | 1,994,255 | 183,575 | 439,553 |
| Closing balance at 30 June 2022 | 5,298,398 | 0 | 1,510,622 | |
| Description | Individual users (ML) | Urban system (ML) | Salinity and water table management (ML) | Environmental purposes (ML) | |
| Opening balance at 1 July 2021 | 594,137 | 0 | 0 | 0 | |
| add | Allocation | 2,046,498 | 79,659 | 39,031 | 48,680 |
| add | Trade | 30 | 0 | 0 | 0 |
| less | Allocated Extraction | 763,587 | 29,890 | 17,344 | 40,224 |
| less | Adjustment and forfeiture | 1,270,561 | 49,769 | 21,687 | 8,456 |
| Closing balance at 30 June 2022 | 606,517 | 0 | 0 | 0 | |
- Water supply licences for individual users and environmental purposes have carryover provisions, which means a portion of water allocation that has not been abstracted at the end of the water year can be carried over into the next water year.
- There are no carryover provisions for urban system supply, and salinity and water table management licences. The portion of water allocation that has not been abstracted at the end of a water year is forfeited and the allocation remaining at the end of the year is 0 ML.
- Following two years of above average rainfall contributing to high water availablity, announced allocations were high in 2021–22 (see The Australian Water Markets Report 2021–22 for more information).
- Total surface water allocation for individual, urban and environmental purposes in 2021–22 was 12,201 GL, with individual users, mostly irrigated agriculture, making up 69% of this volume.
- Both surface water and groundwater liabilities closed higher in 2021–22 than in 2020–21.
Water flows
")
- Water inflows to the region were predominantly surface water flows, with groundwater flows contributing 2% of the total.
- Surface water flows into the region's storages totalled 42,103 GL, runoff making up 87% of this volume.
- With runoff close to 60% more than the 1971-2021 average, total water inflows were the highest since 2011-12.
- 98% of the total water outflows (56,806 GL) from the region were surface water outflows, of which 15% was consumptive use.
- Groundwater outflows were lower than in previous years due to reduced consumptive use which makes up about 85% of this volume.
Water availability
| 2022 | 2021 | 2020 | 2019 | 2018 | 2017 | |
| Water availability | 52,699,605 | 33,111,249 | 22,471,866 | 20,953,486 | 29,323,996 | 42,705,559 |
| Water accessible | 16,280,632 | 11,505,219 | 6,804,014 | 7,040,089 | 9,987,784 | 11,849,466 |
| Water taken | 8,804,404 | 8,147,700 | 5,283,333 | 5,850,685 | 7,903,574 | 8,212,611 |
- Physical surface water availability is calculated as the sum of accessible storage at the start of the year (see Water assets) and estimated inflows into storages and rivers during the year.
- Accessible water is the volume of water that is lawfully accessible for consumptive use. It is based on the volume of carryover of water entitlements from the previous year in addition to other statutory rights to take water.
- Water taken in this table is for consumptive use and includes floodplain harvesting.
- Water accessible for use and actual water taken are both influenced by the physical water availability.
- On average, runoff contributes almost 90% of the total inflows into the region during the year.
- Higher storage volumes at the beginning of the year and above average runoff contributed to very high total water availability for 2021-22 compared with previous years.
- Accessible water was high, particularly compared to 2019–20, due to higher announced allocations and higher carryover as a result of improved water availability in 2020–21.
- Although the 8,804 GL taken for consumptive use was slightly higher than in 2020–21, the proportion of the accessible water taken (54%) was significantly lower than in previous years reflecting high water availability.
Water use
")
- Total consumptive use for individual users, urban systems and basic rights was 8,696 GL in 2021–22 which was 88% surface water and 12% groundwater use.
| Surface water | 2022 | 2021 | 2020 | 2019 | 2018 |
| Queensland | |||||
| Individual users | 1,000,612 | 528,620 | 588,255 | 217,497 | 268,408 |
| Urban system | 4863 | 5451 | 0 | 0 | 0 |
| Environmental purposes | 366,365 | 73,911 | 192,719 | 16,141 | 18,137 |
| Basic rights | 10,589 | 10,589 | 10,589 | 10,589 | 609 |
| Total | 1,382,429 | 618,571 | 791,563 | 244,227 | 287,154 |
| New South Wales | |||||
| Individual users | 3,921,287 | 3,592,604 | 1,634,963 | 2,502,368 | 4,418,669 |
| Urban system | 76,826 | 78,737 | 87,581 | 101,158 | 98,555 |
| Environmental purposes | 1,124,134 | 917,344 | 158,554 | 304,777 | 648,451 |
| Basic rights | 49,279 | 49,279 | 49,252 | 50,252 | 50,252 |
| Total | 5,171,526 | 4,637,964 | 1,930,350 | 2,958,555 | 5,215,927 |
| Victoria | |||||
| Individual users | 1,798,154 | 1,644,843 | 1,492,761 | 2,021,886 | 2,266,602 |
| Urban system | 134,259 | 149,429 | 136,982 | 134,005 | 124,983 |
| Environmental purposes | 884,678 | 608,528 | 818,054 | 457,022 | 795,461 |
| Basic rights | 27465 | 0 | 0 | 0 | 0 |
| Total | 2,844,556 | 2,402,800 | 2,447,798 | 2,612,913 | 3,187,046 |
| South Australia | |||||
| Individual users | 458,754 | 461,274 | 432,142 | 458,688 | 443,197 |
| Urban system | 148,935 | 172,485 | 156,076 | 199,318 | 109,481 |
| Environmental purposes | 873,351 | 809,102 | 998,506 | 772,770 | 961,686 |
| Basic rights | 6062 | 0 | 0 | 0 | 0 |
| Total | 1,487,102 | 1,442,861 | 1,586,724 | 1,430,776 | 1,514,364 |
| Australian Capital Territory | |||||
| Individual users | 740 | 1,301 | 945 | 2,626 | 2,805 |
| Urban system | 45,336 | 49,268 | 55,330 | 53,422 | 52,162 |
| Environmental purposes | 0 | 0 | 0 | 0 | 0 |
| Basic rights | 0 | 0 | 0 | 0 | 0 |
| Total | 46,076 | 50,569 | 56,275 | 56,048 | 54,967 |
| Basin Total | |||||
| Individual users | 7,179,547 | 6,228,642 | 4,149,066 | 5,203,065 | 7,399,681 |
| Urban system | 410,219 | 455,370 | 435,969 | 487,903 | 385,181 |
| Environmental purposes | 3,248,528 | 2,408,885 | 2,167,833 | 1,550,710 | 2,423,735 |
| Basic rights | 93,395 | 59,868 | 59,841 | 60,841 | 50,861 |
| Total | 10,931,689 | 9,152,765 | 6,812,710 | 7,302,519 | 10,259,458 |
- Total net surface water taken in the region was 10,932 GL. This is the volume of surface water diverted after return flows to rivers and storages are deducted.
- 66% of the diversions were for individual users, 4% were supplied to the urban system, and 1% was for individual users under a basic right.
- 30% of the diversions were for environmental purposes, mainly from the SA River Murray Water Resource Plan Area.
- In the Queensland basin catchments, water use is less regulated and therefore dependent on instream water availability. The increase in surface water take by individual users reflects high flows in the region in 2021–22.
- With higher water availability and consequently lower water prices facilitating trading, environmental water use was high in 2021–22.
| Groundwater | 2022 | 2021 | 2020 | 2019 | 2018 |
| Queensland | |||||
| Individual users | 70,297 | 85,227 | 125,357 | 152,286 | 161,653 |
| Urban system | 1,960 | 9,476 | 12,192 | 13,256 | 5,570 |
| Salinity and water table management | 0 | 0 | 0 | 0 | 0 |
| Basic rights | 3,580 | 3,580 | 24,446 | 24,446 | 33,642 |
| Total | 75,837 | 98,283 | 161,995 | 189,988 | 200,865 |
| New South Wales | |||||
| Individual users | 526,231 | 776,581 | 1,000,459 | 1,129,562 | 966,412 |
| Urban system | 27,930 | 10,346 | 20,159 | 36,519 | 40,029 |
| Salinity and water table management | 4,121 | 1,128 | 1,339 | 7,198 | 0 |
| Basic rights | 191,745 | 191,755 | 177,590 | 176,291 | 187,412 |
| Total | 750,027 | 979,810 | 1,199,547 | 1,349,570 | 1,193,853 |
| Victoria | |||||
| Individual users | 121,100 | 196,346 | 242,370 | 252,098 | 174,248 |
| Urban system | 0 | 0 | 0 | 0 | 0 |
| Salinity and water table management | 0 | 0 | 0 | 0 | 0 |
| Basic rights | 20,280 | 20,280 | 20,289 | 20,235 | 20,235 |
| Total | 141,380 | 216,626 | 262,659 | 272,333 | 194,483 |
| South Australia | |||||
| Individual users | 45,643 | 46,579 | 46,739 | 51,331 | 44,805 |
| Urban system | 0 | 0 | 0 | 0 | 0 |
| Salinity and water table management | 13,223 | 12,375 | 12,709 | 12,340 | 10,152 |
| Basic rights | 3,924 | 3,924 | 3,924 | 3,924 | 7,152 |
| Total | 62,790 | 62,878 | 63,372 | 67,595 | 62,109 |
| Australian Capital Territory | |||||
| Individual users | 316 | 0 | 339 | 1,081 | 948 |
| Urban system | 0 | 0 | 0 | 0 | 0 |
| Salinity and water table management | 0 | 0 | 0 | 0 | 0 |
| Basic rights | 0 | 0 | 0 | 0 | 0 |
| Total | 316 | 0 | 339 | 1,081 | 948 |
| Basin Total | |||||
| Individual users | 763,587 | 1,104,734 | 1,415,264 | 1,586,358 | 1,348,066 |
| Urban system | 29,890 | 19,822 | 32,351 | 49,775 | 45,599 |
| Salinity and water table management | 17,344 | 13,503 | 14,048 | 19,538 | 10,152 |
| Basic rights | 219,529 | 219,539 | 226,249 | 224,896 | 248,441 |
| Total | 1,030,350 | 1,357,597 | 1,687,912 | 1,880,567 | 1,652,258 |
- Total groundwater taken in the region was 1,030 GL.
- 74% of the extraction was for individual users and 21% was for individual users under a basic right.
- Around 3% of the extraction was for the urban system while 2% was extracted for salinity and water table management.
- With higher surface water availability, there was a reduced dependency on groundwater during 2021–22.
- No groundwater extractions were made for environmental purposes during the year.