


Murray–Darling Basin: Statement of Changes in Water Assets and Water Liabilities
for the year ended 30 June 2022
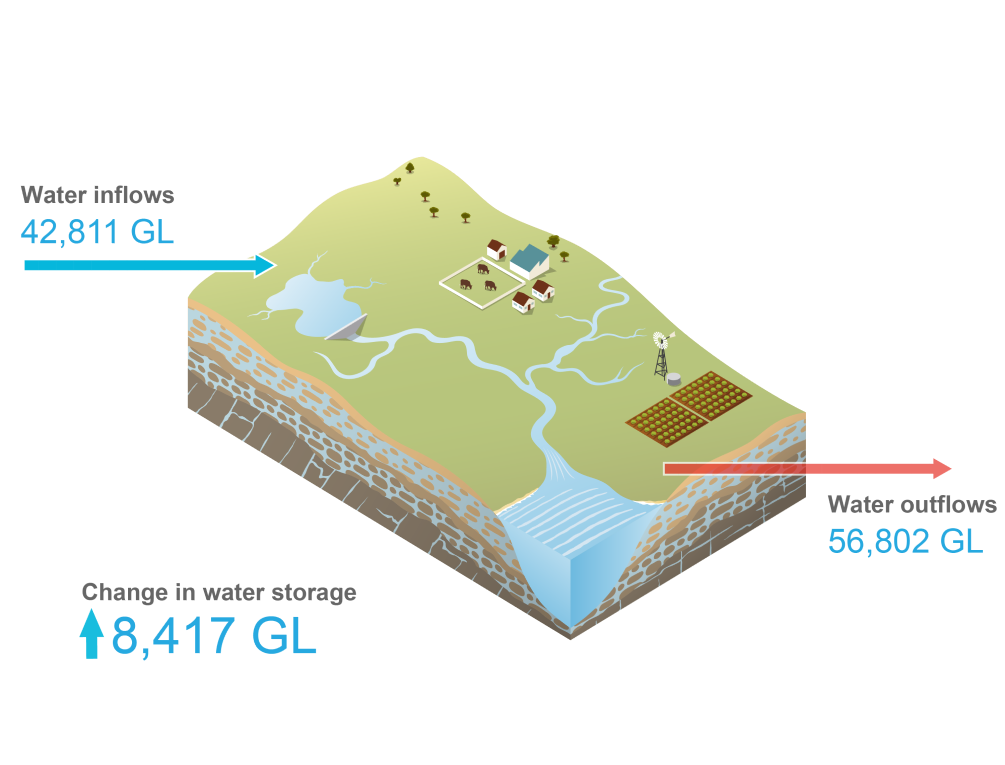
- The volume of water in the region's storages increased during 2021–22 for the second consecutive year.
- This increase primarily represents the change in water volume in the region's surface water storages.
The Statement of Changes in Water Assets and Water Liabilities is provided in the table below. The statement presents the actual water flows associated with the region's water stores, as well as the changes in water assets and water liabilities that occurred during the year.
Select comparative year
| 2022 ML | 2021 ML | 2020 ML | 2019 ML | 2018 ML | 2017 ML | ||
|---|---|---|---|---|---|---|---|
| Water inflows | |||||||
| Surface water inflows | 42,102,637 | 25,717,359 | 16,982,607 | 10,840,948 | 15,308,700 | 38,250,903 | |
| Precipitation on storages | 1,552,323 | 1,052,265 | 780,771 | 726,271 | 933,216 | 1,391,651 | |
| Precipitation on rivers | 767,070 | 439,507 | 295,785 | 208,577 | 261,276 | 632,586 | |
| Runoff | 36,450,261 | 23,044,576 | 14,619,900 | 8,712,006 | 13,038,331 | 32,451,789 | |
| Flood return | 2,377,616 | 839,184 | 724,702 | 657,193 | 694,912 | 2,007,980 | |
| Point return: irrigation | 115,066 | 227,395 | 256,711 | 281,947 | 256,336 | 277,177 | |
| Discharge: groundwater* | 51,821 | 51,821 | 111,255 | 38,854 | 48,780 | 1,341,852 | |
| Discharge: wastewater | 39,309 | 40,638 | 34,299 | 34,213 | 33,581 | 36,458 | |
| Discharge: urban supply system | 1,412 | 2,092 | 2,484 | 2,349 | 2,353 | 1,656 | |
| Return flow: environmental purposes | 747,759 | 19,881 | 156,700 | 179,538 | 39,915 | 109,754 | |
| Groundwater inflows | 708,331 | 707,652 | 491,313 | 379,180 | 923,442 | 2,293,665 | |
| Inter-region inflow | 3,035 | 2,568 | 2,632 | 2,321 | 2,804 | 2,461 | |
| Inter-region coastal inflow | 14 | 67 | 67 | 369 | 251 | 101 | |
| Recharge: landscape | 701,441 | 701,441 | 443,977 | 372,533 | 494,812 | 680,003 | |
| Recharge: surface water* | 0 | 0 | 40,790 | 0 | 234,242 | 1,605,429 | |
| Leakage: urban system | 2,811 | 2,755 | 3,302 | 2,938 | 4,476 | 4,079 | |
| Managed aquifer recharge: individual user | 1,030 | 821 | 545 | (41) | 469 | 1,592 | |
| Other increases | 0 | 0 | 0 | 1,060 | 186,388 | 0 | |
| Total water inflows | 42,810,968 | 26,425,011 | 17,473,920 | 11,220,128 | 16,232,142 | 40,544,568 | |
| Water outflows | |||||||
| Surface water outflows | 55,610,150 | 26,594,059 | 20,543,700 | 20,190,058 | 24,582,875 | 42,898,197 | |
| Evaporation on storages | 3,208,801 | 2,413,062 | 2,072,372 | 2,327,861 | 2,757,556 | 3,106,445 | |
| Evaporation on rivers | 1,702,074 | 828,098 | 635,628 | 698,332 | 786,286 | 1,353,897 | |
| Outflow | 4,229,059 | 968,867 | 678,205 | 657,638 | 889,599 | 3,100,695 | |
| Recharge: groundwater* | 25,398,569 | 9,776,698 | 8,023,232 | 7,632,441 | 8,282,832 | 18,243,724 | |
| Overbank flow | 9,097,185 | 1,953,860 | 1,536,828 | 1,085,533 | 1,174,348 | 6,547,562 | |
| River and floodplain losses | – | – | – | – | – | – | |
| Diversions: basic rights | 93,395 | 59,868 | 59,841 | 60,841 | 50,861 | 50,861 | |
| Floodplain harvesting | 752,100 | 1,205,796 | 436,025 | 83,374 | 48,505 | 288,508 | |
| Non-allocated diversion: individual users | 1,986,157 | 1,439,697 | 1,106,697 | 392,936 | 520,974 | 1,675,241 | |
| Non-allocated diversion: urban system | 2,778 | 2,392 | 9,712 | 6,761 | 7,009 | 11,661 | |
| Allocated diversion: individual users | 5,193,390 | 4,788,945 | 3,042,369 | 4,810,129 | 6,878,707 | 5,724,118 | |
| Allocated diversion: urban system | 410,219 | 455,370 | 435,969 | 487,903 | 385,181 | 308,004 | |
| Allocated diversion: environmental purposes | 2,882,163 | 2,213,253 | 1,975,114 | 1,541,969 | 2,411,398 | 2,042,391 | |
| Non-allocated diversion: environmental purposes | 366,365 | 195,632 | 192,719 | 8,741 | 12,337 | 154,218 | |
| Conveyance losses for allocated diversions | 288,246 | 292,521 | 338,988 | 395,599 | 377,282 | 290,872 | |
| Groundwater outflows | 1,191,097 | 1,517,927 | 1,911,051 | 2,096,058 | 1,872,430 | 2,617,753 | |
| Inter-region outflow | 34 | 57 | 41 | 198 | 112 | 33 | |
| Inter-region coastal outflow | 2,091 | 1,651 | 1,566 | 1,308 | 1,565 | 1,493 | |
| Discharge: landscape | 66,577 | 66,577 | 110,277 | 164,093 | 158,115 | 63,999 | |
| Discharge: surface water* | 51,821 | 51,821 | 111,255 | 38,854 | 56,130 | 1,352,385 | |
| Extraction: basic rights | 219,529 | 219,539 | 226,249 | 224,896 | 248,441 | 239,101 | |
| Non-allocated extraction | 0 | 0 | 0 | 0 | 0 | 0 | |
| Allocated extraction: individual users | 763,587 | 1,104,734 | 1,415,264 | 1,586,358 | 1,348,066 | 910,850 | |
| Allocated extraction: urban system | 29,890 | 19,822 | 32,351 | 49,775 | 45,599 | 38,914 | |
| Allocated extraction: salinity and water table management | 17,344 | 13,503 | 14,048 | 19,538 | 10,152 | 10,978 | |
| Allocated extraction: environmental purposes | 40,224 | 40,224 | 0 | 0 | 0 | 0 | |
| Other decreases | 0 | 0 | 0 | 11,038 | 4,250 | 0 | |
| Total water outflows | 56,801,598 | 28,111,986 | 22,454,751 | 22,286,116 | 26,455,305 | 45,515,950 | |
| Unaccounted-for difference | (22,407,244) | (7,470,918) | (6,928,325) | (6,555,032) | (6,491,618) | (11,129,791) | |
| Change in water storage | |||||||
| Change in surface water storage | 8,416,614 | 5,783,943 | 1,947,494 | (4,500,978) | (3,880,233) | 6,158,409 | |
| Change in groundwater storage | - | - | - | (9,978) | 148,688 | - | |
| Total change in water storage | 8,416,614 | 5,783,943 | 1,947,494 | (4,510,956) | (3,731,545) | 6,158,409 | |
| Closing water storage | 29,080,563 | 20,663,949 | 14,880,006 | 12,932,512 | 17,443,468 | 21,175,013 | |
| Change in water liability | |||||||
| Surface water liability | 1,713,706 | 2,919,049 | 231,636 | (1,192,061) | (1,363,080) | 2,155,423 | |
| Carryover for individual users | 1,241,674 | 2,458,567 | 450,732 | (1,079,611) | (1,398,949) | 2,310,378 | |
| Carryover for urban system | 0 | 0 | 0 | 0 | 0 | 0 | |
| Carryover for environmental purposes | 472,032 | 460,482 | (219,095) | (112,449) | 35,869 | (154,955) | |
| Groundwater liability | 12,380 | (74,023) | 59,996 | (84,648) | 17,901 | (5,267) | |
| Carryover for individual users | 12,380 | (74,023) | 59,996 | (84,648) | 20,548 | (7,914) | |
| Carryover for urban system | 0 | 0 | 0 | 0 | 0 | 0 | |
| Carryover for salinity and water table management | 0 | 0 | 0 | 0 | 0 | 0 | |
| Carryover for environmental purposes | 0 | 0 | 0 | 0 | (2,647) | 2,647 | |
| Total change in water liability | 1,726,086 | 2,845,025 | 291,633 | (1,276,709) | (1,345,179) | 2,150,156 | |
| Net change in water assets | 6,690,528 | 2,938,918 | 1,655,861 | (3,234,247) | (2,386,366) | 4,008,254 | |
* between-store flows
Note: quantification approaches used to derive each item volume are provided in the Methods