


Murray–Darling Basin: Statement of Water Assets and Water Liabilities
as at 30 June 2022
- The volume of water in the region's surface water storages increased during 2021–22.
- Closing net water assets, which is the volume of water assets minus the water liabilities, increased by 45% from last year.
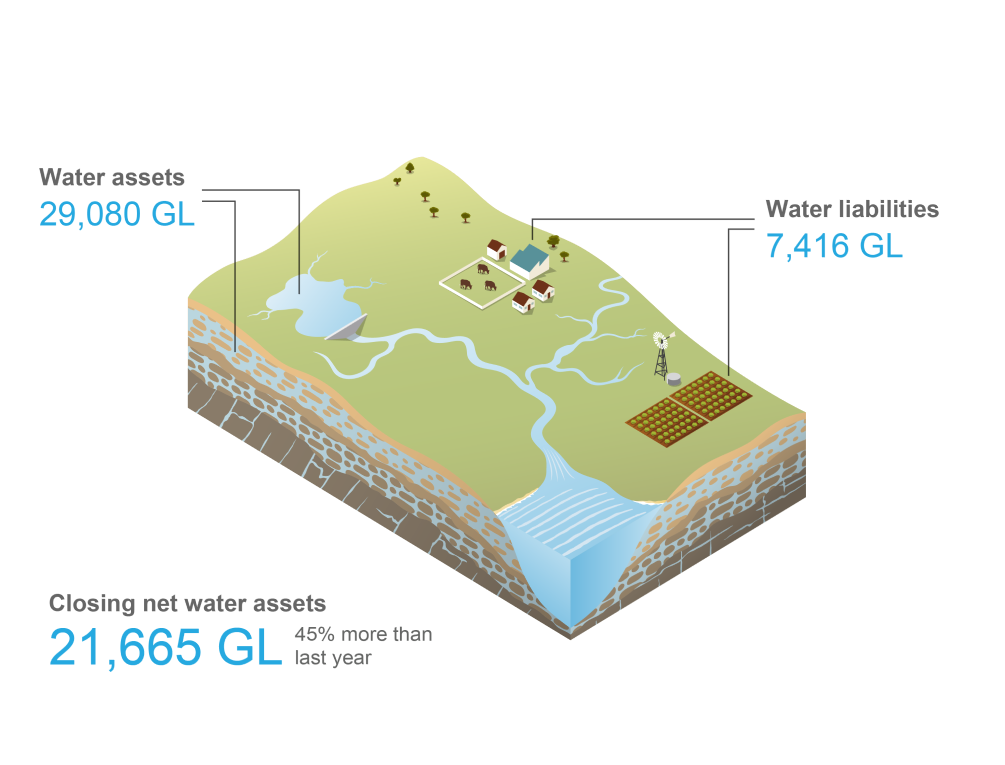
The Statement of Water Assets and Water Liabilities is provided in the table below. The statement presents the volume of water assets, and water liabilities at the start and end of the reporting year.
Select comparative year
| 2022 ML | 2021 ML | 2020 ML | 2019 ML | 2018 ML | 2017 ML | |
|---|---|---|---|---|---|---|
| Water assets | ||||||
| Surface water | 25,608,113 | 17,191,499 | 11,407,556 | 9,460,062 | 13,961,040 | 17,841,273 |
| Accessible storage | 20,096,054 | 13,929,951 | 8,574,901 | 6,775,410 | 11,306,632 | 15,091,173 |
| Dead storage | 578,704 | 578,704 | 578,704 | 578,704 | 578,704 | 578,704 |
| Rivers | 3,060,667 | 805,443 | 433,506 | 291,676 | 281,615 | 323,764 |
| Lakes and wetlands | 1,872,688 | 1,877,401 | 1,820,445 | 1,814,272 | 1,794,089 | 1,847,632 |
| Groundwater | 3,472,450 | 3,472,450 | 3,472,450 | 3,472,450 | 3,482,428 | 3,333,740 |
| Aquifers (Sustainable diversion limit) | 3,472,450 | 3,472,450 | 3,472,450 | 3,472,450 | 3,482,428 | 3,333,740 |
| Total water assets | 29,080,563 | 20,663,949 | 14,880,006 | 12,932,512 | 17,443,468 | 21,175,013 |
| Water liabilities | ||||||
| Surface water liability | 6,809,020 | 5,095,314 | 2,176,265 | 1,944,629 | 3,136,690 | 4,499,770 |
| Carryover for individual users | 5,298,398 | 4,056,724 | 1,598,157 | 1,147,426 | 2,227,037 | 3,625,986 |
| Carryover for urban system | 0 | 0 | 0 | 0 | 0 | 0 |
| Carryover for environmental purposes | 1,510,622 | 1,038,590 | 578,108 | 797,203 | 909,653 | 873,784 |
| Groundwater liability | 606,517 | 594,137 | 668,160 | 608,164 | 692,812 | 674,911 |
| Carryover for individual users | 606,517 | 594,137 | 668,160 | 608,164 | 692,812 | 672,264 |
| Carryover for urban system | 0 | 0 | 0 | 0 | 0 | 0 |
| Carryover for salinity and water table management | 0 | 0 | 0 | 0 | 0 | 0 |
| Carryover for environmental purposes | 0 | 0 | 0 | 0 | 0 | 2,647 |
| Total water liabilities | 7,415,537 | 5,689,451 | 2,844,426 | 2,552,793 | 3,829,502 | 5,174,681 |
| Net water assets | ||||||
| Net surface water assets | 18,799,093 | 12,096,185 | 9,231,291 | 7,515,433 | 10,824,350 | 13,341,503 |
| Opening net surface water assets | 12,096,185 | 9,231,291 | 7,515,433 | 10,824,350 | 13,341,503 | 9,338,517 |
| Change in net surface water assets | 6,702,908 | 2,864,894 | 1,715,858 | (3,308,917) | (2,517,153) | 4,002,987 |
| Closing net surface water assets | 18,799,093 | 12,096,185 | 9,231,291 | 7,515,433 | 10,824,350 | 13,341,503 |
| Net groundwater assets | 2,865,933 | 2,878,313 | 2,804,290 | 2,864,286 | 2,789,616 | 2,658,829 |
| Opening net groundwater assets | 2,878,313 | 2,804,290 | 2,864,286 | 2,789,616 | 2,658,829 | 2,653,562 |
| Change in net groundwater assets | (12,380) | 74,023 | (59,996) | 74,670 | 130,787 | 5,267 |
| Closing net groundwater assets | 2,865,933 | 2,878,313 | 2,804,290 | 2,864,286 | 2,789,616 | 2,658,829 |
| Total closing net water assets | 21,665,026 | 14,974,498 | 12,035,580 | 10,379,719 | 13,613,966 | 16,000,332 |
| Total change in net water assets | 6,690,528 | 2,938,918 | 1,655,861 | (3,234,247) | (2,386,366) | 4,008,254 |
Note: quantification approaches used to derive each item volume are provided in the Methods