


Murray–Darling Basin: Climate and water
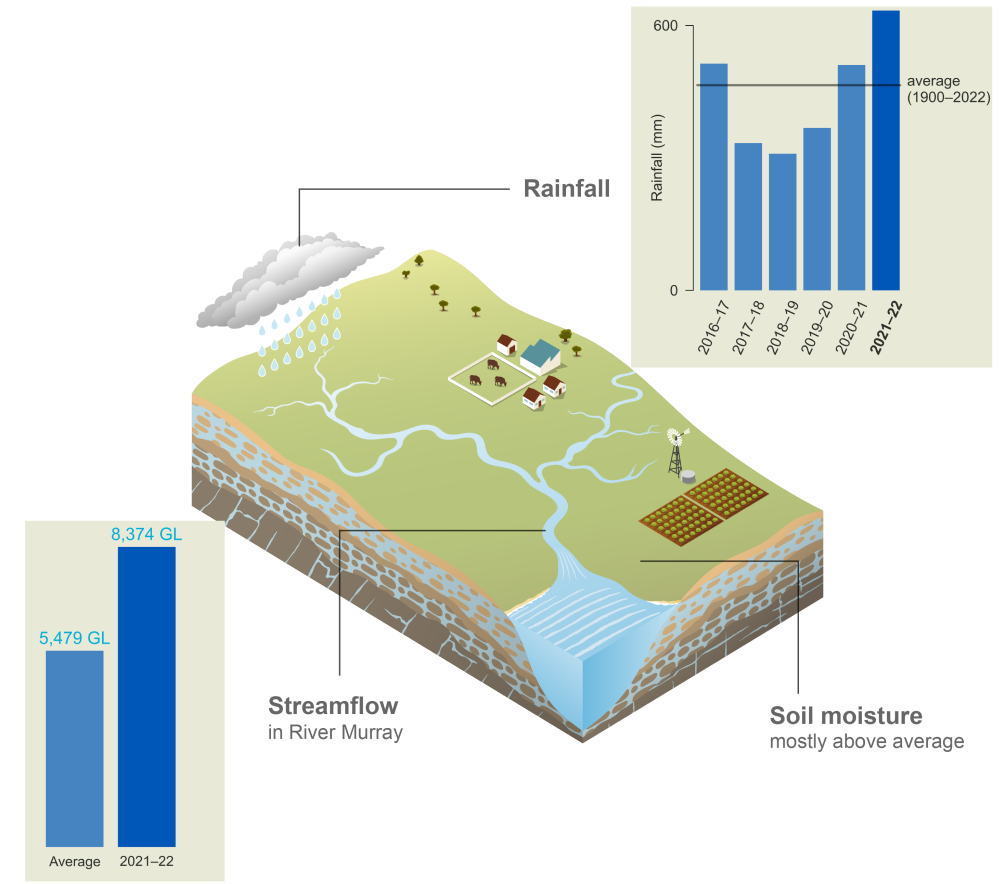
- Total annual rainfall was above average for the 2nd consecutive year.
- Annual streamflows were average to higher than average for most of the year.
- Heavy rainfall in November 2021 resulted in well above average flow in the eastern part of the region.
For further information on the region's climate and water conditions during the 2020–21 year scroll down this page or click on the links below:
About the region
- The Murray–Darling Basin region's climate ranges from sub-tropical in the north, to semi-arid in the west, and temperate in the south.
- Average rainfall across the region ranges from more than 2,100 mm in the highland areas in the south‑east to less than 300 mm in the semi-arid areas in the west.
- Typically, streamflow in the northern part of the region reflects the sub-tropical rainfall distribution with higher streamflows in the late summer–early autumn months (January–March) following the higher summer rainfall period.
- Flow in the southern part of the region reflects the more temperate climate with higher flows in the late winter–early spring months (August–October) following winter rainfall.
Climate conditions
Rainfall
Figure C1 Annual and monthly rainfall deciles for the Murray–Darling Basin region during the 2021–22 year
- Total area-averaged rainfall for the year was 634 mm, more than the mean value of 466 mm and the region's tenth highest on record since 1901.
- The annual rainfall in 2021–22 was much higher than the previous nine years when the region experienced its second driest 36-month period in more than 100 years of record.
- Rainfall was very much above average in the east of the basin area, where many of the region's water storages are located.
- A combination of climate drivers including the development of a La Niña during spring and a positive Southern Annular Mode (SAM) created favourable conditions for the above average rainfall that fell across the basin area throughout most of summer and autumn months.
- Due to some notably high totals particularly in the eastern catchments, averaged over the Murray–Darling Basin, November 2021 was the wettest November and the eighth wettest month on record.
- Much of the central and southern basin received very much above average rainfall in January and April, while the Northern Basin was much wetter than average in May.
- More information on Australia's climate and water over the 2021-22 years can be found at: Financial year climate and water report 2021-22 and Special Climate Statement 75.
Figure C2 Total monthly rainfall for the Murray–Darling Basin region during the 2021–22 year compared with the average and percentiles for the region
- The November 2021 basin average rainfall of 124mm was well above the 90th percentile, resulting in widespread flooding in the Northern Basin from November to December. Rainfall in May 2022 was above the 90th percentile and double the average monthly rainfall.
- The rainfall during June 2022 was very low; but not as low as the 10th percentile for that month.
Actual evapotranspiration
Figure C3 Annual and monthly actual evapotranspiration deciles for the Murray–Darling Basin region during the 2021–22 year
- Total area-averaged actual evapotranspiration for the 2021–22 year was above average to very much above average across most of the region, with far south-west areas experiencing lower than average evapotranspiration.
- Evapotranspiration was average to above average throughout most of the year, reflecting the wetter conditions and higher water availability across the region compared to the previous four years when conditions were very dry.
- Evapotranspiration was well above average over large parts of the region during December 2021 and May 2022 due to increased water availability following the very high rainfall in November 2021 and February–March 2022 period respectively.
- Evapotranspiration was average to lower than average over large parts of the region in September 2021 due to low water availability in early spring.
Soil moisture
Figure C4 Annual and monthly soil moisture deciles for the Murray–Darling Basin region during the 2020–21 year
- Soil moisture in the root zone (0–1 m depth) was average to above average across most of the region.
- In August–September 2021, root-zone soil moisture was average to lower than average over most of the region, particularly lower than average over the western part of the region.
- Soil moisture was average to above average across the region due to wetter conditions in early summer and autumn months.
- Soil moisture was well above average over large parts of the region excepts far the south in November–December 2021 following very high rainfall in November 2021.
- More information on soil moisture distribution across the Murray–Darling Basin region is available in the Australian Water Outlook.
Streamflow responses

Figure C5 Key flow gauging stations along the main
rivers within the Murray–Darling Basin region
- The Murray and Darling rivers are the two primary river systems within the region. Streamflow in the River Murray is influenced by dam operations and diversions for consumptive use.
- The major tributaries of the Murray and Darling rivers in the southern part of the region are predominantly regulated while most of the major tributaries in the north are unregulated.
Figure C6 Total monthly flow for major rivers in the Murray–Darling
Basin region during the 2021–22 year compared with the average and percentiles
- Streamflows were average to higher than average for most of the year, particularly in the latter half of 2021 reflecting the wet conditions experienced across the region. For example, total annual flow in the River Murray at Lock 1 Downstream (Station A4260903) was 8,374 GL compared to the average (1961–2021) value of 5,546 GL and flows remained mostly higher than the 90th percentile from January 2021.
- In November 2021, streamflow in rivers across the eastern part of the region, including the Macintyre, Dumaresq, Namoi, Gwydir, Macquarie, Balonne, Murrumbidgee and Lachlan rivers, were above average following high catchment rainfalls, with several gauges recording highest on record since 1980.
- November's heavy rainfall contributed to flooding in the Lachlan catchment and further north, becoming more widespread across the region during the month.
- Streamflows in much of New South Wales and Queensland peaked again in May due to higher than usual rainfall during that month.
- Flows into South Australia where higher than average from spring though to the end of June.