


Wednesday, 3 January 2007 - Annual Climate Summary for New South Wales - Product code IDCKGC35R0
New South Wales in 2006
El Niño brings an exceptionally hot and very dry year
Summary
- Ninth driest year since statewide average records began in 1900
- Third driest year on record for the Murray Darling Basin (MDB)
- Fifth warmest year on record for statewide averaged mean temperatures
- Second warmest day-time temperatures the state has recorded (behind the El Niño year 2002)
- 2006 is a record tenth consecutive year with above average maximum temperatures for the state
- 2006 is a record tenth consecutive year of above average statewide minimum temperatures
- The diurnal temperature range experienced this year was the sixth highest on record across the state and seventh highest for the MDB
Jump to: Extremes Records Summaries Notes the top
Rainfall
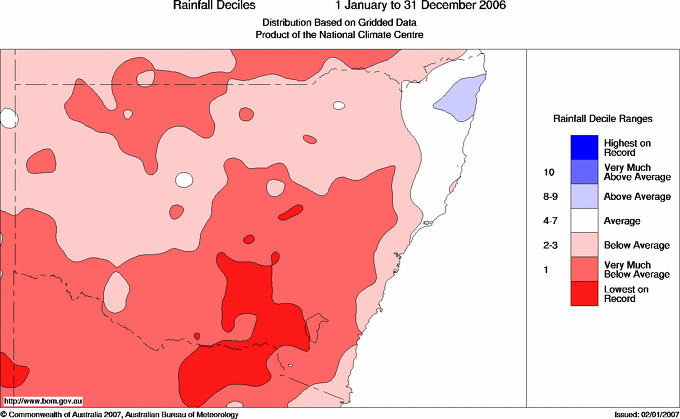
In 2006, NSW recorded its ninth driest year since statewide average records began in 1900. The statewide average rainfall for the year was just 349 mm compared to the historical average1 of 566 mm. Significant widespread rain in late December lifted the statewide annual rainfall average from what was to be the fifth driest year on record. Almost the entire state recorded below average rainfall for the year. With enhanced southeasterly winds onto the northern coast for much of the year the northeast of the state was spared from the El Niño induced drought and a small area of the central Northern Rivers recorded above average rainfall for the year. In stark contrast, the failure of cold fronts to deliver significant rainfall from autumn through spring resulted in large tracts of the southern and central slopes of the Great Divide recording lowest annual rainfall totals on record. Much of these areas, as well as parts of the Illawarra and South Coast, received between 400 and 800 mm below their average annual rainfall. Many centres recorded their lowest annual rainfall on record including Condobolin, Dubbo, Forbes, Griffith and Cabramurra (see Map 1). The drought commenced with below average rainfall in February and continued through the remainder of the year with the most severe rainfall deficiencies occurring in winter and spring with the onset of El Niño.
It was the third driest year on record for the Murray Darling Basin (MDB) with the basin receiving an average of just 282 mm compared to the historical annual average of 504 mm. Only the years 1902 (256 mm) and 1944 (274 mm) were drier.
The drought of 2006 represents a continuation of the protracted dry period affecting the state since 2001. The current six year period 2001−2006 is third only to the mid 1940s and Federation drought in the early 1900s. The only extended period drier than present for the MDB was the 6 year period ending 1945.
Some sites had their lowest total rainfall on record.
See a map of total rainfall and rainfall deciles.
Temperature
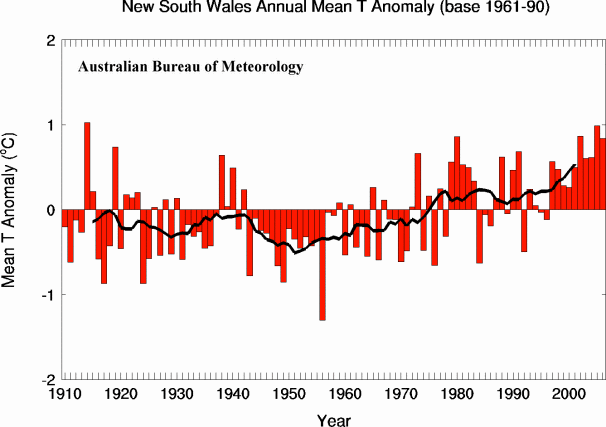
2006 was the fifth warmest year on record for statewide averaged mean temperatures (the average of the maximum and minimum temperature). The annual mean temperature for the state was 0.8ºC above the historical average1 (records since 1910). (See Figure 1)
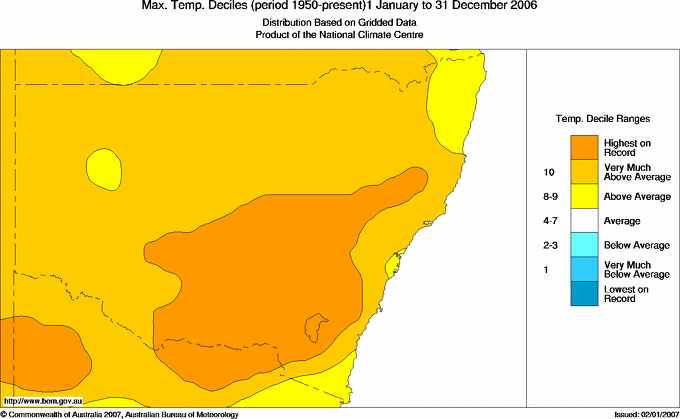
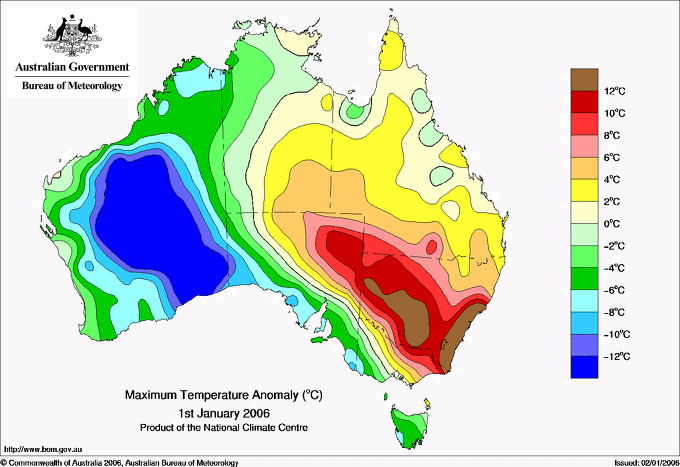
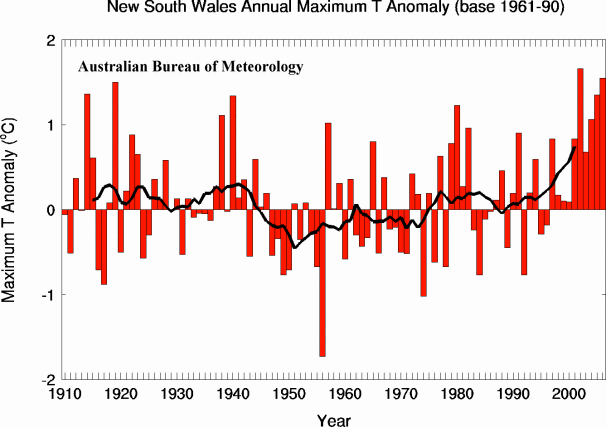
With a statewide average maximum temperature 1.6 degrees above the historical average of 23.9ºC, 2006 was the second hottest for day-time temperatures the state has recorded. The Murray Darling Basin (MDB) also recorded its second warmest year on record with maximum temperatures 1.6ºC above the historical average of 24.5ºC (See Map 2). The El Niño year of 2002 was the only year with warmer maximum temperatures since records began in 1910. The year began with extreme heat across the state on January 1 with Sydney Observatory Hill recording its second hottest day on record (44.2°C) and Sydney Airport 45.2°C (highest on record). (See Map 3). The years 2006, 2005, and 2002 all rank in the top 5 hottest the state has recorded since 1910. Significantly, this is a record tenth consecutive year of above average maximum temperatures for the state. (See Figure 2) This continues the pattern of rising temperatures consistent with global warming but was also exacerbated this year by the occurrence of El Niño. Reduced cloudiness and dry soils resulted in above average maximum temperatures.
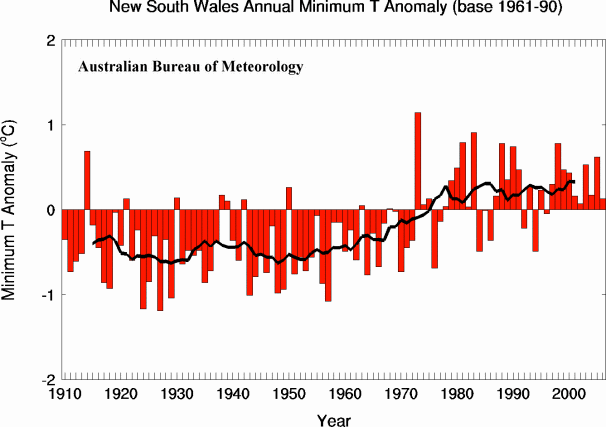
The overall statewide average minimum in 2006 was 0.1ºC above the historical average of 10.8ºC, with minimum temperatures above average in the north of the state. However, the far south of the state and an area extending from the Sydney Metropolitan to the Central Tablelands recorded lower than average minimum temperatures, with some areas near the Victorian border and around Sydney experiencing very much below average minimum temperatures (See Map 4). The cold nights were a result of the drought which reduced soil and atmospheric moisture to a minimum, enabling the dry land surface to cool quickly at night under clear skies. As with the maximum temperatures, 2006 is a record tenth consecutive year of above average statewide minimum temperatures. (See Figure 3).
With cold nights and warm days, the drought, also produced a higher than average diurnal temperature range (i.e. the difference between the daytime maximum and night time minimum). The diurnal temperature range experienced this year was the sixth highest on record across the state and seventh highest for the MDB, some 1.3ºC to 1.4ºC above average.
Some sites had their highest temperature on record.
Some sites had their highest mean daily maximum temperature on record.
Some sites had their lowest temperature on record.
Some sites had their warmest night (highest daily minimum temperature) on record.
Some sites had their highest mean daily minimum temperature on record.
Some sites had their lowest mean daily minimum temperature on record.
Further information
Clinton RakichNSW Climate Services Centre
Bureau of Meteorology
Phone (02) 9296 1610
Email reqnsw@bom.gov.au
Extremes
| Hottest day Highest temperature |
47.3°C at Wilcannia Aerodrome AWS on 1 Jan |
|---|---|
| Warmest days on average Highest mean daily maximum temperature |
29.4°C at Mungindi Post Office |
| Coolest days on average Lowest mean daily maximum temperature |
9.2°C at Thredbo AWS |
| Coldest day Lowest daily maximum temperature |
−3.4°C at Thredbo AWS on 31 Jul |
| Coldest night Lowest temperature |
−14.0°C at Charlotte Pass (Kosciusko Chalet) on 8 Aug |
| Coolest nights on average Lowest mean daily minimum temperature |
−1.3°C at Charlotte Pass (Kosciusko Chalet) |
| Warmest nights on average Highest mean daily minimum temperature |
16.8°C at Byron Bay (Cape Byron AWS) |
| Warmest night Highest daily minimum temperature |
33.2°C at Broken Hill Airport AWS on 1 Jan |
| Wettest overall Highest total rainfall |
2712.8 mm at Byron Bay (Jacaranda Drive) |
| Driest overall Lowest total rainfall | 103.0 mm at Fowlers Gap AWS |
| Wettest day Highest daily rainfall | 268.0 mm at Tweed Heads Golf Club on 20 Jan |
| Highest wind gust | 143 km/h at Thredbo AWS on 24 Sep |
Jump to: Extremes Records Summaries Notes the top
Records
| Record lowest total annual rainfall | |||||
|---|---|---|---|---|---|
|
Total rainfall for 2006 (mm) |
Previous annual lowest |
Normal annual |
Years of record |
||
| Tarcutta Post Office | 226.0 |
274.0 |
in 1967 |
664.3 |
129 |
| Tumut (Wattle Cres) | 321.6 |
339.9 |
in 1967 |
815.2 |
118 |
| Batlow Post Office | 387.4 |
478.5 |
in 1967 |
1279.5 |
116 |
| Corowa Airport | 250.2 |
253.3 |
in 1967 |
540.2 |
116 |
| Murrumburrah Old Post Office | 179.2 |
227.3 |
in 1944 |
607.4 |
111 |
| Yalgogrin North (Roloma) | 154.2 |
201.7 |
in 1982 |
475.9 |
106 |
| Lockhart Bowling Club | 185.7 |
215.3 |
in 1967 |
481.5 |
102 |
| Wyalong Post Office | 180.8 |
225.4 |
in 2002 |
479.2 |
97 |
| Burrinjuck Dam | 357.9 |
394.5 |
in 1944 |
914.5 |
96 |
| Hume Reservoir | 270.2 |
307.9 |
in 1967 |
695.7 |
84 |
| Captains Flat (Foxlow St) | 401.8 |
418.4 |
in 1944 |
735.7 |
77 |
| Quandialla Post Office | 187.2 |
207.7 |
in 1982 |
534.1 |
75 |
| Trangie Research Station AWS | 208.2 |
219.4 |
in 1937 |
496.8 |
74 |
| Condobolin Ag Research Stn | 172.5 |
213.3 |
in 1957 |
455.6 |
52 |
| Berridale (Myack Street) | 287.5 |
294.6 |
in 1982 |
571.1 |
51 |
| Blowering Dam | 372.6 |
403.9 |
in 1967 |
974.6 |
48 |
| Bowral (Parry Drive) | 476.6 |
493.8 |
in 1982 |
915.5 |
40 |
| Griffith Airport AWS | 148.8 |
178.3 |
in 1967 |
390.0 |
36 |
| Narrandera Golf Club | 193.9 |
213.3 |
in 1982 |
470.7 |
36 |
| Yarrangobilly Caves | 536.1 |
813.6 |
in 1914 |
1184.5 |
34 |
| Murrurundi (Timor) | 356.8 |
383.5 |
in 1965 |
671.6 |
27 |
| Bobadah (Pretty View) | 168.0 |
197.6 |
in 1967 |
467.7 |
26 |
| Mandurama Post Office | 400.6 |
419.0 |
in 2002 |
793.8 |
26 |
| Peats Ridge (Waratah Road) | 842.9 |
845.9 |
in 1991 |
1221.7 |
25 |
| Albury Airport | 286.6 |
414.9 |
in 2002 |
727.7 |
22 |
| Charlotte Pass (Kosciusko Chalet) | 774.7 |
1108.4 |
in 2005 |
1933.9 |
22 |
| Thredbo Village | 1017.7 |
1216.5 |
in 1977 |
1782.8 |
22 |
| Record highest annual mean daily maximum temperature | |||||
|---|---|---|---|---|---|
|
Mean daily maximum temperature for 2006 (°C) |
Previous annual highest |
Normal annual |
Years of record |
||
| Bathurst Agricultural Station | 22.2 |
21.6 |
in 2002 |
19.7 |
79 |
| Burrinjuck Dam | 23.7 |
22.9 |
in 2002 |
20.5 |
75 |
| Hume Reservoir | 23.5 |
23.0 |
in 2002 |
21.4 |
71 |
| Lithgow | 20.9 |
20.4 |
in 1994 |
18.3 |
68 |
| Canberra Airport | 21.7 |
21.2 |
in 1982 |
19.6 |
67 |
| Wagga Wagga AMO | 24.3 |
23.6 |
in 2002 |
22.0 |
65 |
| Lake Victoria Storage | 24.8 |
24.6 |
in 2002 |
23.6 |
62 |
| Trangie Research Station AWS | 26.4 |
26.2 |
in 2002 |
24.5 |
59 |
| Cowra Research Centre (Evans St) | 24.5 |
23.9 |
in 2002 |
22.1 |
53 |
| Wyalong Post Office | 25.4 |
24.8 |
in 2002 |
23.3 |
48 |
| Dunedoo Post Office | 25.6 |
25.4 |
in 2002 |
23.8 |
43 |
| Taralga Post Office | 19.9 |
19.7 |
in 1980 |
18.0 |
39 |
| Orange Airport Comparison | 19.8 |
19.1 |
in 2002 |
17.6 |
38 |
| Quandialla Post Office | 25.5 |
= 25.5 |
in 2002 |
23.6 |
38 |
| Cowra Airport Comparison | 24.9 |
24.5 |
in 1982 |
23.0 |
37 |
| Peak Hill Post Office | 26.5 |
25.9 |
in 1997 |
24.4 |
34 |
| Orange Agricultural Institute | 19.8 |
19.3 |
in 2002 |
17.8 |
31 |
| Gulgong Post Office | 24.8 |
24.3 |
in 2002 |
22.9 |
28 |
| Tumbarumba Post Office | 21.1 |
20.5 |
in 1982 |
19.5 |
25 |
| Albury Airport | 24.0 |
23.3 |
in 2002 |
21.9 |
21 |
| Record highest annual daily temperature | ||||||
|---|---|---|---|---|---|---|
| Highest temperature in 2006 (°C) |
Previous annual highest |
Normal annual |
Years of record |
|||
| Sydney Airport AMO | 45.2 |
on 1 Jan |
43.4 |
on 25 Nov 1982 |
22.1 |
67 |
| Williamtown RAAF | 44.4 |
on 1 Jan |
44.1 |
on 7 Jan 1964 |
23.0 |
57 |
| Hillston Airport | 46.0 |
on 1 Jan |
= 46.0 |
on 3 Jan 1973 |
24.2 |
49 |
| Murrurundi Post Office | 40.7 |
on 2 Feb |
40.6 |
on 10 Feb 1983 |
23.4 |
41 |
| Quirindi Post Office | 43.4 |
on 2 Feb |
41.8 |
on 21 Feb 2004 |
24.6 |
41 |
| Scone SCS | 43.5 |
on 2 Feb |
43.4 |
on 19 Nov 1968 |
24.0 |
41 |
| Barraba Post Office | 41.8 |
on 3 Feb |
41.3 |
on 4 Jan 1973 |
24.3 |
40 |
| Parramatta North (Masons Drive) | 44.8 |
on 1 Jan |
44.5 |
on 18 Jan 2003 |
23.3 |
39 |
| Montague Island Lighthouse | 41.0 |
on 1 Jan |
37.2 |
on 1 Dec 1993 |
19.4 |
38 |
| Wollongong University | 44.1 |
on 1 Jan |
42.3 |
on 25 Jan 1982 |
21.8 |
36 |
| Gulgong Post Office | 43.0 |
on 2 Feb |
= 43.0 |
on 15 Feb 2004 |
22.9 |
35 |
| Woolbrook (Danglemah Road) | 38.0 |
on 3 Feb |
36.5 |
on 31 Jan 2003 |
20.4 |
35 |
| Cooma Visitors Centre | 38.5 |
on 1 Jan |
37.9 |
on 6 Jan 1999 |
19.4 |
33 |
| Cessnock (Nulkaba) | 44.9 |
on 2 Feb |
44.4 |
on 21 Feb 2004 |
24.5 |
31 |
| Riverview Observatory | 44.0 |
on 1 Jan |
= 44.0 |
on 18 Jan 2003 |
22.1 |
24 |
| Gosford (Narara Research Station) AWS | 43.8 |
on 1 Jan |
43.0 |
on 1 Feb 1977 |
22.9 |
23 |
| Record highest annual mean daily minimum temperature | |||||
|---|---|---|---|---|---|
|
Mean daily minimum temperature for 2006 (°C) |
Previous annual highest |
Normal annual |
Years of record |
||
| Newcastle Nobbys Signal Station AWS | 15.7 |
15.4 |
in 1998 |
14.2 |
137 |
| Lithgow | 8.5 |
7.8 |
in 1998 |
6.3 |
68 |
| Record lowest annual mean daily minimum temperature | |||||
|---|---|---|---|---|---|
|
Mean daily minimum temperature for 2006 (°C) |
Previous annual lowest |
Normal annual |
Years of record |
||
| Perisher Valley Ski Centre | −0.7 |
= −0.7 |
in 1995 |
0.3 |
22 |
| Record highest annual daily minimum temperature | ||||||
|---|---|---|---|---|---|---|
| Highest daily minimum temperature in 2006 (°C) |
Previous annual highest |
Normal annual |
Years of record |
|||
| Nyngan Airport | 32.0 |
on 2 Feb |
31.0 |
on 12 Feb 2004 |
11.6 |
47 |
| Cobar MO | 32.1 |
on 1 Jan |
31.9 |
on 16 Feb 2004 |
12.7 |
44 |
| Wyalong Post Office | 30.4 |
on 1 Jan |
30.0 |
on 21 Dec 1994 |
10.0 |
41 |
| Katoomba (Murri St) | 23.4 |
on 1 Jan |
23.3 |
on 7 Jan 1964 |
7.9 |
38 |
| Kempsey (Wide Street) | 25.0 |
on 4 Feb |
= 25.0 |
on 31 Jan 2003 |
12.1 |
36 |
| Albury Airport | 25.7 |
on 30 Jan |
= 25.7 |
on 24 Jan 2001 |
8.7 |
23 |
| Broken Hill Airport AWS | 33.2 |
on 1 Jan |
32.4 |
on 11 Feb 2004 |
11.4 |
20 |
| Record lowest annual daily temperature | ||||||
|---|---|---|---|---|---|---|
| Lowest temperature in 2006 (°C) |
Previous annual lowest |
Normal annual |
Years of record |
|||
| Grenfell (Quondong Rd) | −6.5 |
on 15 Jun |
−5.0 |
on 27 Jul 1986 |
9.4 |
41 |
| Murrurundi Post Office | −6.5 |
on 16 Jun |
= −6.5 |
on 4 Aug 1994 |
8.5 |
41 |
| Tenterfield (Federation Park) | −10.6 |
on 10 Jul |
−10.0 |
on 13 Jul 2002 |
8.1 |
41 |
| Corowa Airport | −5.0 |
on 14 Jun |
−4.5 |
on 18 Jun 1998 |
8.8 |
34 |
| Albury Airport | −4.0 |
on 12 Jun |
= −4.0 |
on 19 Jun 1998 |
8.7 |
23 |
Jump to: Extremes Records Summaries Notes the top
Summaries
| Summary statistics for 2006 | ||||||||||||
|---|---|---|---|---|---|---|---|---|---|---|---|---|
| Maximum temperatures (°C) |
Minimum temperatures (°C) |
Rainfall (millimetres) |
||||||||||
| Mean for 2006 |
Diff from normal |
Highest for 2006 |
Mean for 2006 |
Diff from normal |
Lowest for 2006 |
Total for 2006 |
Normal annual total |
Rank of 2006 |
Fraction of annual normal |
|||
| Western (Far Northwest) (district 46) | ||||||||||||
| Fowlers Gap AWS | 27.1 | 45.2 | 1 Feb | 12.7 | −3.0 | 27 Jun | 103.0 | |||||
| Tibooburra Airport | 28.3 | 45.6 | 3 Feb | 15.3 | 0.8 | 27 Jun | 103.8 | |||||
| Tibooburra Post Office | 28.6 | +1.2 | 45.8 | 1 Feb | 15.2 | +1.3 | −0.1 | 27 Jun | 114.6 | 223.3 | low | 51% |
| White Cliffs AWS | 27.8 | 46.3 | 1 Jan | 14.6 | 0.3 | 24 May | 113.6 | |||||
| White Cliffs Post Office | 27.9 | +1.0 | 46.7 | 1 Jan | 14.0 | +1.4 | −0.4 | 16 Jun | 140.1 | 244.9 | low | 57% |
| Wilcannia | 27.6 | +1.0 | 46.6 | 1 Jan | 12.0 | +0.1 | −2.5 | 26 May | 151.5 | 259.3 | low | 58% |
| Wilcannia Aerodrome AWS | 27.6 | 47.3 | 1 Jan | 12.2 | −1.6 | 25 May | 157.8 | |||||
| Western (Lower Darling) (district 47) | ||||||||||||
| Broken Hill | 25.0 | +0.8 | 44.8 | 1 Feb | 12.6 | +0.8 | 0.0 | 12 Jun | 156.0 | 252.1 | low | 62% |
| Broken Hill Airport AWS | 25.0 | 44.5 | 1 Feb | 11.7 | +0.3 | −2.1 | 15 Jun | 150.0 | 246.7 | low | 61% | |
| Lake Victoria Storage | 24.8 | +1.3 | 43.5 | 22 Jan | 10.7 | −0.1 | −2.6 | 14 Jun | 118.0 | 258.8 | very low | 46% |
| Menindee Post Office | 27.4 | +1.5 | 46.4 | 1 Feb | 11.8 | +0.6 | −2.4 | 15 Jun | 189.2 | 242.5 | normal | 78% |
| Pooncarie Telecentre | 26.1 | 45.5 | 10 Jan | 10.2 | −2.5 | 15 Jun | 206.4 | 266.0 | normal | 78% | ||
| Western (Upper Darling) (district 48) | ||||||||||||
| Bourke Airport AWS | 28.6 | 46.1 | 2 Feb | 13.5 | −2.1 | 9 Jul | 122.8 | |||||
| Brewarrina Hospital | 28.4 | +0.8 | 45.1 | 2 Feb | 13.5 | +1.0 | −1.1 | 9 Jul | 202.1 | 409.5 | very low | 49% |
| Cobar Airport AWS | 26.5 | 44.7 | 2 Feb | 11.5 | −4.0 | 16 Jun | 312.4 | |||||
| Cobar MO | 26.5 | +1.4 | 45.3 | 2 Feb | 13.3 | +0.6 | −1.5 | 15 Jun | 255.6 | 396.3 | low | 64% |
| Collarenebri | 28.5 | +0.9 | 43.9 | 2 Feb | 12.8 | +0.2 | −4.0 | 10 Jul | 415.3 | 501.5 | normal | 83% |
| Lightning Ridge Visitors Information Cen | 28.7 | 44.0 | 3 Feb | 14.3 | −1.0 | 10 Jul | 283.4 | |||||
| Wanaaring Post Office | 28.8 | 46.9 | 3 Feb | 13.1 | −2.4 | 26 May | 192.0 | 276.9 | low | 69% | ||
| Western (Southwest Plains) (district 49) | ||||||||||||
| Balranald | 24.8 | +0.5 | 43.6 | 10 Jan | 9.6 | −0.4 | −3.3 | 15 Jun | 216.7 | 320.4 | low | 68% |
| Ivanhoe Aerodrome AWS | 27.3 | 45.9 | 1 Jan | 12.7 | 0.0 | 30 May | 115.6 | |||||
| Ivanhoe Post Office | 27.4 | +1.6 | 46.8 | 1 Jan | 10.6 | 0 | −3.0 | 15 Jun | 203.6 | 298.4 | low | 68% |
| Central Western Plains (S) (district 50) | ||||||||||||
| Condobolin Ag Research Stn | 25.8 | +1.5 | 45.0 | 1 Jan | 10.1 | 0 | −3.4 | 30 May | 172.5 | 455.6 | lowest | 38% |
| Condobolin Airport AWS | 25.8 | 45.6 | 1 Jan | 9.6 | −3.8 | 30 May | 192.0 | |||||
| Peak Hill Post Office | 26.5 | +2.1 | 44.3 | 2 Feb | 12.5 | +0.6 | −2.5 | 15 Jun | 249.4 | 560.4 | very low | 45% |
| West Wyalong Airport AWS | 25.5 | 45.1 | 1 Jan | 9.5 | −3.3 | 28 Jun | 122.4 | |||||
| Central Western Plains (N) (district 51) | ||||||||||||
| Coonamble Airport AWS | 27.2 | 44.1 | 2 Feb | 11.7 | −3.0 | 9 Jul | 318.4 | |||||
| Coonamble Comparison | 27.3 | +0.7 | 43.9 | 2 Feb | 11.9 | +0.3 | −2.6 | 9 Jul | 314.9 | 498.5 | low | 63% |
| Nyngan Airport | 27.2 | +1.6 | 45.0 | 3 Feb | 12.7 | +1.1 | −1.4 | 9 Aug | 194.5 | 441.0 | very low | 44% |
| Trangie Research Station AWS | 26.4 | +1.9 | 45.1 | 3 Feb | 11.3 | +0.6 | −3.0 | 15 Jun | 208.2 | 496.8 | lowest | 42% |
| Northwest Plains (W) (district 52) | ||||||||||||
| Mungindi Post Office | 29.4 | +1.8 | 44.0 | 2 Jan | 13.3 | +0.5 | −2.2 | 10 Jul | 347.3 | 505.4 | low | 69% |
| Walgett Airport AWS | 28.6 | 44.7 | 2 Feb | 12.0 | −4.2 | 9 Jul | 243.4 | |||||
| Northwest Plains (E) (district 53) | ||||||||||||
| Baradine Forestry | 27.4 | +2.0 | 42.8 | 2 Feb | 10.8 | +0.6 | −3.6 | 16 Jun | 382.4 | 624.5 | low | 61% |
| Moree Aero | 27.2 | 41.8 | 29 Nov | 12.4 | −2.4 | 9 Jul | 478.4 | |||||
| Northwest Slopes (N) (district 54) | ||||||||||||
| Barraba Post Office | 25.9 | +1.6 | 41.8 | 3 Feb | 7.8 | −0.5 | −7.6 | 10 Jul | 453.1 | 688.4 | very low | 66% |
| Narrabri Airport AWS | 27.5 | 42.9 | 2 Feb | 11.6 | −3.6 | 9 Jul | 425.4 | |||||
| Pindari Dam | 25.7 | +0.9 | 40.0 | 3 Feb | 9.3 | −0.8 | −5.0 | 10 Jul | 630.3 | 754.0 | low | 84% |
| Northwest Slopes (S) (district 55) | ||||||||||||
| Gunnedah Airport AWS | 26.8 | 42.8 | 2 Feb | 10.2 | −5.2 | 10 Jul | 353.2 | |||||
| Gunnedah Pool | 26.5 | +0.5 | 42.0 | 2 Feb | 12.1 | +1.3 | −1.3 | 16 Jun | 372.2 | 615.3 | low | 60% |
| Gunnedah Resource Centre | 26.0 | +1.6 | 42.1 | 2 Feb | 12.6 | +0.5 | −0.2 | 16 Jun | 397.2 | 633.4 | low | 63% |
| Quirindi Post Office | 25.7 | +1.1 | 43.4 | 2 Feb | 9.3 | +0.5 | −4.6 | 10 Jul | 402.1 | 684.7 | very low | 59% |
| Tamworth Airport AWS | 25.8 | 42.0 | 3 Feb | 9.8 | −4.2 | 9 Jul | 393.8 | |||||
| Woolbrook | 21.7 | +1.3 | 38.0 | 3 Feb | 5.2 | −0.2 | −10.5 | 30 May | ||||
| Northern Tablelands (W) (district 56) | ||||||||||||
| Armidale | 20.7 | 35.8 | 3 Feb | 5.5 | −10.8 | 10 Jul | 619.2 | |||||
| Armidale Airport AWS | 19.9 | 35.3 | 3 Feb | 7.4 | −4.8 | 23 May | 620.8 | |||||
| Glen Innes Ag Research Stn | 20.2 | +0.7 | 33.0 | 3 Feb | 7.0 | −0.4 | −7.0 | 10 Jul | ||||
| Glen Innes Airport AWS | 20.7 | 33.9 | 3 Jan | 5.2 | −12.3 | 10 Jul | 864.4 | |||||
| Glen Innes Post Office | 20.9 | +0.7 | 34.5 | 2 Feb | 8.0 | +0.8 | −6.1 | 10 Jul | 956.0 | 857.3 | high | 112% |
| Guyra Hospital | 18.1 | +0.5 | 31.3 | 3 Feb | 6.3 | −0.2 | −4.8 | 25 Jun | 898.9 | 914.5 | normal | 98% |
| Inverell | 24.7 | 38.8 | 3 Feb | 7.1 | −8.9 | 10 Jul | 626.0 | |||||
| Inverell Research Centre | 24.0 | +1.4 | 37.6 | 3 Feb | 9.9 | −0.4 | −3.5 | 24 May | 637.6 | 798.4 | low | 80% |
| Tenterfield | 22.0 | +0.6 | 35.5 | 4 Feb | 6.9 | −1.2 | −10.6 | 10 Jul | 717.8 | 850.9 | low | 84% |
| Northern Tablelands (E) (district 57) | ||||||||||||
| Tabulam | 22.4 | +0.2 | 39.2 | 3 Jan | 12.8 | +0.2 | 3.2 | 31 May | 1234.4 | 1232.4 | normal | 100% |
| Upper North Coast (district 58) | ||||||||||||
| Alstonville Tropical Fruit Research Stat | 23.3 | −0.1 | 36.2 | 3 Jan | 15.3 | +0.2 | 7.5 | 24 May | 1816.6 | 1782.9 | normal | 102% |
| Ballina Airport AWS | 24.3 | 37.0 | 29 Nov | 14.1 | 3.0 | 1 Jun | ||||||
| Byron Bay | 23.2 | 31.6 | 20 Feb | 16.8 | 8.7 | 21 Jul | 1863.8 | |||||
| Byron Bay | 23.1 | −0.6 | 31.6 | 20 Feb | 16.5 | +0.1 | 8.5 | 6 Aug | 2062.2 | 1725.8 | high | 119% |
| Casino Airport | 26.2 | −0.6 | 41.2 | 3 Jan | 13.7 | +0.6 | 1.0 | 10 Jul | 1292.1 | 1096.3 | high | 118% |
| Casino Airport AWS | 25.4 | 41.1 | 3 Jan | 13.2 | 0.6 | 9 Jul | 1332.4 | |||||
| Evans Head RAAF Bombing Range AWS | 23.9 | 38.0 | 29 Nov | 14.6 | 5.7 | 2 Aug | 1455.0 | |||||
| Grafton Airport | 24.2 | 38.8 | 29 Nov | 9.8 | −2.7 | 10 Jul | 1367.8 | |||||
| Grafton Olympic Pool | 25.9 | +0.1 | 41.6 | 3 Jan | 13.7 | 0 | −0.5 | 10 Jul | 1147.8 | 1047.1 | normal | 110% |
| Grafton Research Stn | 25.8 | 42.4 | 3 Jan | 13.7 | −1.8 | 10 Jul | 1064.4 | 990.0 | normal | 108% | ||
| Lismore | 24.7 | 38.4 | 3 Jan | 14.4 | 5.4 | 10 Jul | 1657.4 | |||||
| Lismore Airport AWS | 25.5 | 40.4 | 3 Jan | 12.4 | −0.3 | 16 Jun | ||||||
| Murwillumbah | 25.8 | 0 | 37.2 | 3 Jan | 14.7 | +0.4 | 2.6 | 2 Jun | 1429.2 | 1580.8 | normal | 90% |
| Yamba Pilot Station | 23.4 | +0.1 | 36.3 | 29 Nov | 15.5 | +0.1 | 5.7 | 10 Jul | 1508.1 | 1458.5 | normal | 103% |
| Lower North Coast (district 59) | ||||||||||||
| Coffs Harbour MO | 23.7 | +0.4 | 40.5 | 29 Nov | 14.1 | +0.1 | 1.2 | 10 Jul | 1686.6 | 1682.9 | normal | 100% |
| Dorrigo | 20.0 | 35.0 | 3 Jan | 9.7 | −2.4 | 9 Jul | 2297.5 | |||||
| Kempsey | 25.0 | −0.1 | 39.0 | 29 Nov | 12.3 | +0.2 | 0.0 | 10 Jul | 862.6 | 1204.8 | low | 72% |
| Kempsey Airport AWS | 25.0 | 39.8 | 29 Nov | 11.6 | −3.2 | 10 Jul | 805.8 | |||||
| South West Rocks | 23.7 | +0.6 | 31.5 | 3 Feb | 15.9 | +0.3 | 5.0 | 12 Aug | 1182.2 | 1483.9 | normal | 80% |
| Manning (district 60) | ||||||||||||
| Forster - Tuncurry R.V.C.P. | 22.6 | 36.0 | 29 Nov | 14.2 | 4.5 | 9 May | 1197.7 | 1220.3 | normal | 98% | ||
| Port Macquarie Airport AWS | 23.7 | 38.6 | 29 Nov | 12.4 | −2.9 | 16 Jun | 1311.4 | |||||
| Taree Airport AWS | 24.2 | 38.0 | 29 Nov | 12.3 | −3.0 | 10 Jul | 801.3 | |||||
| Yarras | 24.6 | +0.4 | 39.4 | 1 Jan | 11.6 | −0.1 | −3.5 | 11 Jul | ||||
| Hunter (district 61) | ||||||||||||
| Cessnock | 25.7 | +1.2 | 44.9 | 2 Feb | 11.3 | 0 | −2.1 | 9 Jul | 498.1 | 747.8 | very low | 67% |
| Cessnock Airport AWS | 24.8 | 44.0 | 2 Feb | 10.2 | −3.7 | 28 Jun | 458.2 | |||||
| Gosford | 23.5 | +0.6 | 43.8 | 1 Jan | 11.2 | +0.2 | −0.4 | 9 Jul | 1028.0 | 1309.8 | low | 78% |
| Jerrys Plains Post Office | 26.1 | +0.8 | 45.5 | 2 Feb | 10.8 | +0.2 | −1.4 | 8 Jul | 368.3 | 637.7 | very low | 58% |
| Lostock Dam | 24.1 | +0.9 | 42.0 | 2 Feb | 12.0 | −0.1 | 1.5 | 10 Jul | 711.0 | 951.3 | low | 75% |
| Maitland Visitors Centre | 25.0 | 43.4 | 1 Jan | 11.2 | −2.0 | 9 Jul | 679.7 | |||||
| Mangrove Mountain AWS | 22.2 | 41.7 | 1 Jan | 11.4 | 0.2 | 16 Jun | 871.6 | |||||
| Murrurundi Gap AWS | 21.4 | 39.4 | 2 Feb | 10.8 | 0.7 | 26 Jun | 507.4 | |||||
| Murrurundi Post Office | 24.0 | +0.6 | 40.7 | 2 Feb | 7.5 | −1.0 | −6.5 | 16 Jun | 506.2 | 828.8 | very low | 61% |
| Nelson Bay | 22.8 | 34.2 | 24 Sep | 15.6 | 6.7 | 17 Nov | 1240.8 | 1341.1 | normal | 93% | ||
| Newcastle Nobbys Signal Station AWS | 22.7 | +0.9 | 41.4 | 1 Jan | 15.7 | +1.5 | 6.5 | 13 Jun | 938.6 | 1128.3 | low | 83% |
| Newcastle University | 24.0 | 43.2 | 1 Jan | 13.2 | 2.1 | 16 Jun | 1001.8 | |||||
| Norah Head AWS | 22.4 | 43.6 | 1 Jan | 14.9 | 5.8 | 8 Jul | 1061.0 | |||||
| Paterson | 24.7 | +0.8 | 40.8 | 3 Jan | 11.8 | −0.1 | 0.3 | 15 Jun | 620.8 | 915.5 | very low | 68% |
| Peats Ridge | 22.6 | +0.7 | 42.2 | 1 Jan | 11.3 | +0.1 | 1.5 | 28 Jun | 842.9 | 1221.7 | lowest | 69% |
| Scone Airport AWS | 25.3 | 42.6 | 2 Feb | 10.0 | −3.8 | 10 Jul | 362.4 | |||||
| Scone SCS | 25.7 | +1.7 | 43.5 | 2 Feb | 10.8 | −0.2 | −0.4 | 16 Jun | ||||
| Singleton Stp | 25.5 | 45.9 | 1 Jan | 10.5 | −2.9 | 28 Jun | 426.2 | |||||
| Williamtown RAAF | 23.9 | +0.9 | 44.4 | 1 Jan | 12.2 | −0.2 | 0.6 | 11 Jul | 1065.4 | 1118.5 | normal | 95% |
| Central Tablelands (N) (district 62) | ||||||||||||
| Gulgong Post Office | 24.8 | +1.9 | 43.0 | 2 Feb | 9.1 | −0.5 | −4.2 | 10 Jul | 381.1 | 646.8 | very low | 59% |
| Mudgee Airport AWS | 24.1 | 40.9 | 3 Feb | 7.6 | −7.5 | 15 Jun | 349.6 | |||||
| Nullo Mountain AWS | 17.4 | 35.9 | 2 Feb | 8.2 | −1.8 | 25 Jun | 603.2 | |||||
| Central Tablelands (S) (district 63) | ||||||||||||
| Bathurst Agricultural Station | 22.2 | +2.5 | 37.5 | 2 Feb | 5.8 | −1.0 | −8.2 | 15 Jun | 420.1 | 632.8 | very low | 66% |
| Bathurst Airport AWS | 21.6 | 37.5 | 2 Feb | 6.2 | −7.3 | 15 Jun | 374.0 | |||||
| Cowra Research Centre | 24.5 | +2.4 | 41.0 | 2 Feb | 10.1 | +0.2 | −2.9 | 15 Jun | 286.9 | 636.2 | very low | 45% |
| Katoomba | 18.2 | +1.5 | 35.3 | 2 Feb | 8.4 | +0.5 | −1.9 | 12 Jun | 976.9 | 1386.8 | low | 70% |
| Lithgow | 20.9 | +2.6 | 37.0 | 1 Jan | 8.5 | +2.2 | −5.2 | 15 Jun | ||||
| Lithgow | 18.5 | 32.4 | 11 Dec | 4.7 | −7.6 | 8 Aug | ||||||
| Mount Boyce AWS | 17.7 | 34.5 | 2 Feb | 8.1 | −1.7 | 12 Jun | 640.4 | |||||
| Oberon | 18.3 | +1.7 | 34.5 | 2 Feb | 4.7 | −0.2 | −8.5 | 15 Jun | 539.3 | 840.2 | low | 64% |
| Orange Agricultural Institute | 19.8 | +1.9 | 35.5 | 2 Feb | 7.0 | −0.1 | −5.0 | 28 Jun | 489.4 | 923.5 | very low | 53% |
| Orange Airport AWS | 19.6 | 35.1 | 2 Feb | 5.4 | −8.3 | 28 Jun | 494.2 | |||||
| Orange Airport Comparison | 19.8 | +2.2 | 35.2 | 2 Feb | 6.4 | +0.2 | −5.0 | 31 May | 494.1 | 890.1 | very low | 56% |
| Springwood Bowling Club | 22.0 | 38.0 | 1 Dec | 10.1 | −0.3 | 15 Jun | ||||||
| Central Western Slopes (N) (district 64) | ||||||||||||
| Coonabarabran | 24.7 | +1.1 | 41.0 | 2 Feb | 6.5 | −0.8 | −7.4 | 10 Jul | 461.2 | 746.1 | very low | 62% |
| Coonabarabran Airport AWS | 23.6 | 39.9 | 2 Feb | 11.5 | 1.0 | 26 Jun | 433.2 | |||||
| Dunedoo Post Office | 25.6 | +1.8 | 42.4 | 2 Feb | 9.7 | +0.2 | −4.5 | 10 Jul | 425.9 | 610.9 | low | 70% |
| Central Western Slopes (S) (district 65) | ||||||||||||
| Cowra Airport AWS | 25.0 | 42.3 | 1 Jan | 7.7 | −4.7 | 13 Jul | 261.8 | |||||
| Cowra Airport Comparison | 24.9 | +1.9 | 42.1 | 2 Feb | 8.1 | −0.1 | −4.1 | 22 May | 264.5 | 596.5 | very low | 44% |
| Dubbo Airport AWS | 25.9 | 43.4 | 3 Feb | 10.2 | −4.2 | 15 Jun | 228.6 | |||||
| Forbes Airport AWS | 25.8 | 45.1 | 1 Jan | 8.7 | −5.0 | 13 Jul | 158.8 | |||||
| Parkes | 25.8 | +2.4 | 44.5 | 2 Feb | 10.7 | −0.2 | −4.0 | 15 Jun | 248.8 | 582.9 | very low | 43% |
| Parkes Airport AWS | 25.1 | 44.0 | 2 Feb | 8.4 | −5.0 | 15 Jun | 248.2 | |||||
| Wellington | 25.8 | +1.5 | 43.0 | 3 Feb | 9.4 | +0.1 | −4.6 | 15 Jun | 291.7 | 611.9 | very low | 48% |
| Metropolitan (E) (district 66) | ||||||||||||
| Bankstown Airport AWS | 23.8 | +0.7 | 44.4 | 1 Jan | 11.9 | 0 | −0.1 | 9 Jul | 566.6 | 871.5 | low | 65% |
| Canterbury Racecourse AWS | 23.1 | 44.2 | 1 Jan | 12.2 | 1.3 | 10 Jul | 798.0 | |||||
| Holsworthy Control Range | 23.9 | 44.3 | 1 Jan | 11.3 | −0.9 | 9 Jul | 470.0 | |||||
| Parramatta North | 24.0 | +0.7 | 44.8 | 1 Jan | 12.2 | +0.1 | 2.0 | 15 Jun | 761.1 | 961.3 | low | 79% |
| Riverview Observatory | 23.0 | +0.9 | 44.0 | 1 Jan | 13.3 | +1.1 | 3.8 | 9 Jul | 931.0 | 1126.9 | low | 83% |
| Sydney | 23.1 | +1.5 | 44.2 | 1 Jan | 14.6 | +0.9 | 5.8 | 12 Jun | 994.0 | 1215.1 | low | 82% |
| Sydney Airport AMO | 23.0 | +0.8 | 45.2 | 1 Jan | 14.6 | +1.3 | 5.4 | 9 Jul | 865.0 | 1086.9 | low | 80% |
| Sydney Harbour | 21.4 | 42.2 | 1 Jan | 15.5 | 7.5 | 12 Jun | ||||||
| Sydney Olympic Park | 23.6 | 44.7 | 1 Jan | 13.7 | 3.7 | 9 Jul | 741.6 | |||||
| Terrey Hills AWS | 22.0 | 43.3 | 1 Jan | 12.9 | 3.4 | 9 Jul | 762.6 | |||||
| Metropolitan (W) (district 67) | ||||||||||||
| Badgerys Creek AWS | 24.4 | 44.0 | 1 Jan | 10.3 | −2.3 | 11 Jul | 483.2 | |||||
| Horsley Park Equestrian Centre AWS | 24.2 | 44.2 | 1 Jan | 11.8 | 0.7 | 15 Jun | 591.8 | |||||
| Liverpool | 24.5 | 44.0 | 1 Jan | 11.0 | −1.0 | 9 Jul | 518.1 | |||||
| Penrith Lakes AWS | 25.0 | 44.4 | 1 Jan | 12.1 | 1.0 | 28 Jun | 501.0 | |||||
| Prospect Dam | 24.1 | +1.0 | 43.8 | 1 Jan | 12.0 | −0.3 | 1.7 | 15 Jun | 582.1 | 870.6 | low | 67% |
| Richmond RAAF | 24.4 | 43.8 | 1 Jan | 10.3 | −3.3 | 9 Jul | 490.6 | |||||
| Illawarra (district 68) | ||||||||||||
| Albion Park | 22.6 | 45.0 | 1 Jan | 11.0 | −2.0 | 15 Jun | 687.0 | |||||
| Bellambi AWS | 21.7 | 43.7 | 1 Jan | 14.5 | 6.6 | 15 Jun | 809.8 | |||||
| Bowral | 19.6 | +0.9 | 36.5 | 2 Feb | 8.1 | +0.4 | −3.5 | 15 Jun | 476.6 | 915.5 | lowest | 52% |
| Camden Airport AWS | 24.4 | +0.8 | 44.0 | 1 Jan | 10.0 | −0.2 | −3.1 | 11 Jul | 475.0 | 781.9 | very low | 61% |
| Campbelltown | 28.3 | 40.3 | 1 Dec | 13.8 | 6.7 | 18 Nov | ||||||
| Jervis Bay | 20.7 | 42.1 | 1 Jan | 14.1 | 5.8 | 15 Jun | 1175.2 | |||||
| Moss Vale AWS | 19.4 | 38.6 | 1 Jan | 7.4 | −6.3 | 15 Jun | 531.2 | |||||
| Nowra RAN Air Station AWS | 22.3 | 43.6 | 1 Jan | 11.0 | 1.1 | 11 Jul | 587.4 | |||||
| Wollongong University | 22.1 | +0.3 | 44.1 | 1 Jan | 12.8 | −0.5 | 2.7 | 15 Jun | 855.4 | 1342.8 | very low | 64% |
| South Coast (district 69) | ||||||||||||
| Batemans Bay | 21.7 | 40.2 | 1 Dec | 9.4 | −1.5 | 8 Aug | 656.8 | |||||
| Bega AWS | 22.4 | 44.1 | 1 Jan | 8.3 | −3.6 | 8 Aug | 401.8 | |||||
| Braidwood Racecourse AWS | 20.2 | 39.0 | 1 Jan | 5.5 | −8.1 | 8 Aug | 482.6 | |||||
| Green Cape AWS | 19.6 | 28.9 | 1 Jan | 13.1 | 6.7 | 28 Oct | 575.8 | |||||
| Merimbula Airport AWS | 20.7 | 42.0 | 1 Jan | 9.5 | −1.0 | 8 Aug | 638.2 | |||||
| Montague Island Lighthouse | 19.7 | +0.3 | 41.0 | 1 Jan | 14.3 | +0.5 | 8.0 | 12 Jun | 744.6 | 890.1 | normal | 84% |
| Moruya Airport AWS | 21.2 | 44.0 | 1 Jan | 9.6 | −1.0 | 12 Jun | 650.6 | |||||
| Moruya Heads Pilot Station | 20.6 | +0.2 | 43.1 | 1 Jan | 11.6 | +0.3 | 2.1 | 12 Jun | 656.1 | 959.3 | low | 68% |
| Narooma Rvcp | 20.2 | 43.5 | 1 Jan | 12.2 | 3.5 | 13 Jul | 786.6 | 914.4 | normal | 86% | ||
| Nerriga Composite | 20.0 | +1.0 | 38.5 | 1 Jan | 5.7 | −0.8 | −7.0 | 8 Aug | 563.6 | 766.0 | low | 74% |
| Ulladulla AWS | 20.6 | 43.8 | 1 Jan | 13.0 | 5.0 | 15 Jun | 877.8 | |||||
| Sthn Tablelands Gburn-Monaro (district 70) | ||||||||||||
| Bombala | 19.4 | +1.1 | 37.8 | 22 Jan | 4.7 | 0 | −7.1 | 8 Aug | 498.8 | 645.5 | low | 77% |
| Bombala AWS | 18.1 | 38.5 | 22 Jan | 4.8 | −6.1 | 11 May | 453.2 | |||||
| Canberra Airport | 21.7 | +2.1 | 39.9 | 1 Jan | 7.0 | +0.6 | −6.0 | 8 Aug | 361.0 | 618.8 | very low | 58% |
| Cooma Airport AWS | 19.0 | 37.1 | 1 Jan | 3.7 | −9.5 | 8 Aug | 369.4 | |||||
| Cooma Visitors Centre | 20.2 | +0.8 | 38.5 | 1 Jan | 3.3 | −0.8 | −10.5 | 8 Aug | 297.7 | 533.3 | very low | 56% |
| Goulburn Airport AWS | 20.9 | 39.1 | 1 Jan | 5.7 | −7.2 | 23 May | 395.0 | |||||
| Mount Ginini AWS | 12.9 | 30.0 | 1 Jan | 3.5 | −7.0 | 12 Jun | 352.2 | |||||
| Taralga Post Office | 19.9 | +1.9 | 37.4 | 1 Jan | 5.8 | −0.2 | −6.1 | 28 Jun | 461.2 | 802.7 | very low | 57% |
| Tidbinbilla Nature Reserve | 21.1 | 39.0 | 1 Jan | 6.5 | −9.0 | 7 Jul | 465.5 | 946.3 | very low | 49% | ||
| Tuggeranong | 21.7 | 39.2 | 1 Jan | 6.9 | −7.1 | 8 Aug | 340.2 | |||||
| Yass | 22.4 | +1.8 | 40.0 | 1 Jan | 7.1 | −0.2 | −5.1 | 28 Jun | 328.1 | 646.4 | very low | 51% |
| Sthn Tablelands Snowy-Mountns (district 71) | ||||||||||||
| Charlotte Pass | 10.7 | +1.1 | 25.3 | 10 Jan | −1.3 | −0.7 | −14.0 | 8 Aug | 774.7 | 1933.9 | lowest | 40% |
| Perisher Valley Ski Centre | 10.7 | 27.0 | 10 Jan | −0.7 | −1.0 | −12.0 | 26 Aug | 1103.1 | 1813.3 | very low | 61% | |
| Thredbo AWS | 9.2 | 25.0 | 1 Jan | 1.2 | −10.0 | 22 Oct | 657.6 | |||||
| Thredbo Village | 14.7 | 31.5 | 1 Jan | 1.6 | −9.6 | 22 Oct | 1017.7 | 1782.8 | lowest | 57% | ||
| Southwest Slopes (S) (district 72) | ||||||||||||
| Albury Airport | 24.0 | +2.1 | 43.5 | 1 Jan | 8.4 | −0.3 | −4.0 | 12 Jun | 286.6 | 727.7 | lowest | 39% |
| Albury Airport AWS | 23.6 | 42.6 | 1 Jan | 8.3 | −3.7 | 13 Jun | 296.6 | |||||
| Cabramurra SMHEA AWS | 13.8 | 30.3 | 1 Jan | 5.3 | −5.5 | 12 Jun | 566.6 | |||||
| Hume Reservoir | 23.5 | +2.1 | 41.4 | 1 Jan | 10.1 | +0.2 | −1.5 | 13 Jun | 270.2 | 695.7 | lowest | 39% |
| Khancoban AWS | 22.5 | 42.0 | 1 Jan | 6.5 | −4.2 | 12 Jun | 463.0 | |||||
| Tumbarumba Post Office | 21.1 | +1.7 | 38.6 | 1 Jan | 5.4 | 0 | −7.3 | 14 Jun | 438.2 | 977.1 | very low | 45% |
| Wagga Wagga AMO | 24.3 | +2.4 | 44.6 | 1 Jan | 8.4 | −0.6 | −5.1 | 13 Jul | 267.4 | 570.5 | very low | 47% |
| Southwest Slopes (N) (district 73) | ||||||||||||
| Burrinjuck Dam | 23.7 | +3.2 | 41.1 | 1 Jan | 9.8 | +0.8 | −1.5 | 12 Jun | 357.9 | 914.5 | lowest | 39% |
| Cootamundra Airport | 23.7 | 43.2 | 1 Jan | 7.0 | −6.5 | 30 May | 243.2 | |||||
| Grenfell | 24.1 | +1.7 | 41.8 | 1 Jan | 10.4 | +1.0 | −6.5 | 15 Jun | 295.9 | 624.9 | very low | 47% |
| Gundagai | 24.0 | 43.1 | 1 Jan | 8.7 | −4.6 | 14 Jun | 283.4 | |||||
| Quandialla Post Office | 25.5 | +1.9 | 44.0 | 1 Jan | 9.4 | −0.2 | −3.6 | 15 Jun | 187.2 | 534.1 | lowest | 35% |
| Temora Airport | 24.7 | 45.1 | 1 Jan | 7.4 | −4.6 | 23 May | 188.6 | |||||
| Wyalong Post Office | 25.4 | +2.1 | 44.8 | 1 Jan | 10.5 | +0.6 | −2.9 | 28 Jun | 180.8 | 479.2 | lowest | 38% |
| Young Airport | 23.6 | 41.6 | 1 Jan | 6.1 | −6.1 | 13 Jul | 262.4 | |||||
| Riverina (E) (district 74) | ||||||||||||
| Corowa Airport | 23.8 | +1.2 | 43.6 | 1 Jan | 8.8 | 0 | −5.0 | 14 Jun | 250.2 | 540.2 | lowest | 46% |
| Deniliquin Airport AWS | 23.9 | 42.9 | 22 Jan | 8.9 | −4.4 | 15 Jun | 219.2 | |||||
| Narrandera Golf Club | 24.7 | +1.4 | 44.9 | 1 Jan | 9.6 | −0.3 | −2.8 | 14 Jun | 193.9 | 470.7 | lowest | 41% |
| Tocumwal Airport | 23.8 | +1.0 | 43.7 | 23 Jan | 9.2 | −0.4 | −4.5 | 14 Jun | 205.2 | 447.1 | very low | 46% |
| Yanco Agricultural Institute | 24.7 | 45.0 | 1 Jan | 10.9 | −2.0 | 14 Jun | 189.8 | |||||
| Riverina (W) (district 75) | ||||||||||||
| Griffith Airport AWS | 25.3 | 45.0 | 1 Feb | 9.9 | −3.0 | 12 Jun | 148.8 | 390.0 | lowest | 38% | ||
| Hay | 25.2 | +1.0 | 43.5 | 1 Jan | 10.2 | +0.3 | −2.2 | 30 May | 172.7 | 365.8 | very low | 47% |
| Hay CSIRO AWS | 24.9 | 43.0 | 1 Feb | 9.2 | −4.0 | 30 May | 114.6 | |||||
| Hillston Airport | 25.9 | +1.6 | 46.0 | 1 Jan | 9.9 | −1.0 | −3.0 | 15 Jun | 218.6 | 365.2 | low | 60% |
| Lake Cargelligo Airport | 25.7 | +0.6 | 45.7 | 1 Jan | 11.0 | +0.1 | −2.0 | 14 Jun | 166.4 | 421.8 | very low | 39% |
Jump to: Extremes Records Summaries Notes the top
Notes
This statement has been prepared based on information available at 8 am on Wednesday 3 January 2007. Some checks have been made on the data, but it is possible that results will change as new information becomes available.
A note about deciles: Deciles are used to give an element (in this case rainfall or temperature) a ranking. Deciles are calculated by arranging the totals in ascending order (from lowest to highest) then splitting them into 10 equal groups (thus the groups are called deciles). The first group would be in decile range one, the second group in decile range two, etc up to the highest annual totals (highest 10 per cent) being in decile range 10.
1Averages: Averages are based on the period 1961 to 1990 which is a convention of the World Meteorological Organisation
Normals are long-term averages based on observations from all available years of record, which vary widely from site to site. They are not shown for sites with less than 20 years of record, as they cannot then be calculated reliably.
Drought information is available from the NSW Department of Primary Industries http://www.agric.nsw.gov.au/reader/drt-area
Further information
Clinton RakichNSW Climate Services Centre
Bureau of Meteorology
Phone (02) 9296 1610
Email reqnsw@bom.gov.au