


This brochure describes the flood risk and previous flooding in the
Macintyre/Weir River catchment, last updated in July 2025.
Flood Risk
The Macintyre and Weir Rivers drain an area of about 44,000 square kilometres, most of which lies in the southern border parts of Queensland, with a small part of the basin extending into New South Wales.
The landscape of the Border Rivers catchment is diverse, ranging from tablelands and slopes in the east to semi-arid plains in the south-west. Elevations in the Great Dividing Range, near where the Macintyre River rises, can be up to 1,500 m, whereas the floodplains have an elevation between 100 to 200 m above sea level.
The eastern part of the catchment where most of the rivers rise, has an annual average rainfall of 800 to 1,100 mm. The Maranoa Valley has an average annual rainfall of around 500 to 600 mm, and the floodplains to the west have an average of around 500 mm. Rainfall throughout the catchment is summer dominant and the climate is described as subtropical on the plains and temperate at higher altitudes.
The Macintyre River has three main tributaries - the Macintyre River in New South Wales, the Dumaresq River along the border, and the Macintyre Brook which flows through Inglewood. Major flooding can occur along each of these river systems causing isolation of towns and rural lands, and severe flooding at times in the Goondiwindi area. Flooding is typically slow, due to the flat expansive and flood plains by the time it arrives at Goondiwindi and areas further downstream, and significant breakout flows can travel across flood plains into various channels, making flood forecasting challenging.
In contrast, flooding on the Macintyre Brook occurs rapidly, with Inglewood sitting approximately 13km downstream of Coolmunda Dam, providing limited flood warning lead time once dam outflows occur. Flood waters typically take around 5 hours to travel between Coolmunda Dam and Inglewood township.
Flash flooding also occurs at Stanthorpe on Quart Pot Creek which flows through the centre of town and is located not far downstream of Storm King Dam.
Major flooding is also experienced along the Weir River which joins the Macintyre about 200 kilometres downstream from Goondiwindi, near Talwood and becoming the Barwon River shortly upstream of Mungindi, eventually draining into the Darling River. The Border Rivers catchment area makes up 4% of the Murray-Darling Basin and contributes about 5% of surface water inflow.
Previous Flooding
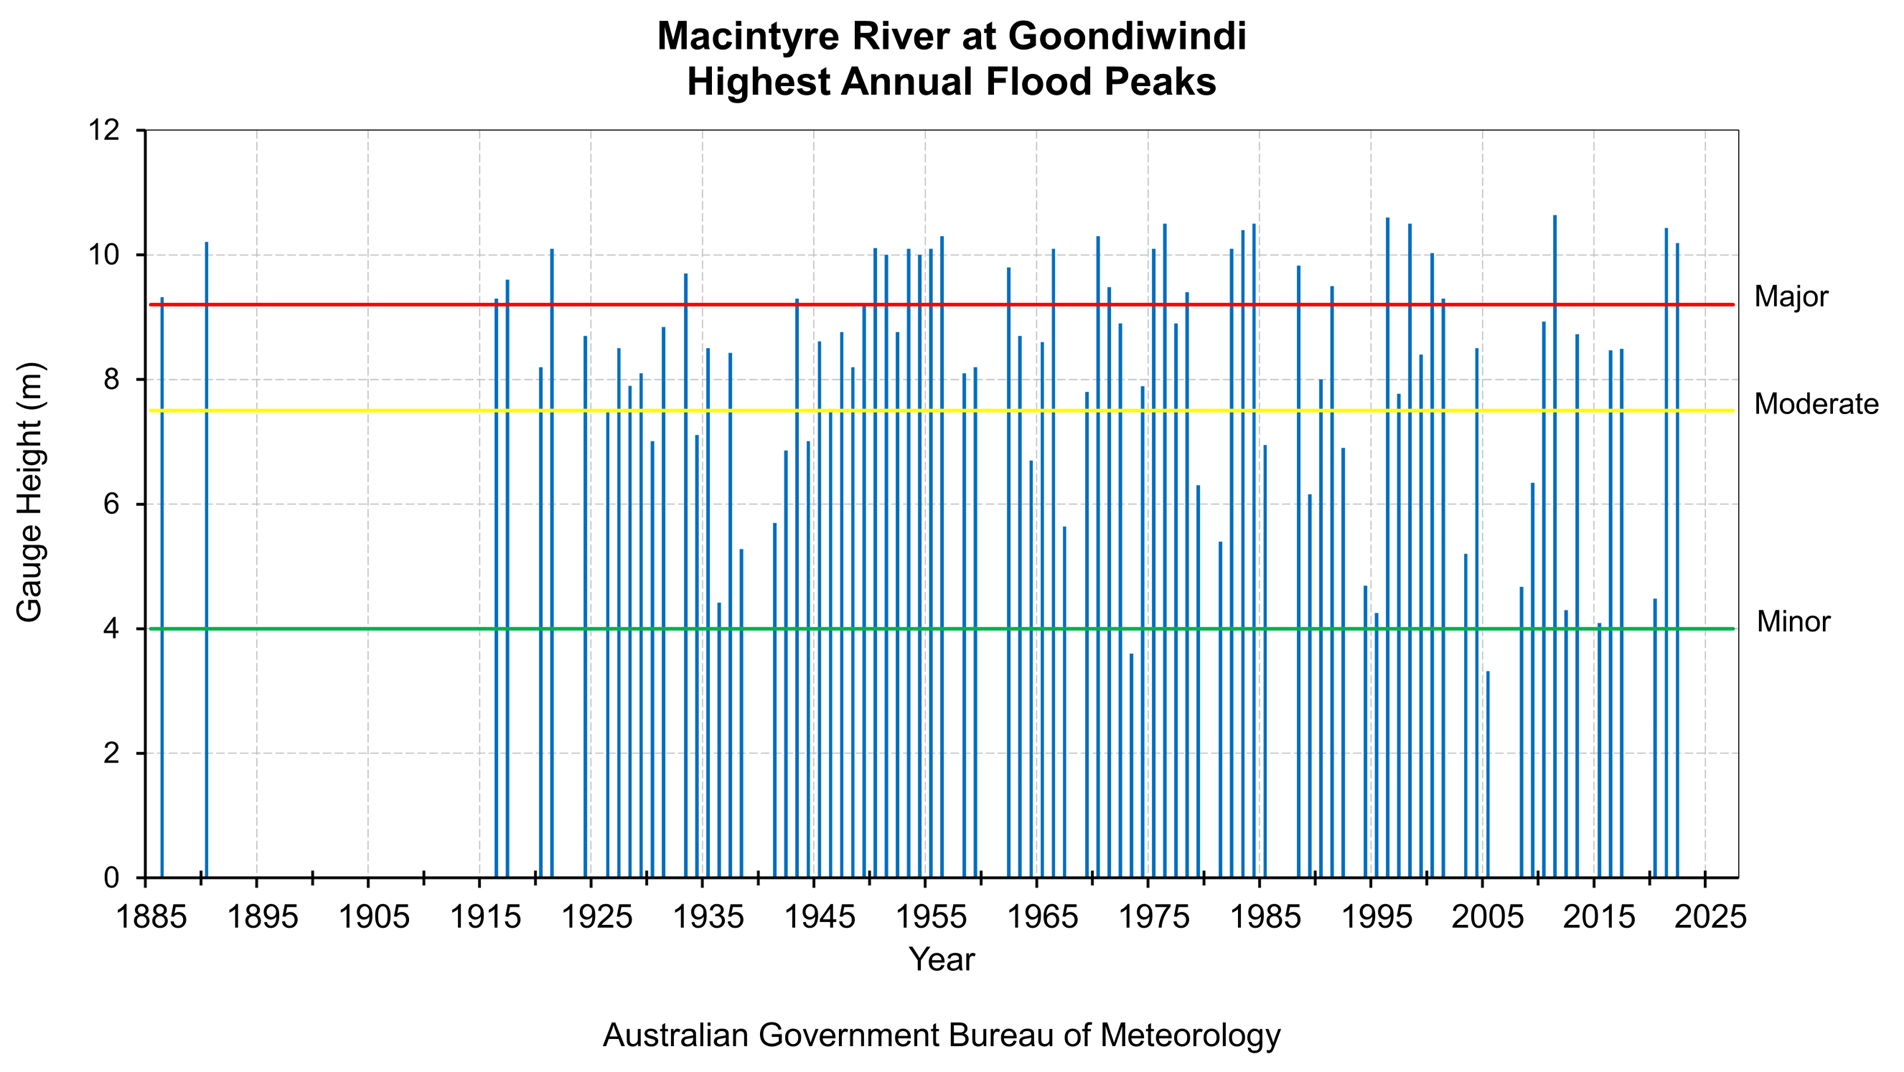
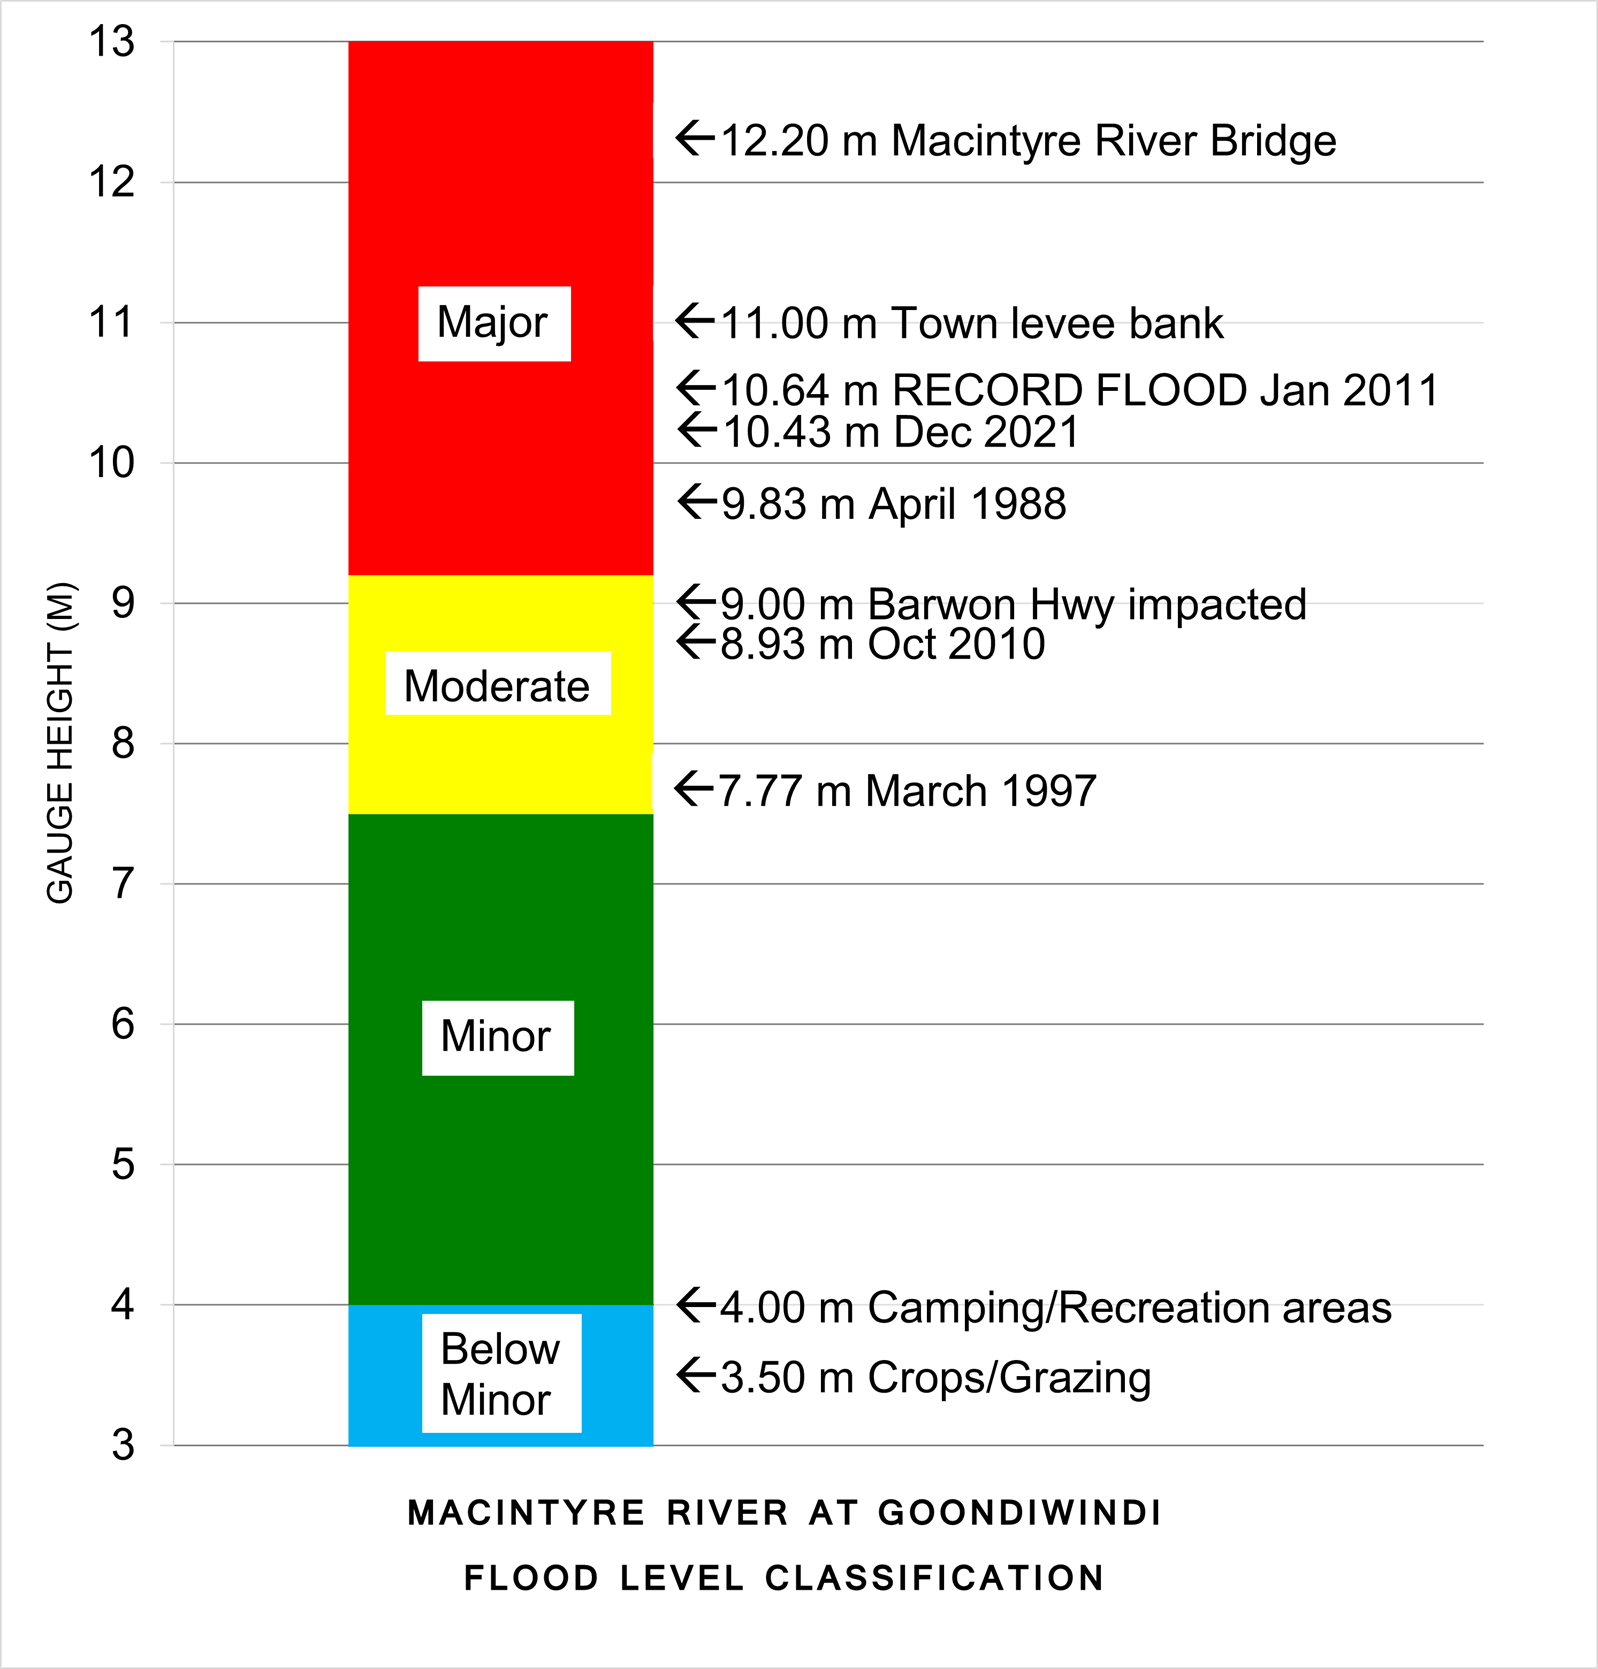
Records of large floods at Goondiwindi extend back as far as 1886, and since then more than 60 major floods have occurred. In 1956, Goondiwindi experienced three major floods within six months which prompted the building of a 11.0 metres levee to protect the town. The 1996 flood of 10.6 metres stood as the Goondiwindi record flood until January 2011 when the Macintyre River reached 10.64 metres.
Significant flood events of note in the 21st century include 2000, 2001, 2011, 2021, 2022.
More recently in 2021 and 2022, three separate major flood events occurred on the Macintyre River. Significant rain events during 2021 resulted in a flood peak of 10.34 metres at Goondiwindi in March, followed by a slightly higher peak of 10.43 metres in December. Another significant rain event during October 2022 culminated in a lower flood peak of 10.19 metres at Goondiwindi.
The table below summarises the flood history of the Macintyre and Weir River catchment - it contains the flood gauge heights of the more significant recent floods.
| Flood Event | Talwood | Texas | Inglewood | Goondiwindi |
| Jan/Feb 1956 | - | 10.11* | 12.50* | 10.30 |
| Feb 1976 | 4.74 | 10.80 | 11.73* | 10.50 |
| Apr 1988 | 4.85 | - | 10.50 | 9.83 |
| Jan 1996 | 4.22 | 7.40 | 9.80* | 10.60 |
| Jul/Aug 1998 | 4.36 | 7.10 | 9.15* | 10.48 |
| Jan 2011 | 3.97 | 9.21 | 9.15* | 10.64 |
| Jan 2013 | 4.70 | 5.20 | 4.37* | 8.73 |
| Mar/Apr 2021 | 3.90 | 8.43 | 5.90 | 10.34 |
| Nov/Dec 2021 | 4.41 | 8.68 | 11.14 | 10.43 |
| Oct/Nov 2022 | - | 6.08 | 5.45 | 10.19 |
All heights are in metres on flood gauges.
Further Information:
- Latest rainfall and river heights
- For information on the flood warning service for the Macintyre and Weir River: Queensland Service Level Specification
- Macintyre/Weir Catchment map: Queensland Border Rivers map
- National Arrangements for Flood Forecasting and Warning
- Goondiwindi Flood Factsheet Dec 2010 Jan 2011
- Stanthorpe Flood Factsheet Dec 2010 Jan 2011
- Texas Flood Factsheet Dec 2010 Jan 2011