


This brochure describes the flood risk and previous flooding in the
Brisbane/Stanley River catchment, last updated in August 2025.
Flood Risk
The upper Brisbane River catchment above Wivenhoe Dam drains an area of approximately 7,000 square kilometres. The Brisbane River rises in the Brisbane Range which is located about 40 kilometres east of Kingaroy. Major tributaries of the upper Brisbane River include Cooyar, Emu, and Cressbrook Creeks which all enter the river from the west and travel in a southeast direction, eventually passing through into Wivenhoe Dam. On the coastal side of the catchment, its major tributary, the Stanley River, rises in the Conondale Ranges southeast of Maleny and travels in a southwest direction through one of the heaviest rainfall areas in Australia into Somerset Dam and then into Wivenhoe Dam.
Heavy rains in the upper reaches of the Brisbane River, particularly the Stanley River catchment, may result in significant local flooding of low-lying areas. Both Somerset Dam (completed in 1959) and Wivenhoe Dam (completed in 1984) have significantly reduced the frequency of flooding in the lower Brisbane River catchment to Brisbane City, though major flooding can still occur from local area run-off.
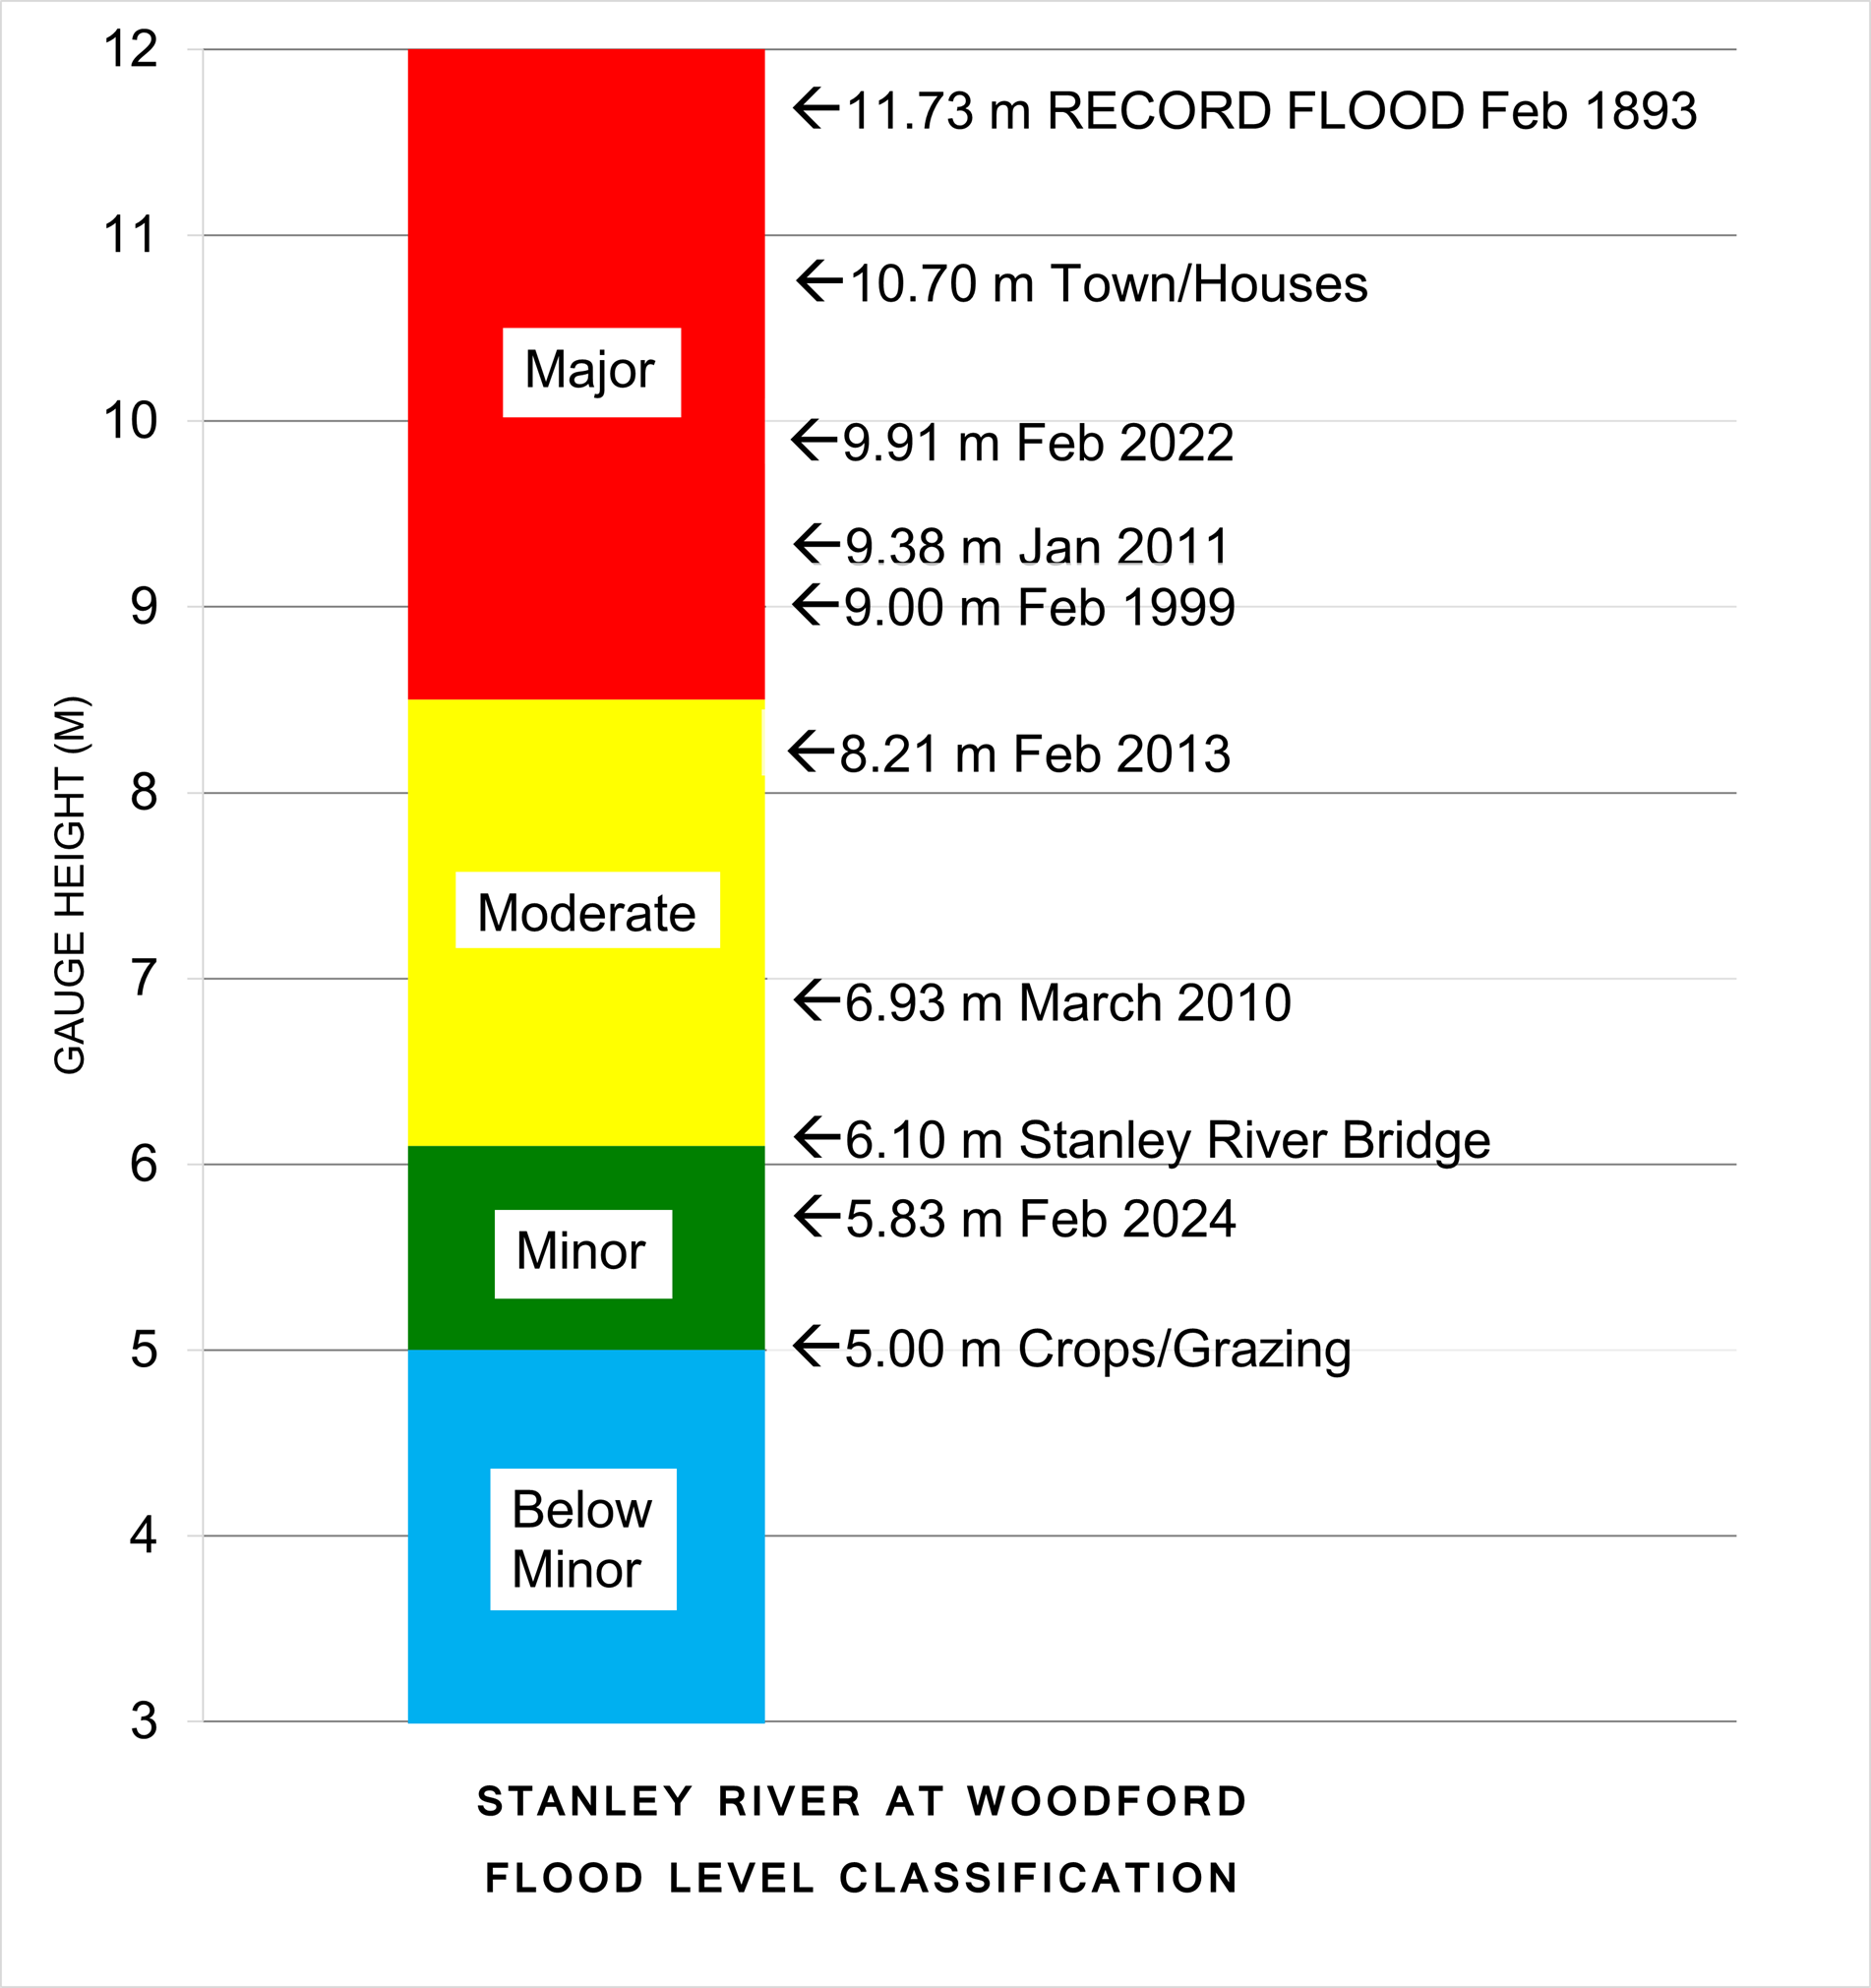
Previous Flooding
Flood records for most river height recording stations in the upper reaches of the Brisbane River are extensive, with records for Woodford dating back to the 1890's. Significant floods include 1893, 1974, 2011, and 2022.
The record major flood of 1893 in Brisbane was a result of extremely heavy rainfall falling in the upper reaches of the Stanley River around Peachester. This event occurred well before the completion of Somerset Dam in 1959 and Wivenhoe Dam in 1984.
In 1974, persistent monsoonal rains occurred across much of Queensland during January. Rainfall associated with Tropical Cyclone Wanda saturated the Brisbane River catchment in late January 1974. This, in combination with continued rainfall after the weakening of Wanda over land, resulted in major flooding in the Upper Stanley River and then in the Bremer, Brisbane River, and Lockyer Creek. At Woodford, the recorded flood peak was 8.6 m on 25 January 1974.
In 2011, heavy to intense rainfall over Southeast Queensland between 9 January and 12 January eventuated due to a moist tropical airstream combining with potently unstable atmospheric conditions. This followed very much above average to highest on record rainfall during December 2010, and led to extreme river level rises and large-scale inundation of residential and agricultural areas throughout the Brisbane Valley.
In 2022, extreme and record-breaking multi-day rainfall across Southeast Queensland and northeast New South Wales resulted in the last week of February being the wettest week for these areas since at least 1900. This was driven by a combination of weather systems including a slow-moving high-pressure system to the southeast of Australia that maintained a humid onshore airflow into a persistent trough along the east coast of Australia. Extreme flash and riverine flooding occurred as a result, from Maryborough in Queensland to Grafton in New South Wales.
At Gregor Creek in the upper Brisbane River catchment, the river level reached 12.48 m at 8:16 am on 27 February 2022 and the highest flood peak on record of 14.56 m occurred on 9 January 2011. Official Records started at this location in 1962.
At Woodford, the Stanley River reached 9.77 m at 5:00 pm on 26 February 2022, exceeding the peak of 9.38 m recorded on 11 January 2011. The highest flood peak on record is 11.73 m in February 1893.
In March 2025, rainfall associated with ex-tropical cyclone Alfred was concentrated over the lower Brisbane river catchment, with the Stanley River at Woodford peaking at only 6.73 m with moderate flooding.
| Flood Event | Woodford (m) | Gregor Creek (m) |
| Feb 1893 | 11.73* | 17.98* |
| Jan 1898 | 10.29* | - |
| Jan 1974 | 8.60* | 14.45 |
| Feb 1999 | 9.00* | 14.53 |
| Jan 2011 | 9.38 | 14.56 |
| Jan 2013 | 7.89 | 11.14 |
| Mar 2017 | 6.08 | - |
| Feb 2022 | 9.77 | 12.48 |
| Mar 2025 | 6.73 | 2.16 |
All heights are in metres on flood gauges.
[*] Height has been observed from the manual station.

Further Information:
- Latest rainfall and river heights
- For information on the flood warning service for the Upper Brisbane and Stanley Rivers: Queensland Service Level Specification
- Catchment map: Queensland Brisbane Basin map
- National Arrangements for Flood Forecasting and Warning