


This brochure describes the flood risk and previous flooding in the Logan/Albert
River catchment, last updated in August 2025.
Flood Risk
The Logan and Albert River catchment has a catchment area of approximately 3850 square kilometres and lies in the southeast corner of Queensland. The catchment extends from the Logan City-Beenleigh area in the north to the McPherson Ranges in the south on the Queensland-NSW border. The major tributaries are the Albert River and Teviot Brook. Smaller tributaries include Running, Christmas, Burnett, and Canungra Creeks in the headwaters. Major flooding is experienced in both rural and urban areas of the catchment although major flooding in the upper part of the catchment does not necessarily result in significant flooding in the lower catchment.
Scrubby and Slacks creeks in the lower reaches of the Logan River can be subject to flash flooding as well as backwater flooding during major river flood events.
Headwater tributaries and creeks exhibit flash flooding behaviour owing to the steep topography in the area during short duration high intensity rainfall. Flooding in the lower reaches of the catchment is slower, with peaks taking several days to move through the system.
Moogerah and Wyaralong Dams work to reduce the peak height of floods downstream of these locations, particularly if dam levels are low preceding rainfall.
Both rivers present a very high flood risk to many urbanised areas, particularly the lower catchment with Logan and Beenleigh seeing significant inundation of property during major flood events, with increasing urban development increasing the exposure to flooding in recent years. Many residences are affected by backwater flooding from the small tributaries in the lower reaches of the Logan River. Significant disruption to transport occurs through more rural areas during flood events, with key roads often cut off, and isolation of towns occurring.
Typically 200-300mm catchment average rainfall in 24 hours across the catchments would result in significant flooding.
Previous Flooding
Significant flood events of note include 1887, 1947, 1974, 2013, 2017, 2022 and 2025. The Albert River has a long history of flooding with flood records extending back to the 1920’s at the Bromfleet river height station and the Logan River flood records extend back to 1887.
The main flood problem in the Boonah and Beaudesert areas in past floods has been the closure of low-level bridges and roads.
Significant rainfall affected south-eastern Queensland, including the Logan-Albert Rivers catchment, between late February and early March 2022, resulting from a combination of weather systems. The Logan City Council area had 197 properties damaged during the event, including 35 residential properties and one commercial property experiencing severe damage. The Scenic Rim Regional Council area had 15 properties damaged during the event, including two residential properties which were severely damaged. Transport routes were significantly impacted by the event, with many schools also closed.
Flooding along the Logan River was the most significant since 1974 (peaking along the lower Logan River above levels observed during ex-TC Debbie in 2017), and the most significant since 2017 along the Albert River (where peaks were between those observed during the 2013 TC Oswald event and the 2017 TC Debbie event). Major flood levels were reached at all forecast locations within the Logan and Albert River catchments.
More recently in March 2025, widespread heavy to locally intense rainfall from Tropical Cyclone Alfred resulted in moderate to major flooding across the catchment. Wolffdene Alert recorded a 24-hour rainfall total of 289 mm to 9am on Monday 10th of March. This was a March daily rainfall record for this particular site, with data dating back for 25 years. However, observed flood peak heights were generally much lower than those experienced during the March 2022 flood event. The tables below summarise the flood history of the Logan and Albert River catchments - it contains the flood gauge heights of the more significant floods.
Logan River
| Flood Event | Boonah (m) | Beaudesert (m) | Maclean Bridge (m) | Waterford (m) | Eagleby (m) | Parklands (m) |
| Jan 1887 | - | - | 22.30 | 13.70 | 7.58* | - |
| Jan 1947 | - | - | 20.73 | 12.18 | - | - |
| Jan 1974 | - | - | 21.22 | 12.95* | 7.25* | - |
| Feb 1976 | 8.16 | - | 18.35 | 10.00* | 5.28* | - |
| Feb 1991 | 8.50 | - | 18.55 | 9.06 | 5.00 | - |
| Jan 2011 | 7.20 | 6.64 | 15.65 | 7.06 | - | - |
| Jan 2013 | 7.25 | - | 18.39 | 9.05 | 4.70 | - |
| Mar 2017 | 7.60 | 14.76 | 20.66 | 10.50 | - | 6.19 |
| Feb/Mar 2022 | 7.85 | 13.62 | 20.67 | 11.15 | - | 6.64 |
| Mar 2025^ | 7.25 | 10.72 | 15.29 | 7.49 | - | 4.99 |
Albert River
| Flood Event | Bromfleet (m) | Wolffdene (m) | Beenleigh (m) |
| Jan 1887 | - | - | 8.10 |
| Jan 1947 | 16.00 | - | 6.40 |
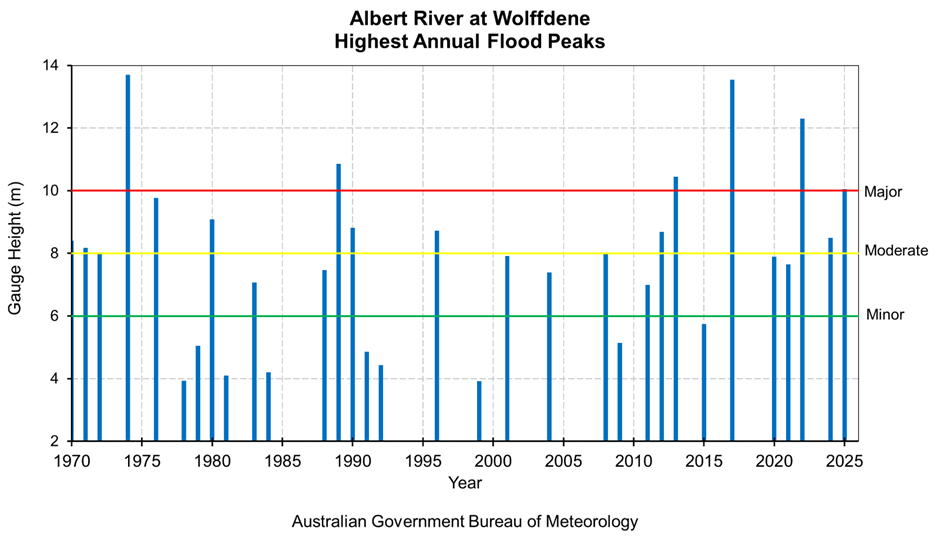
| Jan 1974 | 16.36 | 13.70 | 8.04 |
| Feb 1976 | 14.88 | 9.77 | - |
| Feb 1991 | 9.53 | 4.86 | - |
| Jan 2011 | 11.82 | 6.99 | - |
| Jan 2013 | 15.71 | 10.45 | 6.20 |
| Mar 2017 | 17.41 | 13.55 | 8.02 |
| Feb/Mar 2022 | 16.51 | 12.30 | 7.47 |
| Mar 2025^ | 15.04 | 10.05 | 6.02 |
All heights are in metres on flood gauges.
*Estimated peak flood heights from flood marks and other information.
#The Parklands automatic gauge was installed in late 2013 and replaced the Eagleby site. ^Preliminary values subject to quality control


Further Information:
- Latest rainfall and river heights
- For information on the flood warning service for the Logan and Albert River: Queensland Service Level Specification
- Catchment map: Queensland Logan-Albert map
- National Arrangements for Flood Forecasting and Warning