


This brochure describes the flood risk and previous flooding in the Maroochy/Mooloolah
River catchment, last updated in August 2025.
Flood Risk
The Maroochy River basin has a catchment area of 630 square kilometres and is located on the Sunshine Coast. The catchment lies on the eastern side of the Blackall Ranges and is bounded in the south by the Buderim Mountain divide between the Maroochy and Mooloolah Rivers, and in the north by a lowland divide between the Maroochy and Noosa River flood plains. The North and South Maroochy Rivers join downstream of Yandina, before flowing east and flowing into the sea at Cotton Tree. The Maroochy River is joined by a number of smaller tributaries, including Petrie Creek that flows through Nambour, Paynter Creek that passes through Palmwoods and Diddillibah, Eudlo Creek that passes through Eudlo and Doonan Creek which passes through swamp land west of Coolum.
The Mooloolah River system drains a relatively small catchment with an area of 196 square kilometres that extends 25 kilometres inland from the coast. It flows east-northeast from the Blackall Range, discharging to the sea between Mooloolaba and Point Cartwright. The catchments also include some smaller waterways that flow directly to the sea, most notably Currimundi Creek and Coochin Creek. In flood events, flow breaks out from the Mooloolah River upstream of Palmview and moves into Currimundi Creek.
The Maroochy and Mooloolah River systems are susceptible to episodes of rapid flooding which can cause considerable damage to public and private property throughout the catchment. Continuing increases in population have accentuated the potential flood risk to life and property.
Flash flooding is a common occurrence across the Sunshine Coast region due to many small creeks draining in the hinterland. Many have catchment areas less than 100 km² and may cause considerable damage to public and private property during floods. Areas at risk include Eumundi, Kiamba, Yandina, Doonan, Coolum West, Warana Bridge, Palmwoods, and Eudlo in the Maroochy catchment, and Mooloolah, Tanawha, and Mountain Creek in the Mooloolah catchment.
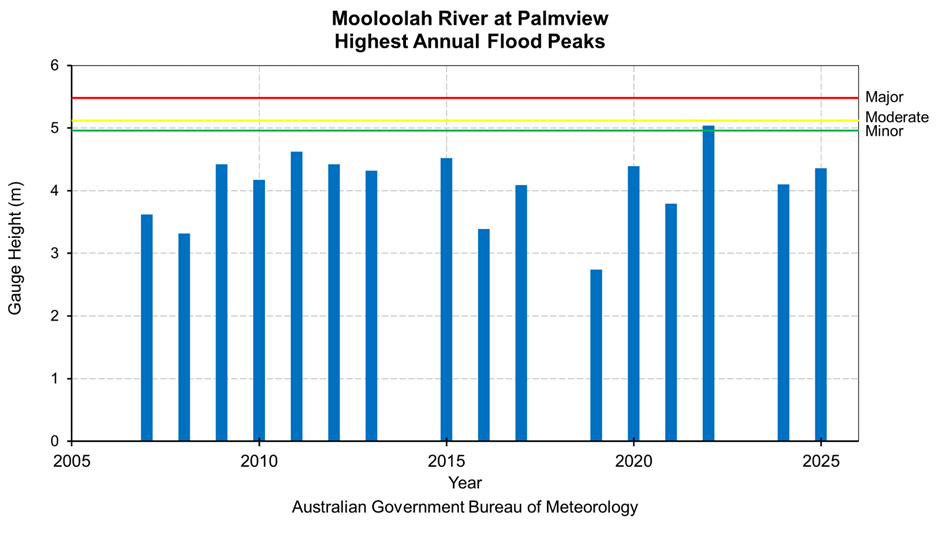
The flat coastal plain areas generally tend to experience longer duration flooding compared to the upper headwaters in the Sunshine Coast hinterland. Tidal impacts are apparent across the downstream end of the catchments, with river height peaks at Picnic Point usually coinciding with the high tide. At Palmview (Mooloolah River) the tide is usually drowned out once the river is above 2 metres. Storm surge is also another major risk factor for flooding in the lower catchments.
Previous Flooding
Records dating back to 1893 indicate that major flooding has occurred often in the Maroochy River. Significant flood events were reported in 1893, 1951, 1974, 1992, 2011 and 2022. During the 1992 event, flash flooding occurred in the smaller streams early on Friday 21st February, particularly in the area upstream of the Bruce Highway. At that stage, the main impact was the closure of several low-level roads. By late Saturday 22nd, flooding in the lower reaches of the system caused inundation of about 225 homes to depths of up to 80 centimetres. The worst affected area was Pacific Paradise, adjacent to the mouth of the Maroochy River.
In 2022, significant rainfall affected south-eastern Queensland, including the Sunshine Coast region, between late February and early March, resulting from a combination of weather systems. A low-pressure trough developed along Australia’s east coast and deepened on 24 February. This trough drew further moisture into the coast and the moist air collecting within this trough was lifted to form rain and storms. The presence of the blocking high pressure system to its east prevented it from moving away, causing it to stall near the coast and persist until 28 February. Rainfall was widespread and sustained over almost a week across the Sunshine Coast region from overnight 22–23 February. Observed rainfall totals across the region for the period 22 February – 5 March ranged from 594 mm to 961 mm and culminated in a record catchment-wide average of 879.9 mm.
Major Flood Warnings for the Maroochy River began on the morning of 26 February. The Sunshine Coast region, including the Maroochy and Mooloolah rivers, experienced what was generally its most significant flooding since January 2013. Major flooding occurred along the Mooloolah River at Palmview. The Sunshine Coast Council area had a total of 154 properties damaged, including six residential properties severely damaged. Significant travel disruption resulted from the event, with many schools also closed.
The flooding along the Sunshine Coast rivers was generally the most significant since the January 2013 event but did not reach the heights of the largest flood in recent memory (February 1992). At the inland locations of Dunethin Rock (Maroochy River) and Palmview (Mooloolah River), flood peaks were reached on 26 February, at 3.46 m (minor flooding) and 5.04 m (major flooding) respectively. The flood peak at Palmview of 5.04 m was the highest since records began in 2003, though this is a comparatively short record. At the coastal location of Picnic Point (Maroochy River), the highest levels were reached slightly later on 27 February (1.61 m – moderate flooding).
The table below summarises the flood history of the Maroochy and Mooloolah River catchments – it contains the flood gauge heights of some of the more historically significant flood peaks.
The following table summarises flood gauge heights recorded at key locations within the Maroochy and Mooloolah River catchments. These records reflect some of the more historically significant flood peaks across the Sunshine Coast region.
| Flood Event | Yandina (m) | Eumundi (m) | Warana Bridge (Nambour) (m) | Dunethin Rock (m) | Picnic Point (m) | Mooloolah (m) | Palmview (m) |
| Jun 1983 | 5.15 | 6.75 | 9.31 | 2.30 | 1.50 | 5.63 | - |
| Apr 1989 | 4.01 | 7.29 | 7.05 | - | - | 5.83 | - |
| Feb 1992 | 4.27 | 7.12 | 8.22 | 4.40 | 1.95 | 5.78 | - |
| Feb 1999 | 4.03 | 7.05 | 7.19 | 3.65 | 1.61 | 5.70 | - |
| Jun 2008 | 3.47 | 6.78 | 6.88 | 2.35 | 1.27 | 5.23 | 3.22 |
| Jan 2011 | 3.58 | 6.77 | 6.64 | 3.00 | 1.03 | 5.76 | 4.62 |
| Jan 2012 | 3.34 | 4.52 | 7.89 | 2.35 | 1.27 | 5.46 | - |
| Jan 2013 | 3.99 | 6.73 | 7.54 | 3.05 | 1.60 | 5.45 | 4.32 |
| May 2015 | 3.42 | 4.68 | 7.12 | - | - | 5.65 | 4.19 |
| Feb 2022 | 4.52 | 7.10 | 7.39 | 3.46 | 1.61 | 5.87 | 5.04 |
| Mar/Apr 2025* | 4.05 | 4.19 | 8.69 | 2.31 | 1.47 | 5.85 | 4.36 |
All heights are in metres on flood gauges.
*Preliminary values subject to verification


Further Information:
- Latest rainfall and river heights
- For information on the flood warning service for the Maroochy and Mooloolah River: Queensland Service Level Specification
- Catchment map: Queensland Maroochy-Mooloolah Rivers map
- National Arrangements for Flood Forecasting and Warning