


This brochure describes the flood risk and previous flooding in the Mulgrave River catchment, last updated in July 2025.
Flood Risk
The Mulgrave and Russell Rivers drain the mountain country dominated by Bellenden Ker and Bartle Frere, Queensland’s highest mountains and the highest rainfall area in Australia. Gordonvale is the only urban area threatened by flooding in the Mulgrave. However, considerable areas of sugar and other crops that occupy the floodplain can be at risk. The catchment area extends over about 440 square kilometres south of Cairns, 25 km south to the Mutchero Inlet. Flooding along the Mulgrave River can also cut the Bruce Highway and the main rail link to the south at Gordonvale.
Previous Flooding
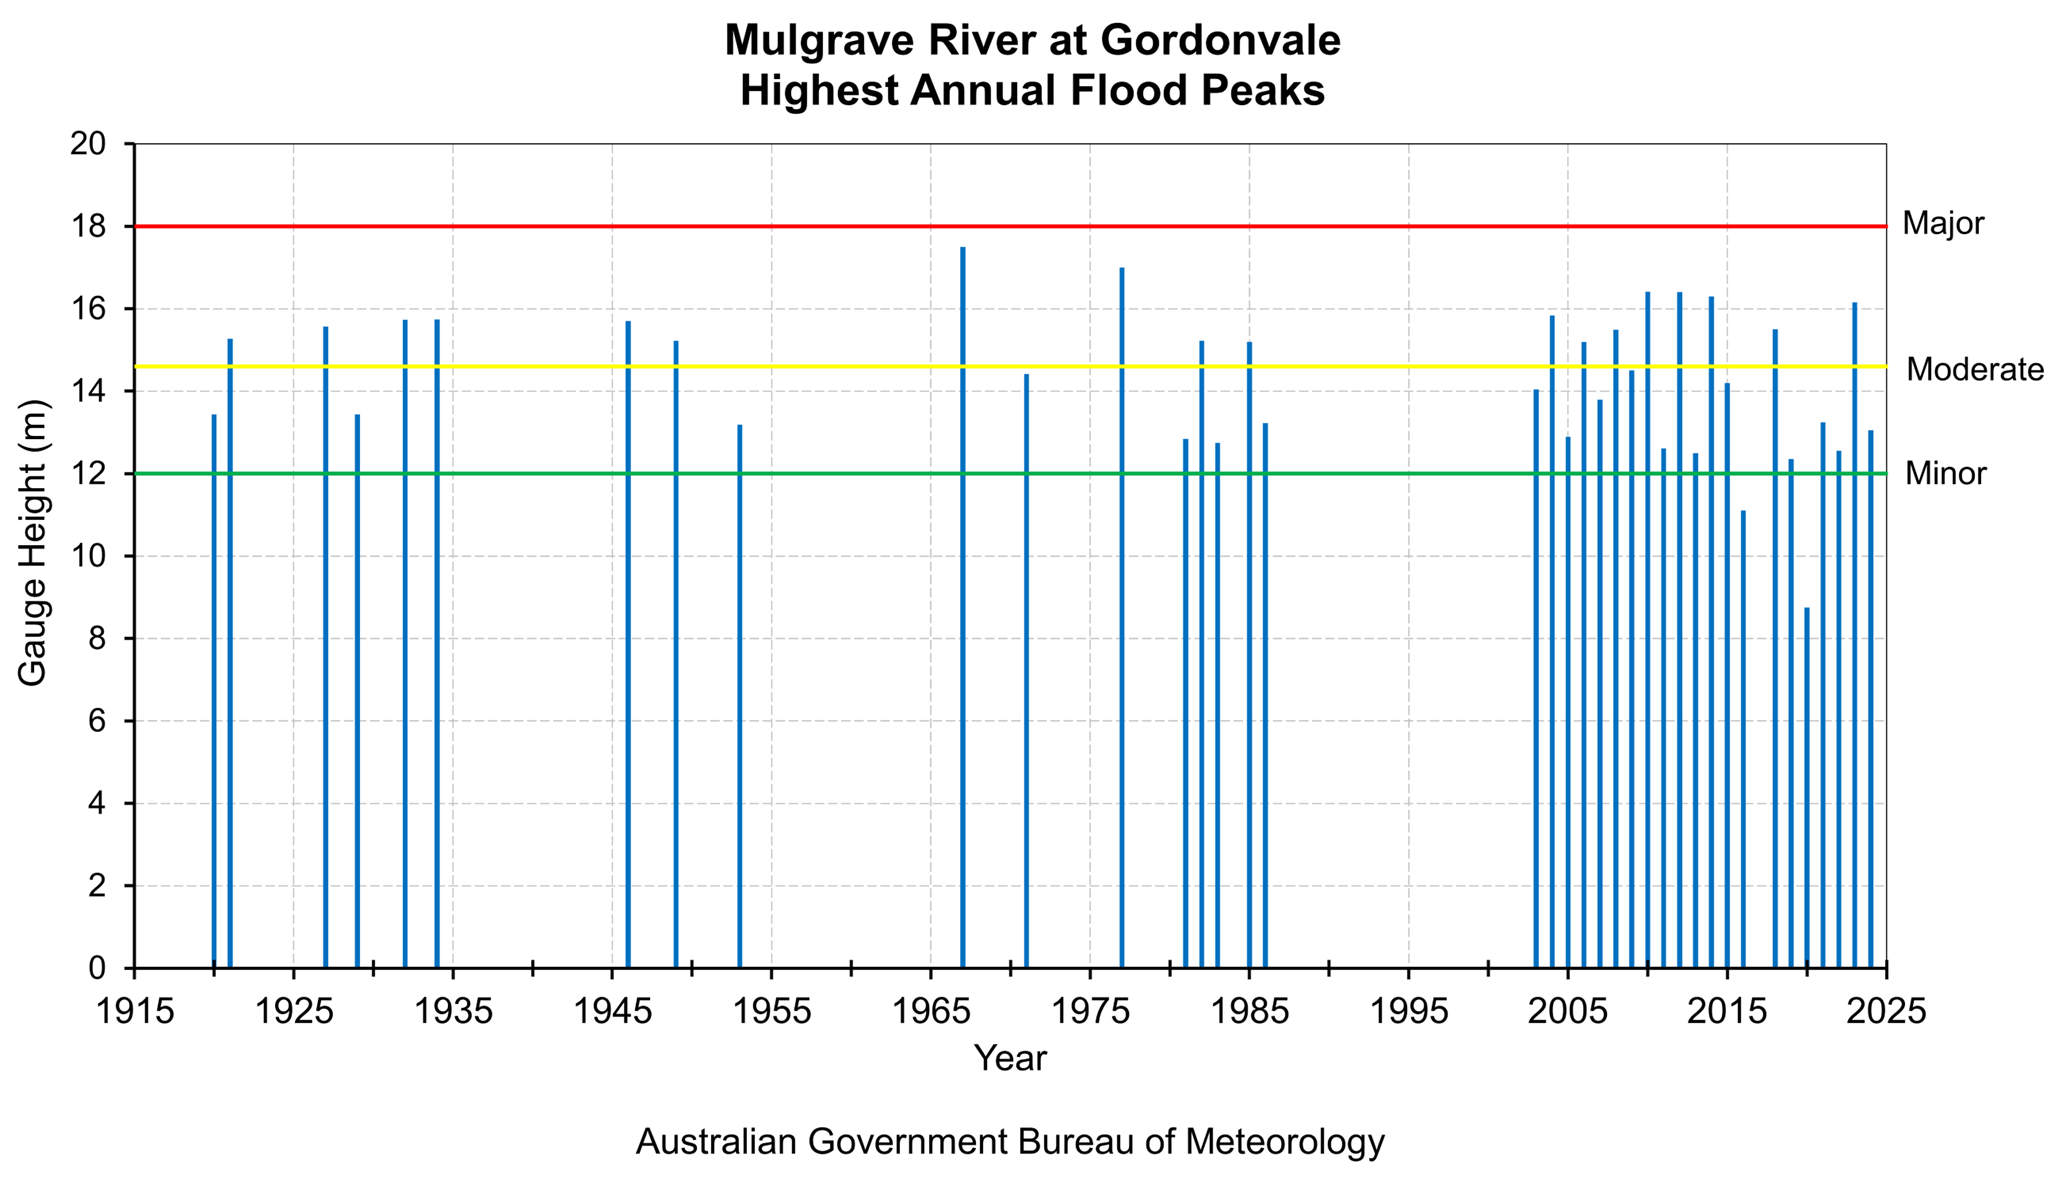
The Mulgrave and Russell Rivers have a well-recorded flood history with documented evidence of flooding beginning in the 1920's. Records at the key reference gauge at Gordonvale show that the largest flood occurred in early 1967. Significant floods include 1967, 1977, December 2010, March 2012, and December 2023.
In 2023, Tropical Cyclone Jasper crossed the North Queensland coast as a Category 2 system on Wednesday evening 13 December near Wujal Wujal, bringing widespread heavy rain. Tropical Cyclone Jasper transitioned to a tropical low after making landfall and then moved slowly west over Cape York Peninsula before becoming near stationary over the northern Gulf Country. Linked to ex-Tropical Cyclone Jasper, a coastal trough developed and brought further widespread heavy to locally intense rainfall across the North Queensland coast.
The Mulgrave River catchment recorded rainfall totals between 862 mm and 1371 mm for the period 13 to 18 December 2023, with the heaviest falls recorded on 16 and 17 December. The Mulgrave River at Peets Bridge and Gordonvale saw multiple peaks between 13 and 17 December.
At Peets Bridge, a Major flood peak of 9.00 m, which was the highest of multiple peaks, was recorded at 4:30 am on 17 December 2023. This was the highest peak flood level since 9.18 m in March 2018. The highest recorded flood peak at Peets Bridge is 10.70 m in 1977.
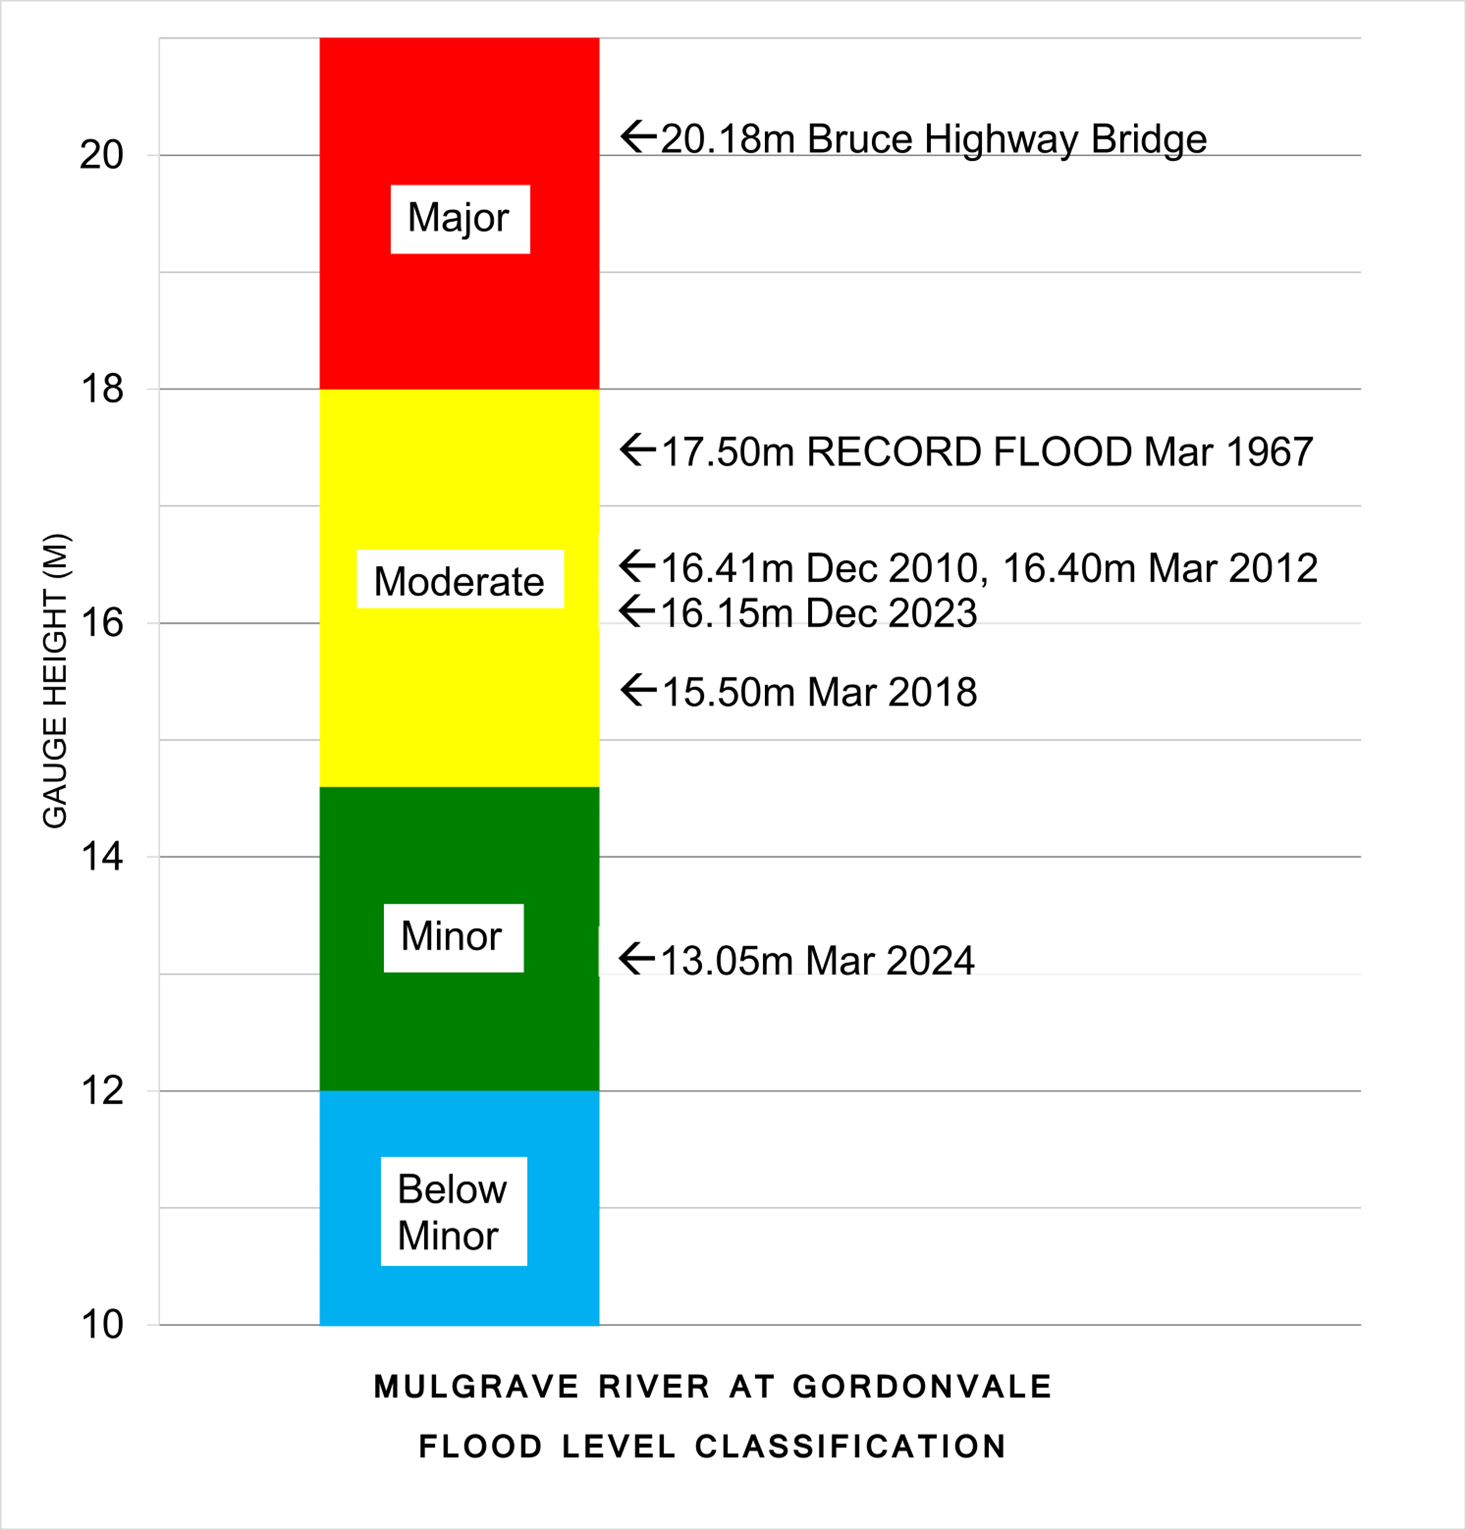
At Gordonvale, a moderate flood peak of 16.15 m was recorded at 4:00 am on 17 December 2023. This was the highest peak flood level since 16.3 m in April 2014. The highest recorded flood peak at Gordonvale is 17.5 m in March 1967.
| Flood Event | Peets Bridge | Gordonvale |
| Mar 1967 | - | 17.5 |
| Feb 1977 | 10.70 | 17.00 |
| December 2010 | 9.75 | 16.41 |
| March 2012 | 9.75 | 16.40 |
| Apr 2014 | 9.60 | 16.30 |
| Mar 2018 | 9.10 | 15.50 |
| Dec 2023 | 9.00 | 16.15 |
Further Information:
- Latest rainfall and river heights
- For information on the flood warning service for the Mulgrave River: Queensland Service Level Specification
- Mulgrave River catchment map: Mulgrave, Mulgrave-Russell map
- National Arrangements for Flood Forecasting and Warning