


This brochure describes the flood risk and previous flooding in the
Norman River catchment, last updated in August 2025.
Flood Risk
The Norman River catchment is located in northwest Queensland and covers an area of approximately 49,000 square kilometres. The river rises in the Gregory Range (Great Dividing Range) 200 kilometres southeast of Croydon and flows in a northwesterly direction. It is joined by its major tributaries, the Clara and Yappar Rivers, near the river height and rainfall station of Yappar River. The river flows through the major town of Normanton, before finally entering the Gulf of Carpentaria through the major fishing port of Karumba. The only other town in the catchment is the old historic gold mining town of Croydon. Floods normally develop in the headwaters of the Norman, Clara and Yappar Rivers, however, general heavy rainfall situations can develop from monsoonal and cyclonic influences causing widespread flooding, particularly in the lower delta country around Normanton and Karumba. Breakout flows are possible into Walkers Creek which impact Karumba access from Normanton and also to/from the Flinders River around Normanton and further upstream around Yappar River.
Previous Flooding
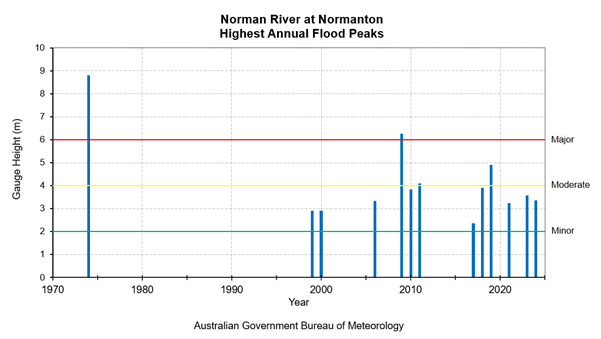
Historic flood information for the Norman River is limited. Peak flood heights are available from the early 1970's, including the more notable major flood events recorded in 1974, 1991 and 2009.
The record major flood of January 1974 and the floods of February 1991 and early February 2009 caused widespread road closures, isolation of communities and the inundation of many properties throughout the catchment.
Significant moderate to major flood events were also recorded in 2011 and 2019. While more recently, moderate flood level events occurred across the catchment in both 2023 and 2024.
The table below summarises the flood history of the Norman River catchment - it contains the flood gauge heights of the more significant recent floods.
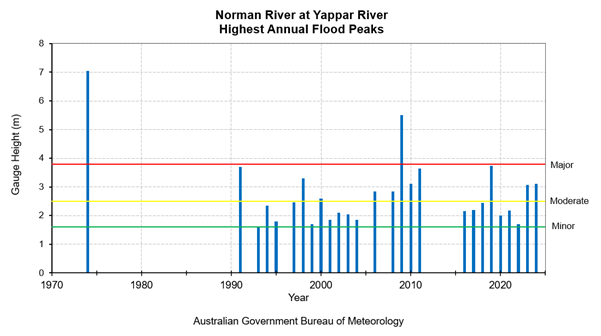
The following table summarises historical flood levels recorded at key locations within the Yappar River catchment, including Glenore Weir and Normanton. These records provide insight into the frequency and severity of flooding events over time.
| Flood Event | Yappar River (m) | Glenore Weir (m) | Normanton (m) |
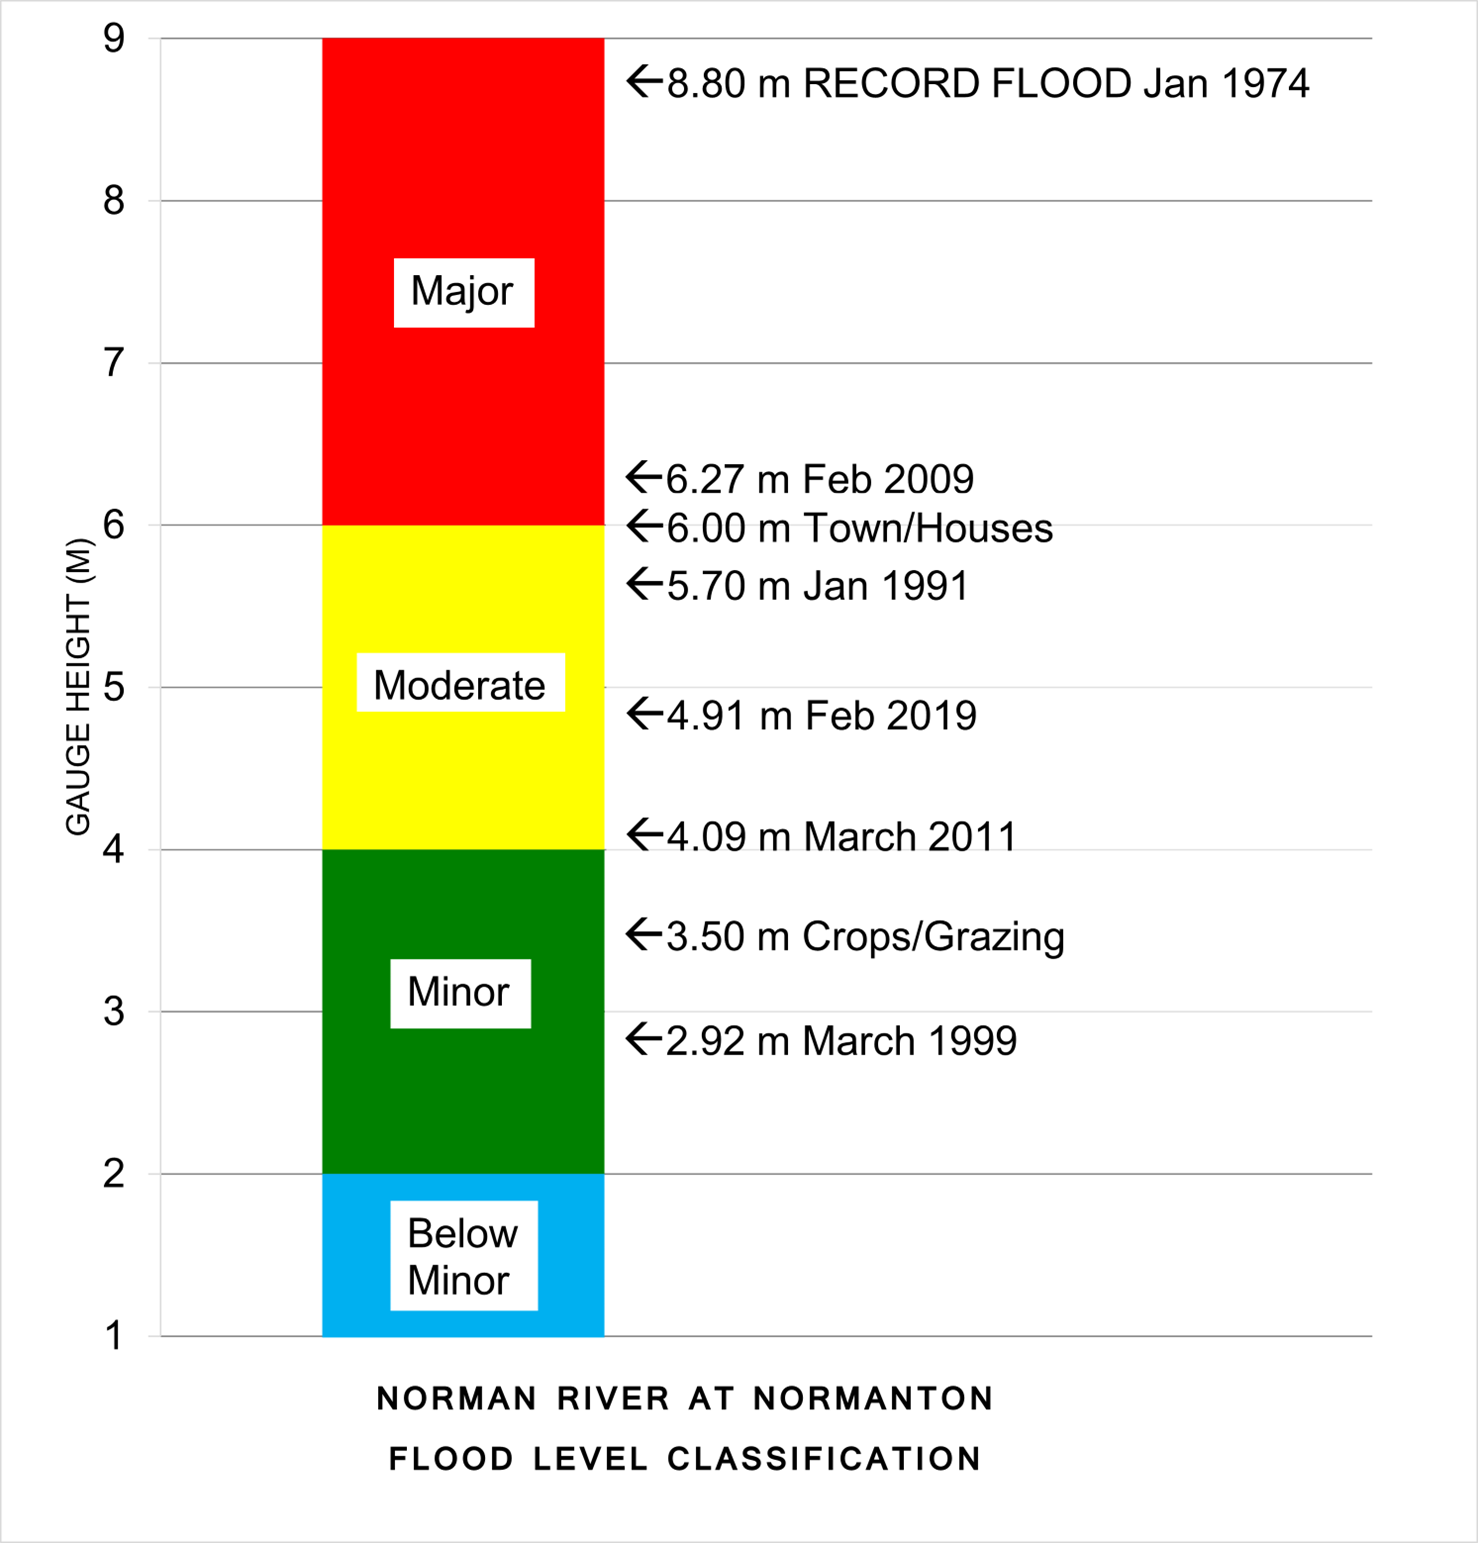
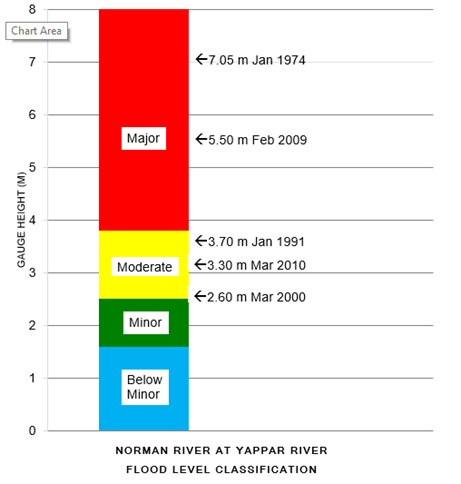
| Jan 1974 | 7.05 | 18.28 | 8.80 |
| Jan 1991 | 3.70 | 14.03 | 5.70 |
| Mar 1998 | 3.30 | 13.14 | 4.98 |
| Mar 2000 | 2.60 | 10.74 | 2.90 |
| Dec 2000 | - | 11.35 | - |
| Feb 2009 | 5.50 | 15.28 | 6.27 |
| Mar 2010 | 3.10 | 12.05 | 3.84 |
| Mar 2011 | 3.65 | 12.40 | 4.09 |
| Feb 2019 | 3.74 | 14.12 | 4.91 |
| Feb 2023 | 3.07 | 12.05 | 3.58 |
| Mar 2024 | 3.10 | 11.82 | 3.37 |
All heights are in metres on flood gauges.
Further Information:
- Latest rainfall and river heights
- For information on the flood warning service for the Norman River: Queensland Service Level Specification
- Catchment map: Queensland Gilbert, Norman Rivers map
- National Arrangements for Flood Forecasting and Warning