


South East Queensland: Supporting information
")
Introduction
The following set of notes provides consolidated reports for each of the water stores and systems within the South East Queensland region during the 2014–15 year. The water stores and systems included in the region are shown in Figure N1.
For more information about the region, please refer to the General description section of the 'Contextual information'.

Figure N1 Water stores and systems within the South East Queensland region
Information on all water flows to and from each water store and system are presented in the following set of notes, including between-store flows and transfers that are not presented in the water accounting statements. The between-store flows and transfers that occur in the region are presented in Figure N2.

Figure N2 Between-store flows that occur within the South East Queensland region
The between-store flows and transfers (Figure N2), which are eliminated from the region's water accounting statements, are shown in italics throughout the following set of notes. The allocation announcement, forfeiture, and allocation remaining items associated with each between-store abstraction (red arrow in Figure N2) are also shown in italics in the following notes.
Surface water store
The South East Queensland region's surface water store comprises:
- storages
- regulated rivers
- unregulated rivers
- lakes and wetlands.
A reconciliation of the surface water Statement of Water Assets and Water Liabilities and Statement of Water Flows is provided in Table N2. Further details on assets, liabilities and flows are provided in the following sections.
Methods used to derive reported volumes can be found in the Quantification approach note.
| 2015 (ML) | 2014 (ML) | |
| Opening surface water store | 2,320,939 | 2,553,648 |
| Inflows | 4,516,341 | 1,865,479 |
| Outflows | (3,824,862) | (1,735,534) |
| Balancing item | (547,231) | (362,654) |
| Closing surface water store | 2,465,187 | 2,320,939 |
| comprises: | ||
| Water assets | 2,465,187 | 2,320,939 |
| Water liabilities | 0 | 0 |
| Net water assets | 2,465,187 | 2,320,939 |
Assets and liabilities
Physical assets
Physical surface water asset volumes in the South East Queensland region at 30 June 2015 were 2,465,187 ML, representing the volume of water held in storages
The volume of water in regulated, unregulated rivers, lakes and wetlands could not be quantified due to a lack of available data; however, the volume of water held in channels and lakes is considered to be relatively small compared to the volume held in storages.
The location of each storage within the South East Queensland region and the volume of water in each storage (including dead storage) as a percentage of total storage capacity at the end of the 2014–15 year is shown in Figure N3.

Figure N3 Percentage-full volume on 30 June 2015 for each storage
Figure N3 shows that all the major storages within the region are above 60% full. The overall storage volume was approximately 95% of total capacity at the end of the 2014–15 compared with 89% in the 2013–14 year. High rainfall and associated streamflow around May (see Climate and water overview) contributed to increased storage levels at 30 June 2015.
Total volume of water within each storage at 30 June 2015, compared with the previous year and the 5-year mean, is given in Figure N4.

Figure N4 Total volume of water in each storage at 30 June 2015 compared with the previous year and the 5-year mean
Figure N4 suggests that many storages, particularly minor ones, actually decreased in storage during the year where as the larger ones all seemed to increase. This may be associated with water distribution and operation of the reservoirs during the 2014–15 year.
Non-physical assets
There are no non-physical surface water assets in the region.
Liabilities
Surface water liabilities in the South East Queensland region refer to the volume of surface water allocation remaining on licence entitlements at the end of the 2014–15 year for:
- individual users—0 ML
- urban water system—0 ML.
The water supply licences for the region have a water management year that ends on 30 June. The portion of surface water allocation that has not been abstracted at the end of the water year is forfeited. Allocation carryover from one water year to the next does not occur in the South East Queensland region. Details are provided in Tables N3–N4.
Previously, the Lower Lockyer water supply scheme (WSS) was operated as an interim resource operations licence (IROL) and the water year was from 1 April–31 March. In June 2014, the Lower Lockyer WSS water year changed to 1 July–30 June when it was included in the Moreton resource operations plan (ROP).
Further information on all entitlements and allocation arrangements are detailed in the Surface water rights note.
| Volume (ML) | |
| Opening balance at 1 July 2014 | 0 |
| Allocation | 71,464 |
| Allocated diversion | (57,124) |
| Adjustment and forfeiture | (14,340) |
| Closing balance at 30 June 2015 | 0 |
| Volume (ML) | |
| Opening balance at 1 July 2014 | 0 |
| Allocation | 447,531 |
| Allocated diversion | (248,658) |
| Adjustment and forfeiture | (198,873) |
| Closing balance at 30 June 2015 | 0 |
Inflows and outflows
A schematic diagram representing all the inflows and outflows associated with the surface water store in the South East Queensland region is provided in Figure N5.

Figure N5 Water inflows and outflows for South East Queensland's surface water store during the 2014–15 year
Surface water inflows
Inflows to surface water increased by 140% during the 2014–15 year compared to the previous year. Total inflows to surface water were 4,516,341 ML and comprised the following:
- Precipitation—203,534 ML
- Runoff—4,288,336 ML
- Discharge: wastewater—19,508 ML
- Discharge: urban supply system—0 ML
- Discharge: user—4,963 ML.
The largest natural water inflow is runoff to surface water (4,288,336 ML). The volume of runoff during the 2014–15 year was approximately 152% higher than the 2013–14 year, which reflects the increase in rainfall compared with the previous year, or conversely the very low rainfall received during 2013–14 (see Climate and water overview). Similarly, precipitation that fell on the major storages (203,534 ML) within the region also increased compared with the previous year.
There are two transfers of water to the surface water store and the largest is the 'Discharge: wastewater' from the urban water system (19,508 ML). This consists of discharges to surface water from the wastewater system, recycled water system and advanced water treatment plants.
The remaining water transfer to the surface water store is the 'discharge: user' (4,963 ML). This volume includes treated wastewater discharge directly to surface water and sea water from industrial and commercial businesses, rather than discharging to urban wastewater collection system.
Surface water outflows
Outflows from surface water increased by 120% during the 2014–15 year compared to the previous year. Total outflows from surface water were 3,824,862 ML and comprised the following:
- Evaporation—387,453 ML
- Outflow—2,852,675 ML
- Leakage: landscape—264,126 ML
- Diversion: statutory rights—3,640 ML
- Allocated diversion: individual users—57,124 ML
- Allocated diversion: urban system—248,658 ML
- Non-allocated diversion: individual users—1,200 ML
- Non-allocated diversion: urban system—2,168 ML
- Other decreases—7,818 ML.
The largest water outflow is the river outflow from the region (2,852,675 ML), which refers to the annual volume of flow from the South East Queensland region rivers to the Pacific Ocean during the 2014–15 year. This outflow is approximately 215% higher than that during the 2013–14 year, which primarily reflects the increase in rainfall compared with the previous year (see Climate and water overview).
The volume of evaporation from surface water storages during 2014–15 year was 387,453 ML. More than 45% of the evaporation from surface water occurred at Wivenhoe storage followed by Somerset storage (20%). Total evaporation during the 2014–15 year was more than 30% higher than that during the 2013–14 year.
The total 'leakage: landscape' volume from surface water storages within the South East Queensland region during the 2014–15 year was 264,126 ML, approximately 6% lower than that in 2013–14.
Additionally 7,818 ML is part of the 10,000 ML Cressbrook Creek resource operations licence (ROL) allocation, and represents an export out of the South East Queensland region to Toowoomba city and surrounds ('other decreases').
'Non-allocated diversion: individual users' represent the volume of water diverted under licences issued for stock and domestic use, riparian entitlements and unsupplemented surface water allocation. In the 2014–15 year, non-allocated diversions: individual users by Queensland Department of Natural Resources and Mines and Seqwater was 1,200 ML.
The diversions from surface water based on unsupplemented entitlements held by urban utilities and the Seqwater for the South East Queensland region in the 2014–15 year was 2,168 ML which was reduced from the previous year due to a reduction in water extraction from Leslie Harrison Dam for the Logan Basin Water Resource Plan (WRP) sub-region. These diversions may be to water treatment plants (WTPs) that supply the SEQ water on-grid or off-grid.
Allocated diversions
Allocated diversion: urban system (248,658 ML) during the 2014–15 year was 5% higher than that during the previous year and this accounts for more than 90% of the total surface water diversion in the South East Queensland region. This volume represents the water diverted from storages to the SEQ water grid system and other areas within the South East Queensland . It includes water diversions by Stanwell Corporation (2,053 ML) and Toowoomba Regional Council (157 ML) to the Crow's Nest area lying within the South East Queensland region. Toowoomba Regional Council controls and operates its own storages and infrastructure and is not part of the SEQ water grid system and only a customer of Seqwater. The diversion to Crow's Nest comes from Cressbrook Creek water supply scheme (WSS).
Additionally there was 277 ML transfered to Green Mountain Ltd for the Coominya Meat Works.
Detail information has been provided in 'Surface water rights' section (refer to Water access and use note).
The volume of water diverted from each WRP area is shown in Figure N6. Approximately 77% of the allocated diversion in the South East Queensland region was within Moreton WRP.

Figure N6 Surface water allocated diversion for urban supply within the South East Queensland region during the 2014–15 year
'Allocated diversion: individual users' during the 2014–15 year was 57,124 ML, higher than that in the previous year due to internal database upgrading that occurred from the merger of SEQ Grid Manager into Seqwater. This allocation accounts for approximately 18% of the total announced allocation.
Surface water balancing item
The calculation of the surface water balance (Table N5) on the surface water store yielded a balancing item of –547,231 ML. This is approximately 12% of the total surface water inflows during the 2014–15 year. The negative balancing item indicates that either the inflows are too high or the outflows are too low.
| Volume (ML) | |
| Opening balance (1 July 2014) | 2,320,939 |
| Total surface water inflows | 4,516,341 |
| Total surface water outflows | (3,824,862) |
| Closing balance (30 June 2015) | (2,465,187) |
| Balancing item | (547,231) |
It is likely that the balancing item volume is primarily attributed to errors associated with the runoff volumes (Runoff to surface water), a large source of surface water increase. The runoff volume is derived from a rainfall–runoff model, and it is reasonable to expect a 10–20% uncertainty around the modelled runoff volume. As a consequence, the modelled runoff is likely to be an overestimate of the volume that actually entered the surface water store.
The surface water balancing item is attributed to uncertainty associated with runoff and river outflow and the volume of river and floodplain losses not being able to be quantified.
Groundwater store
The South East Queensland region's groundwater store has two components:
- water table aquifer
- underlying aquifer.
A reconciliation of the groundwater Statement of Water Assets and Water Liabilities and Statement of Water Flows is provided in Table N6. Further details on assets, liabilities and flows are provided in the following sections.
Methods used to derive reported volumes can be found in the Quantification approach note.
| 2015 (ML) | 2014 (ML) | |
| Opening groundwater store | 9,340 | 9,340 |
| Inflows | 19,629 | 20,021 |
| Outflows | (6,911) | (7,516) |
| Balancing item | (12,718) | (12,505) |
| Closing groundwater store | 9,340 | 9,340 |
| comprises: | ||
| Water assets | 9,340 | 9,340 |
| Water liabilities | 0 | 0 |
| Net water assets | 9,340 | 9,340 |
Assets and liabilities
Physical assets
The aquifers in the South East Queensland region are described in the Water resources section of the 'Contextual information'. The groundwater asset volume for the South East Queensland region represents permissible consumptive volumes for water table aquifers (9,340 ML).
Non-physical assets
There are no non-physical groundwater assets in the region.
Liabilities
Groundwater liabilities in the South East Queensland region refer to the volume of groundwater allocation remaining on licence entitlements at the end of the 2014–15 year for:
- individual users—0 ML
- urban water system—0 ML.
Water liabilities in the South East Queensland region refer to the volume of groundwater allocation remaining on licence entitlements at the end of the 2014–15 year for individual users as shown in Table N7.
Allocation carryover from one water year to the next does not occur in the South East Queensland region. All unused allocation at the end of a water year is forfeited. Therefore, the groundwater allocation remaining is 0 ML.
| Volume (ML) | |
| Opening balance at 1 July 2014 | 0 |
| Allocation | 9,335 |
| Allocation extraction | (2,963) |
| Adjustment and forfeiture | (6,372) |
| Closing balance at 30 June 2015 | 0 |
Inflows and outflows
A schematic diagram representing all the inflows and outflows associated with the groundwater store in the South East Queensland region is provided in Figure N7.

Figure N7 Water inflows and outflows for the groundwater store within the South East Queensland region during the 2014–15 year
Groundwater inflows
Inflows to groundwater decreased by 2% compared to the previous year. The only inflow to aquifers in the South East Queensland region that could be quantified was leakage from the urban water system (19,629 ML). Groundwater movement across the region boundary as well as surface water—groundwater interactions are considered to occur within the region; however, these flows could not be quantified.
Groundwater outflows
Outflows to groundwater decreased by 8% compared to the previous year. Total outflow to groundwater was 6,911 ML and comprised:
- Allocated extractions: individual users (2,963 ML)
- Non–allocated extracations: individual users (3,763 ML)
- Non–allocated extractions: urban system (185 ML).
The entitlement, allocation announcement, and forfeiture for each of these water rights during the 2014–15 year are provided in the Groundwater rights section of the 'Water access and use' note.
Most of the extractions from the groundwater store were benefitted area extractions within the Central Lockyer Valley WSS in the Lockyer Valley groundwater management area (GMA). This allocation extraction (2,963 ML) represents licensed metered groundwater extraction from the benefitted area of the Central Lockyer water supply scheme (WSS) within the Lockyer Valley groundwater management area (GMA).
Non-allocated extraction: individual users (3,763 ML) represents licensed metered groundwater extraction from the following groundwater management areas (GMAs):
Non-allocated extractions: urban system (185 ML) consists of diversions from groundwater based on unsupplemented entitlements held by urban utilities and the Seqwater.
Groundwater balancing item
The groundwater balance (Table N8) yielded a balance of –12,718 ML, approximately 65% of the total groundwater inflows during the 2014–15 year.
| Volume (ML) | |
| Opening balance (1 July 2014) | 9,340 |
| Total groundwater inflows | 19,629 |
| Total groundwater outflows | (6,911) |
| Closing balance (30 June 2015) | (9,340) |
| Balancing item | (12,718) |
The misbalance is due to a number of factors, including the lack of natural groundwater movement data, as well as metering inaccuracies on the extractions.
Urban water system
Urban water assets
South East Queensland's urban water system has three core components:
- Water supply: water treatment, potable and nonpotable water supply and water transfers
- Wastewater: collections, transfers and treatment
- Recycled water supply and advanced water treatment supply.
A reconciliation of the urban water Statement of Water Assets and Water Liabilities and Statement of Water Flows is provided in Table N9. Further details on assets, liabilities and flows are provided in the following sections.
Methods used to derive reported volumes can be found in the Quantification approach note.
| 2015 (ML) | 2014 (ML) | |
| Opening urban water store | 4,951 | 4,149 |
| Inflows | 508,354 | 469,218 |
| Outflows | (498,140) | (472,337) |
| Balancing item | (10,864) | 3,921 |
| Closing urban water store | 3,140 | 4,951 |
| comprises: | ||
| Water assets | 4,301 | 4,951 |
| Water liabilities | 0 | 0 |
| Net water assets | 4,301 | 4,951 |
Assets and liabilities
Physical assets
Physical assets, including water held in pipes, service reservoirs, storage tanks and lagoons, volumes at 30 June 2015 were:
- water supply (3,837 ML)
- wastewater (42 ML)
- recycled water (422 ML).
A 13% decrease in water assets is largely due to changes in reporting: Seqwater reported actual reservoir volumes for this reporting year. Previously Seqwater reported reservoir capacities. Queensland Urban Utilities (QUU) commented that a reduction in the number of water distribution storage facilities has seen a reduction in potable water storage.
Non-physical assets
Non-physical assets in the South East Queensland region are represented by claims on surface water (0 ML).
These claims are equivalent to the volume of surface water allocation remaining for urban water supply licence entitlements at the end of the 2014–15 year. Details are provided in tables N10. Allocated groundwater extraction to the urban water system is not applicable for the region. As there is no carryover in the region, unused water is forfeited and claims at the end of the year end are zero.
Further information on all entitlements and allocation arrangements are detailed in the Water rights section.
| Volume (ML) | |
| Opening balance at 1 July 2014 | 0 |
| Increase in claim | 447,531 |
| Allocated diversion: surface water | (248,658) |
| Decrease in claim | (198,873) |
| Closing balance at 30 June 2015 | 0 |
Liabilities
There are no urban water liabilities in the region.
Inflows and outflows
A schematic diagram representing all the inflows and outflows associated with the urban water system in the South East Queensland region is provided in Figure N8.

Figure N8 Water inflows and outflows for the South East Queensland's urban water system during the 2014–15 year
A detailed breakdown of the inflows and outflows of the urban water system components are provided in the Urban water balance diagram.
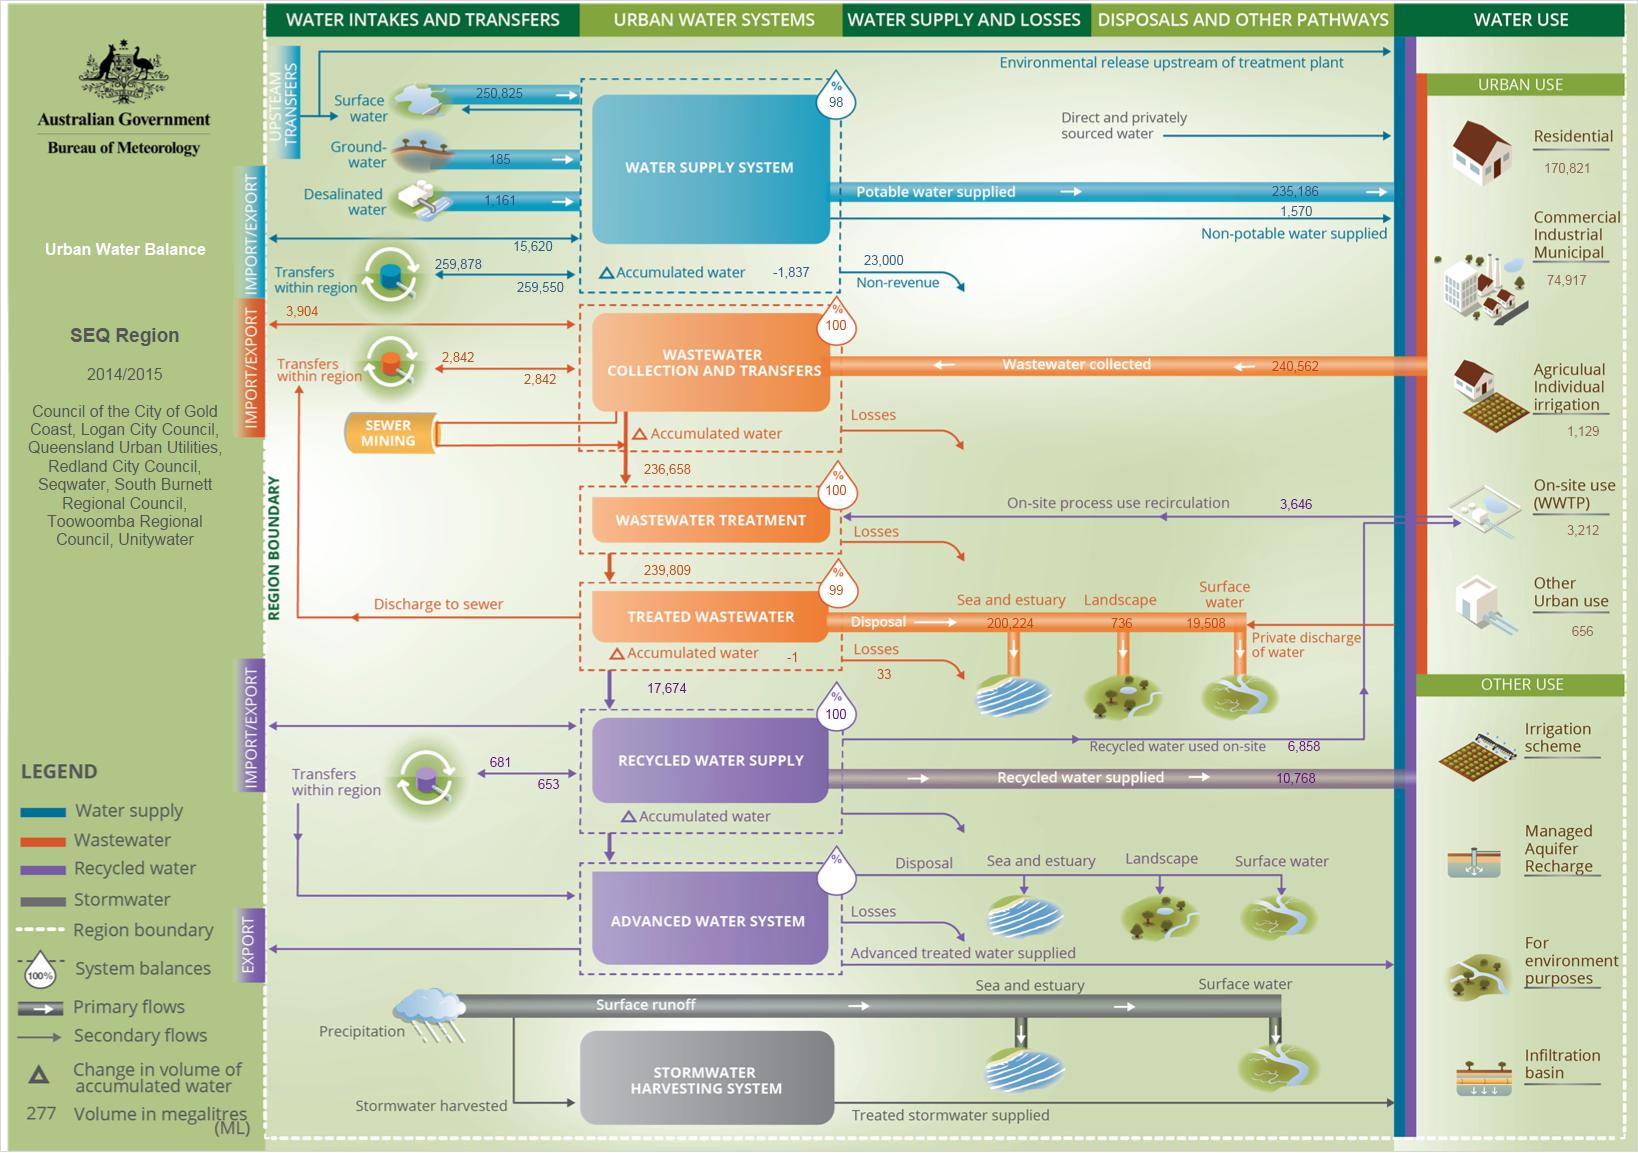
Water supply inflows
Inflows to the water supply system was steady compared to the previous year. Total inflows were 267,792 ML and are sourced from:
- Allocated diversion: surface water—248,658 ML
- Non-allocated diversion: surface water — 2,168 ML
- Non-allocated extraction: groundwater — 185 ML
- Supply system delivery: inter-region—15,620 ML
- Delivery: desalinated water—1,161ML.
The South East Queensland urban water supply system (SEQ water grid), is the infrastructure network of two-way pipes that connects water storages, weirs, WTPs, groundwater bore fields and the Gold Coast desalination plant (Tugun Desalination Plant) across the region.
Seqwater operates the storages and SEQ water grid in the region, which supplies water to QUU, Logan City Council, Redland City Council, Unitywater and Council of the City of Gold Coast. Some of these WTPs are connected to the SEQ water grid and some only supply local reticulation networks.
The SEQ water grid also extends outside the South East Queensland region boundary and therefore imports and exports of water occur in the South East Queensland account. Important imports to note are the Eastern Pipeline Interceptor, which sources surface water and groundwater from North Stradbroke Island within the Redland City Council operational area and the Northern Pipeline Interceptor that extends to the Sunshine Coast. There are also minor imports from the neighbouring Toowoomba Region Council to the Preston community which is located within QUU operational area. Desalinated water from the Gold Coast desalination plant feeds directly into the SEQ water grid.
The water supply to urban water system from different sources is shown in Figure N9.

Figure N9 Water sources used in South East Queensland's urban water system during the 2014–15 year compared with the previous year and the 5-year average
Allocated and non-allocated surface water diversion to the urban water system (250,826 ML) is the South East Queensland region’s primary source of water for urban water supply and comprised approximately 94% of the inflows to the system during the 2014–15 year (Figure N11). This includes 2,168 ML of 'Non-allocated diversion: surface water' which was reduced from the previous year by approximately 43% due to a reduction in water extraction from Leslie Harrison reservoir for the Logan Basin WRP subregion.
'Supply system delivery: inter region' volume (15,620 ML) refers to water imported via the Northern Pipeline Interconnector (6,993 ML), water delivered via the Eastern Pipeline Interconnector from North Stradbroke Island (8,535 ML), and supply to the Yarraman WTP operations (92 ML) from Boyne River by neighbouring Toowoomba Regional Council. 'Supply system delivery: inter region' contributed 6% of urban water supply, which refers to water imported through the Northern Interconnector Pipeline.
'Delivery: desalinated water' was supplied from the Tugun Desalination Plant (1,161 ML) that contributed less than 1% of urban water supply in this reporting year.
Further information on supply system inflows is available in the Supply inflows table.
Wastewater and recycled water inflows
The wastewater in the region is collected (240,562 ML) and treated within wastewater treatment plants (WWTPs) operated by utilities:
- Council of the City of Gold Coast—58,613 ML
- Logan City Council—20,829 ML
- Queensland Urban Utilities —122,184 ML
- Redland City Council—11,283 ML
- South Burnett Regional Council—35 ML
- Toowoomba Regional Council—128 ML
- Unitywater—27,490 ML.
Total wastewater collected during the 2014–15 year was 240,562 ML. The volume of wastewater collected by each utility is given in Figure N10.

Figure N10 Wastewater collected and distributed by different utilities in the South East Queensland region for the year 2014–15
Further information on wastewater and recycled water system inflows is available in the Wastewater flows table.
A detailed breakdown of the inflows and outflows of the urban water system components are provided in the urban water balance diagram.
Water supply outflows
Total outflows (Figure N11) from the water supply system increased by approximately 5% compared to the previous year. Total outflows were 259,755 ML and comprised the following:
- Supply system delivery: urban users—236,755 ML
- Leakage: groundwater—19,629 ML
- Supply system transfer: inter-region—0 ML
- Other supply system decreases—3,371 ML.

Figure N11 Outflows from the water supply system
A comparison of water supply outflows to the previous year is provided in Figure N11. Delivery to urban users remained steady compared to the previous year, despite increased inflows to the water supply system during the 2014–15 year (see Water supply inflows). No supply system transfer to Tweed Shire Council occurred during the 2014–15 year.
Losses from the urban water supply system included leakage: groundwater (19,629 ML), which was 2% less than that in the previous year. Other supply system decreases' (3,371 ML) refers to all other non-revenue water from the urban supply system, such as consumer meter inaccuracies and unauthorised consumption.
Further information on supply system outflows is available in the Supply outflows table.
Wastewater and recycled water outflows
Total outflows from the wastewater and recycled water system (Figure N12) decreased minimally compared to the previous year. Total outflows were 238,385 ML and comprised the following:
- Evaporation—33 ML
- Discharge: sea—200,224 ML
- Recycled water delivery: urban users—13,980 ML
- Discharge: landscape—736 ML
- Leakage: landscape—0 ML
- Other wastewater and recycled water system decreases—0 ML
- Wastewater and recycled water discharge: surface water—19,508 ML
- Wastewater and recycled water transfer: inter-region—3,904 ML.

Figure N12 Wastewater outflows from South East Queensland's wastewater system during the 2014–15 year
Six of the WWTPs within the South East Queensland region sends recycled water to advanced water treatment plants (AWTPs) located in Bundamba, Gibson Island and Luggage Point, all operated by Seqwater. The AWTPs produce high-quality treated water for industrial use which is included under 'Recycled water delivery: urban users'. The Western Corridor Recycled Water Scheme (WCRWS) is currently being placed in 'care and maintenance' mode to preserve the asset and allow reactivation if required.
Some of the increase in discharge to sea and estuary is also due to the disposal of effluent which would have previously been sent to the WCRWS.
A portion of wastewater was further treated in the recycled water and advanced water treatment systems and delivered for urban use (13,980 ML) in the 2014–15 year. Approximately 6% of the total wastewater collected to the system was recycled and delivered to users. The use of recycled and advanced treated water decreased by approximately 44% in 2014–15 compared to that in the 2013–14 year, which can be attributed to the lack of data available from QUU at the time of publication..
Estimated evaporation losses in the wastewater and recycled water system (33 ML) was reported by South Burnett Regional Council and Toowoomba Regional Council; no data was available from other utilities.
Recirculation of treated wastewater and recycled water occurs in the system which may be subjected to additional treatment and/or re-use on site. The reported urban system outflows exclude any such recirculated volumes in the system.
Total wastewater outflows from South East Queensland region's wastewater and recycled water system is given in Figure N12. Outflows from each utility are given in Figure N10.
Further information on wastewater and recycled water system outflows is available in the Wastewater flows table.
Urban water system balancing item
The urban water balance (Table N11) yielded a balance item of –10,864 ML. This is approximately 2% of the total urban water system inflows at the end of the 2014–15 year.
| Account: Urban water system | Volume (ML) |
| Opening balance (at 1 July 2014) | 4,951 |
| Total urban water system inflows | 508,354 |
| Total urban water system outflows | (498,140) |
| Closing balance (at 30 June 2015) | (4,301) |
| Balancing item | (10,864) |
The misbalance may be due to a number of factors, such as metering inaccuracies, unaccounted losses, and inaccuracies in the estimation of certain volumes.
Unaccounted-for difference
The volume recognised in the water accounting statements (570,813 ML) represents the total unaccounted-for difference for the South East Queensland region for the 2014–15 year.
The unaccounted–for difference is the volume necessary to reconcile the opening water storage and closing water storage with the total water inflows and total water outflows reported in the water accounting statements (Table N12).
| Account: Water storage | Volume (ML) |
| Opening water storage balance (at 1 July 2014) | 2,335,230 |
| Total water inflows | 4,754,176 |
| Total water outflows | (4,039,765) |
| Closing water storage balance (at 30 June 2014) | (2,478,828) |
| Unaccounted-for difference | (570,813) |
The unaccounted-for difference can also be calculated by tallying the volumes necessary to reconcile (balance) the opening and closing storage with the water inflows and outflows of each of the separate water stores of the region, as shown in Table N13.
| Balancing item | Volume (ML) |
| surface water store | (547,231) |
| groundwater store | (12,718) |
| urban water system store | (10,864) |
| Unaccounted-for difference | (570,813) |
Table N13 shows that the unaccounted-for difference volume is primarily explained by the balancing item of the surface water. The surface water balancing item is attributed to uncertainty associated with runoff and river outflow, and the volume of river and floodplain losses not being able to be quantified (see Surface water note).