


Overview

In brief
- The 2021–22 financial year (1 July 2021 to 30 June 2022) was much warmer than average and marked by numerous periods of flooding in New South Wales and Queensland.
- The Australian average mean temperature was 0.96 °C above the 1961–90 average, the 8th-warmest financial year since national records began in 1910.
- The mean annual minimum temperature was the 5th-warmest on record for Australia as a whole, 0.91 °C above the 1961–90 average.
- Both mean annual maximum and minimum temperatures were above average for much of Australia, and record-warm for parts of northern Australia.
- Mean annual maximum temperatures were cooler than average for parts of eastern New South Wales.
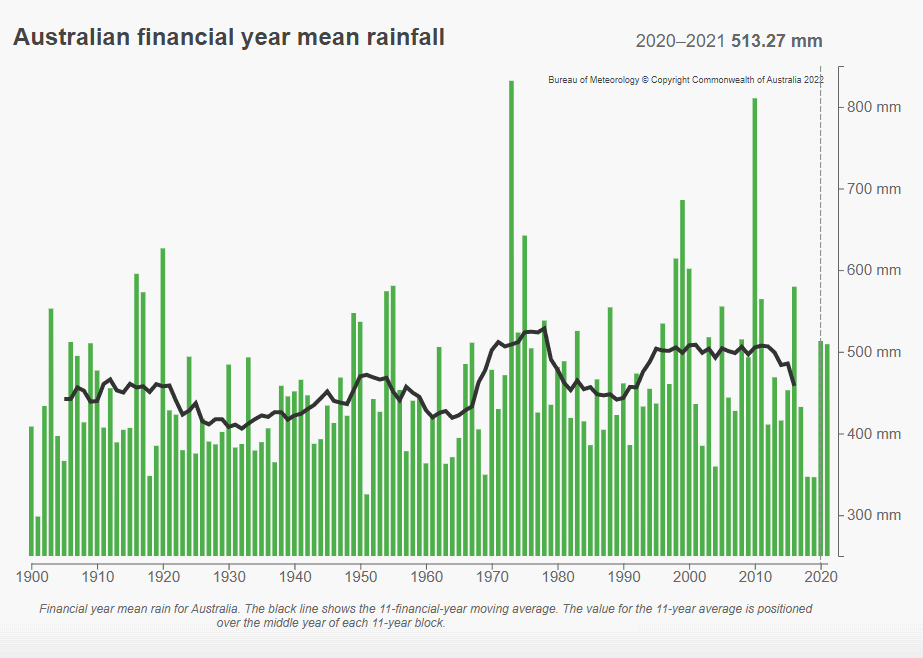
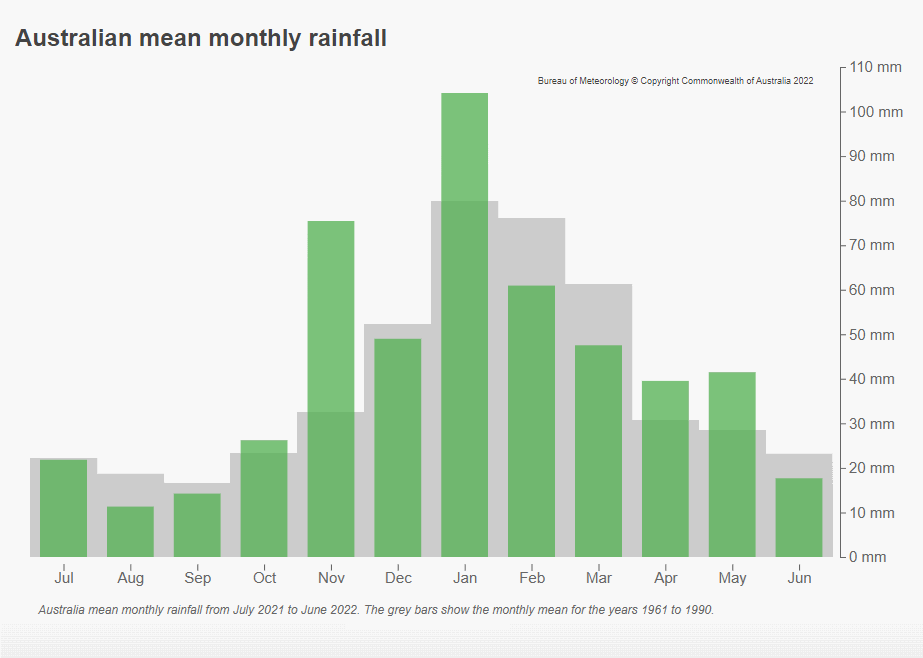
- The Australian average total rainfall was 9% above the 1961–90 average, at 509.4 mm.
- Rainfall for the financial year was above average for much of the eastern mainland states, pastoral South Australia and central Australia, with highest on record rainfall for parts of south-eastern Queensland and north-east New South Wales.
- Rainfall was below average for the north of the Northern Territory, part of Queensland's Gulf Country, Western Australia's Goldfields and south-east coast regions, far south-east South Australia, and western Tasmania.
- La Niña became established in late November 2021, peaked in mid-summer, and weakened over autumn 2022.
- Signs of a potential Negative Indian Ocean Dipole event appeared in June 2022.
- Australia's wettest November on record saw flooding across large areas of New South Wales and Queensland from November into December.
- Significant flooding affected south-eastern Queensland in January before extreme multi-day rainfall in late February and March produced record-breaking floods in south-eastern Queensland and eastern New South Wales.
- Early in April heavy rain again brought flooding to some coastal catchments of New South Wales and parts of eastern Victoria.
- Widespread above average rainfall conditions contributed to above average streamflows across much of Australia, with highest on record observed along the east coast and in inland New South Wales.
- With improved rainfall and streamflow conditions, water storage levels were high for much of Australia throughout 2021–22; as a result, water allocations were high at the end of 2021–22 for most water entitlement holders.
- Continued rainfall deficiencies and decline in inflows was reflected in low storages in some areas including western Victoria, parts of central Queensland, western Tasmania, and south-west Western Australia.
- Groundwater storage levels varied considerably across Australia in 2021–22. In areas of high rainfall and flooding, such as the northern Murray–Darling Basin and south-eastern Queensland, groundwater level recovery was achieved, with above average levels for many bores. This contrasted with below average levels in the southern Murray–Darling Basin and along the Victoria–South Australia border.
- Buoyed by high water availability, record volumes of water allocations were traded were traded at low prices during 2021–22. In contrast, volumes of entitlements traded nationally were at their lowest levels since 2010–11 but those traded were at record high average prices.
- There were 9 tropical cyclones in the Australia region during the 2021–22 season, slightly less than the average 11 across all financial years since 1969–70, but consistent with more recent years, with average 9 since 2000–01.
- Only 2 tropical cyclones with at least Category 1 strength (Tiffany and Anika) made landfall on the Australian mainland, which is fewer than the long-term average of 4 (since 1969–70).
A warmer than average 12 months
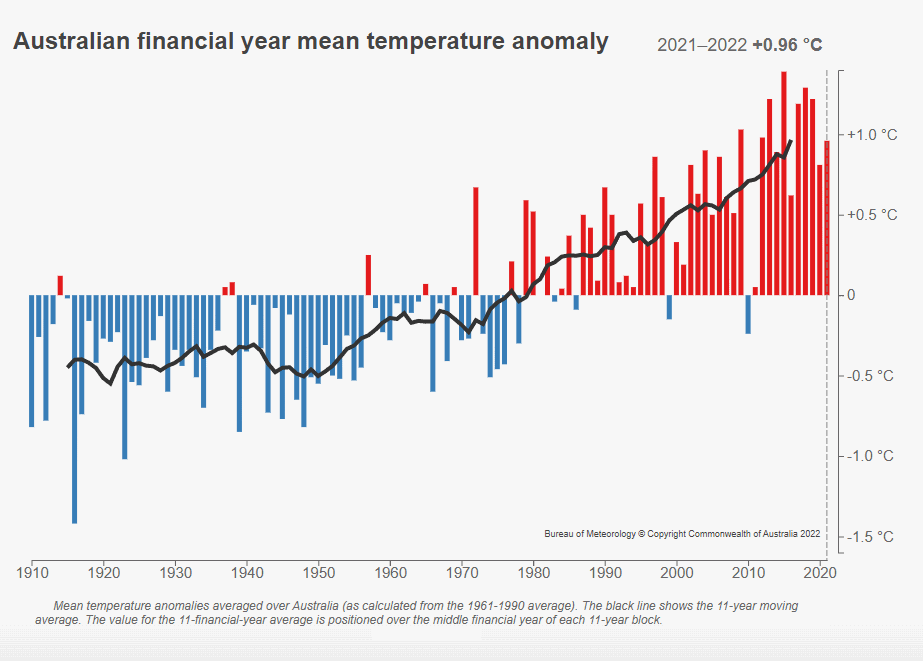
For Australia as a whole, the 2021–22 financial year mean temperature was 0.96 °C above the 1961–90 average, the 8th-warmest financial year on record since records commenced in 1910.
The mean annual minimum temperature was the 5th-warmest on record for Australia as a whole, at 0.91 °C above average. While the mean annual maximum temperature was 1.00 °C above average, it placed outside the ten warmest on record.
Both mean annual maximum and minimum temperatures were above average for much of Australia, and record-warm for parts of northern Australia. Mean annual maximum temperatures were cooler than average for parts of eastern New South Wales.
Based on the ACORN-SAT dataset, Australia's climate has warmed on average by 1.47 ± 0.24 °C between when national records began in 1910 and 2020. Most of this warming has occurred since 1950.
Warmth was widespread and persistent through much of 2021–22, with the Australian mean temperature amongst the ten warmest on record for July, August, December, March, and April. November bucked the trend, the only month during July 2021 to June 2022 with a cooler than average mean temperature (−0.64 °C), with record-high rainfall contributing to it being Australia's coolest November since 1999.
Heat was a feature in the north across the financial year, with severe to extreme heatwave conditions affecting the Kimberley and Top End during October, and the north and west throughout summer and early autumn.
Warm sea surface temperature anomalies to the west and north-west of Western Australia, and a ridge of high pressure south of the Great Australian Bight (associated with positive SAM (Southern Annular Mode) across most of summer), played an important role in the summer heat. The presence of warm sea surface temperature anomalies around the coast decreased the temperature contrast between land and ocean; this contrast is necessary to drive sea breezes. The location of the high pressure system was further west than is typical, and favoured a predominantly easterly wind pattern over Western Australia that worked against the formation of cooling sea breezes along the coast.

Area-average temperatures
| Maximum Temperature | Minimum Temperature | Mean Temperature | |||||||
|---|---|---|---|---|---|---|---|---|---|
| Rank (of 112) |
Anomaly (°C) |
Comment | Rank (of 112) |
Anomaly (°C) |
Comment | Rank (of 112) |
Anomaly (°C) |
Comment | |
| Australia | 101 | +1.00 | 108 | +0.91 | 5th highest | 105 | +0.96 | 8th highest | |
| Queensland | 105 | +1.14 | 8th highest | 110 | +1.54 | 3rd highest (record +1.84 °C in 2016) | 109 | +1.34 | 4th highest (record +1.63 °C in 2016) |
| New South Wales | 69 | +0.23 | = 100 | +0.86 | 84 | +0.55 | |||
| Victoria | = 83 | +0.39 | 108 | +1.01 | 5th highest | 102 | +0.70 | ||
| Tasmania | = 102 | +0.77 | equal 10th highest | = 106 | +0.63 | equal 6th highest | 107 | +0.71 | 6th highest |
| South Australia | = 85 | +0.55 | 96 | +0.59 | 91 | +0.57 | |||
| Western Australia | = 100 | +1.17 | 102 | +0.63 | 103 | +0.90 | 10th highest | ||
| Northern Territory | = 109 | +1.42 | equal 3rd highest (record +1.84 °C in 2019) | = 105 | +0.88 | equal 7th highest | 110 | +1.16 | 3rd highest (record +1.39 °C in 2019) |
Rainfall slightly above average
The total rainfall for Australian for the 2021–22 financial year (July 2021 to June 2022) was 9% above average, compared to all observations since national records began in 1900.
Rainfall for the financial year was above average for much of the eastern mainland states, pastoral South Australia, and Central Australia. Rainfall was highest on record for parts of south-eastern Queensland and north-east New South Wales.
Rainfall was below average for the north of the Northern Territory, part of Queensland's Gulf Country, Western Australia's Goldfields and south-east coast region, far south-east South Australia, and western Tasmania.
November 2021 was Australia's wettest on record, with more than twice the long-term national average November rainfall, and flooding across large areas of New South Wales and Queensland from November into December.
Periods of flooding occurred across the eastern mainland multiple times during the first half of 2022. For New South Wales as a whole, area-average rainfall for autumn was the highest since 1990 and the 7th-wettest on record.
Significant flooding affected south-east Queensland during January and February.
Persistent heavy rainfall in March resulted in significant and widespread flooding across coastal New South Wales, with flooding also affecting south-east Queensland at the end of March.
In early April heavy rain again brought flooding to parts of coastal New South Wales and parts of eastern Victoria. Late in the month, heavy rain in coastal areas of tropical Queensland caused some flooding, with rainfall extending well inland, with some areas of western Queensland receiving well in excess of their average monthly rainfall for April.
In May, flooding affected parts of Queensland from the coastal northern tropics, to areas of the Central West, and south-east Queensland.

for the 2021–22 financial year, relative to all years since 1900.


Area-average rainfall
| Rank (of 122) |
Average (mm) |
Departure from mean |
Comment | |
|---|---|---|---|---|
| Australia | 94 | 509.4 | +9% | |
| Queensland | 92 | 703.9 | +13% | |
| New South Wales | 118 | 770.5 | +38% | 5th highest; highest since 2011 |
| Victoria | 96 | 713.1 | +8% | |
| Tasmania | 54 | 1322.8 | −3% | |
| South Australia | 108 | 266.5 | +19% | |
| Western Australia | 77 | 355.4 | +4% | |
| Northern Territory | 51 | 491.1 | −10% | |
| Murray-Darling Basin | 113 | 637.7 | +30% | 10th highest |
Water
Water resources
In 2021–22, the status of many of Australia's water resources was influenced by above average rainfall and wet soil conditions.
Heavy rainfall in November 2021 contributed to widespread flooding in inland New South Wales and southern Queensland. Extreme multi-day rainfall in late February and March produced record-breaking floods in south-eastern Queensland and eastern New South Wales.
With widespread above average rainfall conditions, streamflows across much of Australia were above average, and highest on record streamflows were observed along the east coast and in inland New South Wales.
Surface water storage levels increased compared to 2020–21 for many parts of the country; however, a continued decline of inflows in areas with long-term rainfall deficiencies was reflected in low storages in some areas, particularly western Victoria, inland New South Wales, western Tasmania, and south-west Western Australia.
Groundwater storage levels varied considerably across Australia in 2021–22. In areas of high rainfall and flooding, such as the northern Murray–Darling Basin and south-eastern Queensland, groundwater levels increased, with above average levels for many bores. This contrasted with below average groundwater levels in the southern MDB and along the Victoria–South Australia border.
Improved rainfall and streamflow conditions and high surface water storage levels for much of Australia meant water allocations for most licence holders were high at the end of 2021–22.
With high water availability, the volume of allocation traded nationally during 2021–22 was a record high. However, the average price paid per megalitre remained low similar to the previous year. In contrast to allocation trades, low volumes of entitlements were traded nationally with buyers paying record high average prices in regions such as the Murray–Darling Basin.
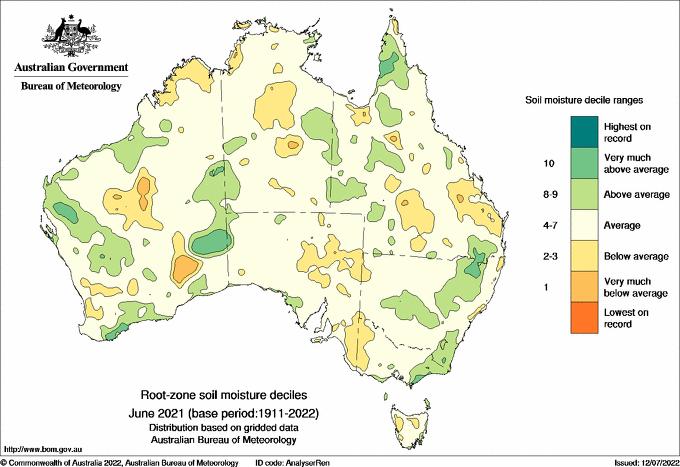
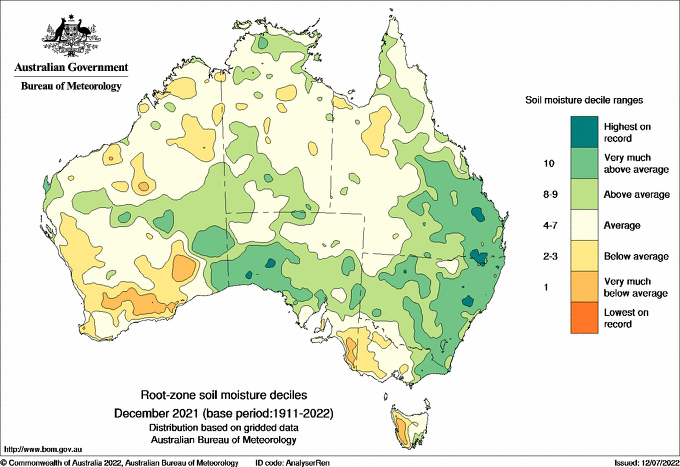
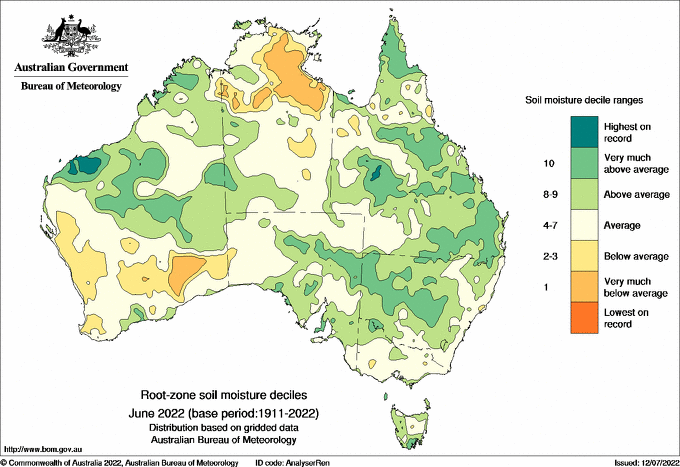
Soil moisture
For most of Australia, soil moisture in the root zone improved significantly by December 2021, largely in response to Australia's wettest November on record. Average to very much below average soil moisture in many parts of Australia during August was followed by very wet soils across most of the country during November. At the end of 2021, soil moisture in the east of the country, including the Murray–Darling Basin, and much of South Australia outside the Murray–Darling Basin was above average to highest on record.
Soil moisture decreased over summer but increased significantly again over autumn across the eastern mainland, with root zone soil moisture very much above average from eastern Victoria to south-eastern Queensland for March and April. In May and June, there was a return to average soil moisture in Victoria and the east coast of New South Wales, and a continuation of above average soil moisture for much of the remainder of the eastern mainland.
In western Tasmania, soil moisture persisted at very much below average to lowest on record from December to May following multiple months of below or very much below average rainfall for the west of the state. It was not until June that soil moisture in western Tasmania increased to above average.

Mostly above average streamflows and major flooding across Queensland and New South Wales
In 2021–22, streamflows were above average (based on records since 1975) across much of Australia as a result of heavy rainfall and wet soil conditions, particularly in eastern Victoria, south-eastern Queensland, and much of New South Wales.
Highest on record streamflows were observed at 18% of the 915 sites where streamflow is measured and had less than 20% of daily records missing in 2021–22. Higher than average streamflows were measured at 63% of sites. Areas with highest on record streamflows were mostly in inland New South Wales and along the east coast of Australia between South East Queensland and Victoria.
| Streamflow decile categories | No of sites | Percentage of sites (%) |
|---|---|---|
| Highest on record | 168 | 18 |
| Very much above average | 219 | 24 |
| Above average | 188 | 21 |
| Average | 288 | 31 |
| Below average | 43 | 5 |
| Very much below average | 8 | 1 |
| Lowest on record | 1 | 0 |
Streamflows were average at 31% of the total sites, and very much below average in parts of South Australia and northern Queensland.
November's heavy rainfall contributed to widespread flooding in inland New South Wales and southern Queensland. The most significant flooding was in the rivers of the Murray–Darling Basin, particularly from the Lachlan River northwards, but there was also flooding in several catchments that drain to the east coast. Major flooding was observed in November and early December in the Macintyre–Weir, Condamine–Balonne, Barwon, Namoi, Macquarie, Lachlan, Dawson, Logan–Albert, and Hunter catchments (see Special Climate Statement 75 for more information).
In late February and early March, extreme multi-day rainfall produced record-breaking floods in south-eastern Queensland and eastern New South Wales (based on available river level records) (see Special Climate Statement 76 for more information). Large areas of south-eastern Queensland experienced extensive flash flooding, overwhelming local drainage systems and causing many minor creeks and rivers to burst their banks. Many rivers in south-eastern Queensland reached their major flood heights and major flood warnings were issued, including for Mary, Mooloolah, Stanley, Brisbane, Bremer, and Logan rivers, and Lockyer and Laidley creeks. The Mary River at Gympie reached a maximum height of 22.96 m, surpassing its historical peak (21.67 m in 1999) and significantly exceeding the 17 m threshold for what is considered a major flood. The Brisbane River at Brisbane City peaked on the high tide at 3.85 m, and river levels reached record highs in Ipswich on the Bremer River, a tributary of Brisbane River. In parts of northern New South Wales, peak flood levels broke previous records and inundated major towns, including Lismore (Wilsons River), Coraki and Woodburn (Richmond River), and Murwillumbah and Tumbulgum (Tweed River). The Wilsons River at Lismore peaked at a record high level, estimated at 14.4 m on 28 February, exceeding the previous record flood level of 12.27 m in February 1954.

Water availability
Water availability in regional Australia
The volume of water available for water users in Australia is governed by entitlements on issue (or water licences) which are perpetual or ongoing rights for exclusive access to a share of water. The volume of water an entitlement holder receives each year is determined by an annual allocation of water that depends on the amount of water available in water storages and inflows into water storages over the financial year. Allocations are typically reviewed fortnightly by state water agencies and may increase over the financial year until the maximum allocation is reached.
With improved rainfall and streamflow conditions, water storage levels were high for much of Australia throughout 2021–22; as a result, water allocations were high at the end of 2021–22 for most entitlement holders.
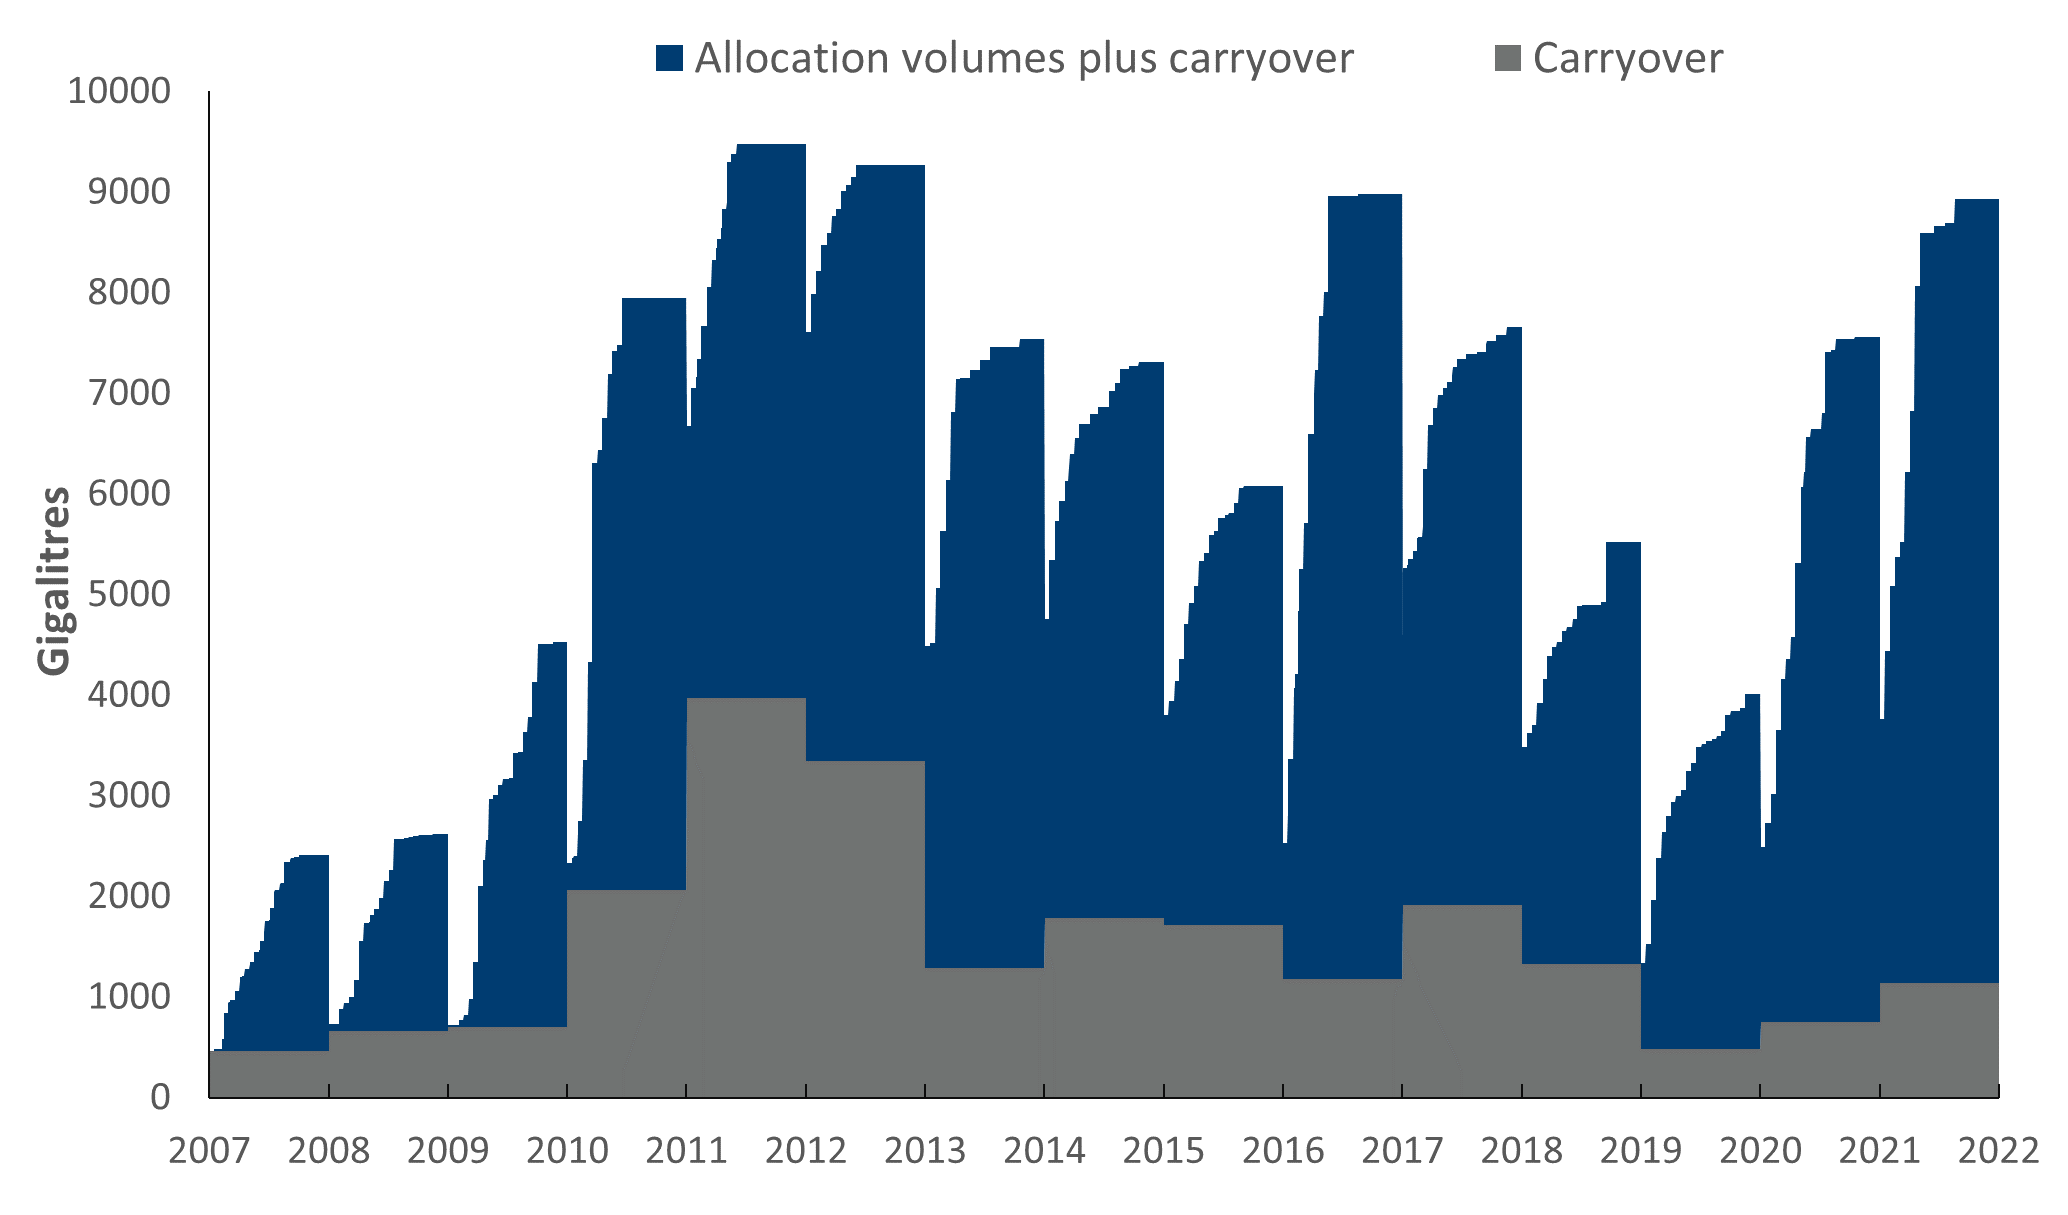
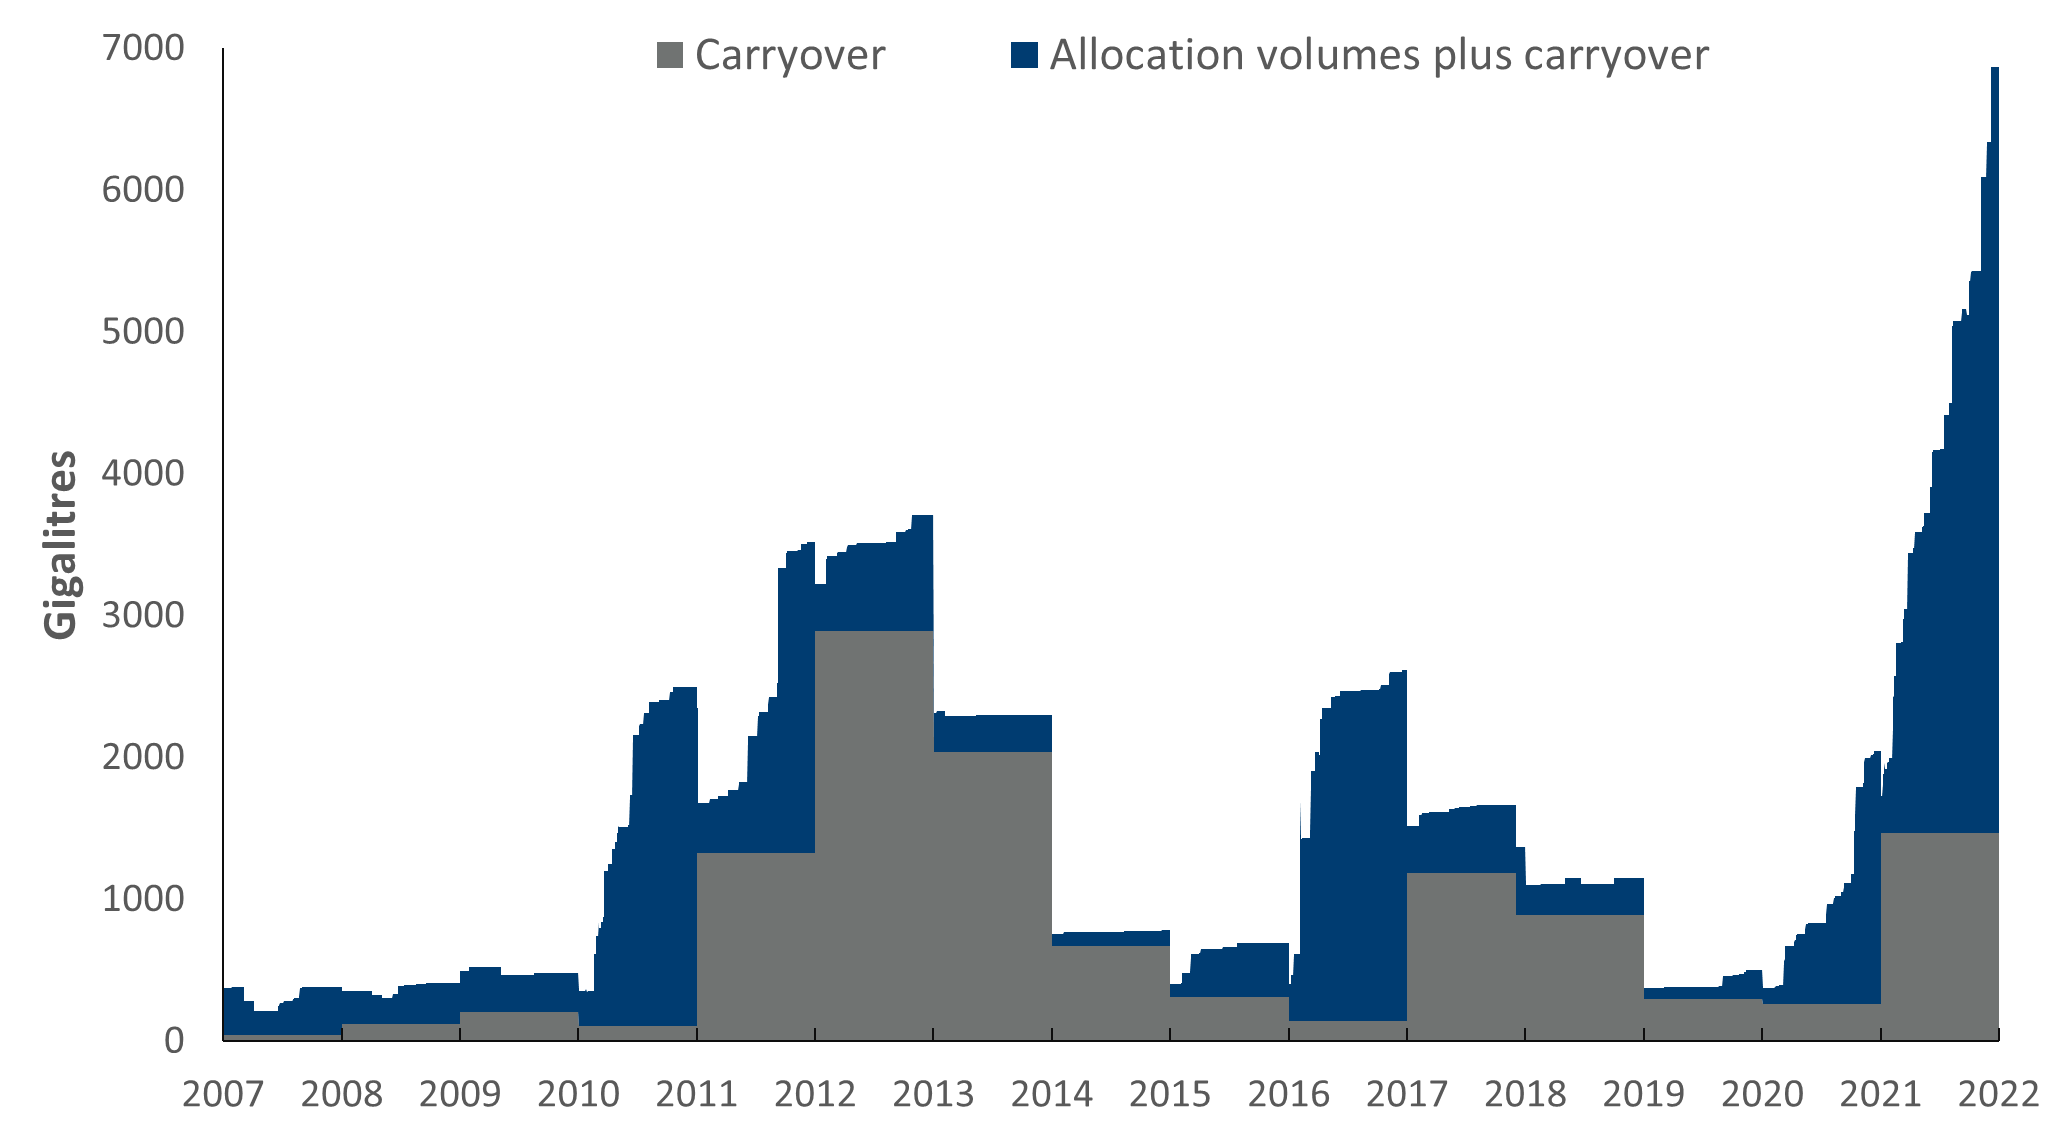
In the southern Murray–Darling Basin (MDB), water allocations (plus 'carryover' water that had been allocated in the previous year but not used) were at their highest since 2016–17. In the northern MDB, water allocations were the highest since the Bureau commenced collecting allocation information in 2007–08 which was around the end of the Millennium drought.
Water availability in urban centres
In urban centres, water availability is influenced by levels in surface water storages and groundwater, with augmentation through alternative sources — desalination or recycled water schemes – where storage volumes are not adequate.
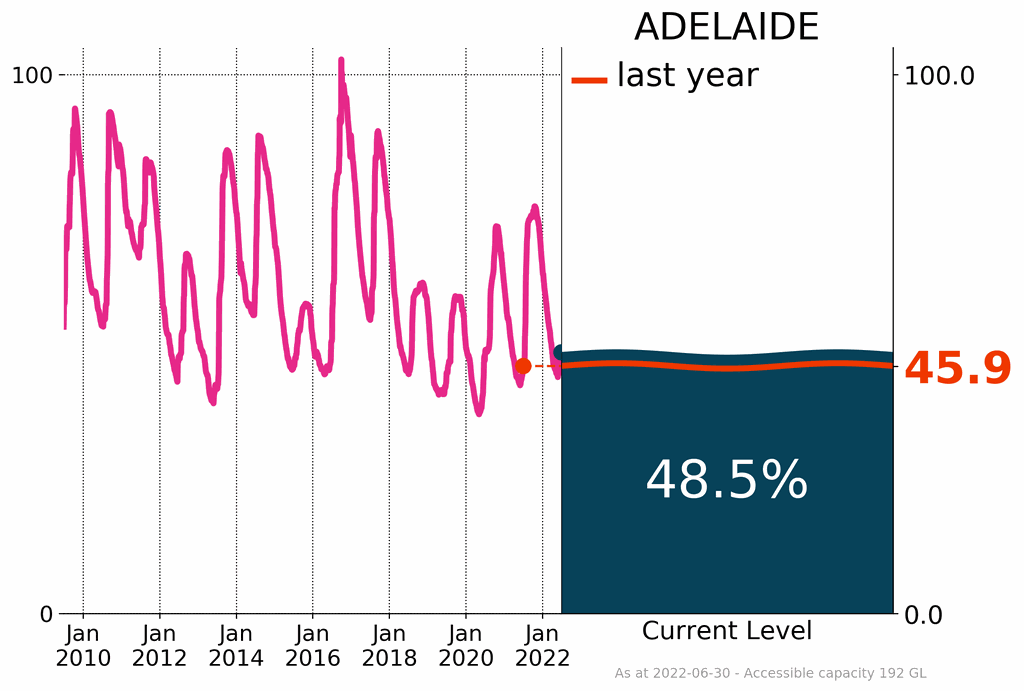
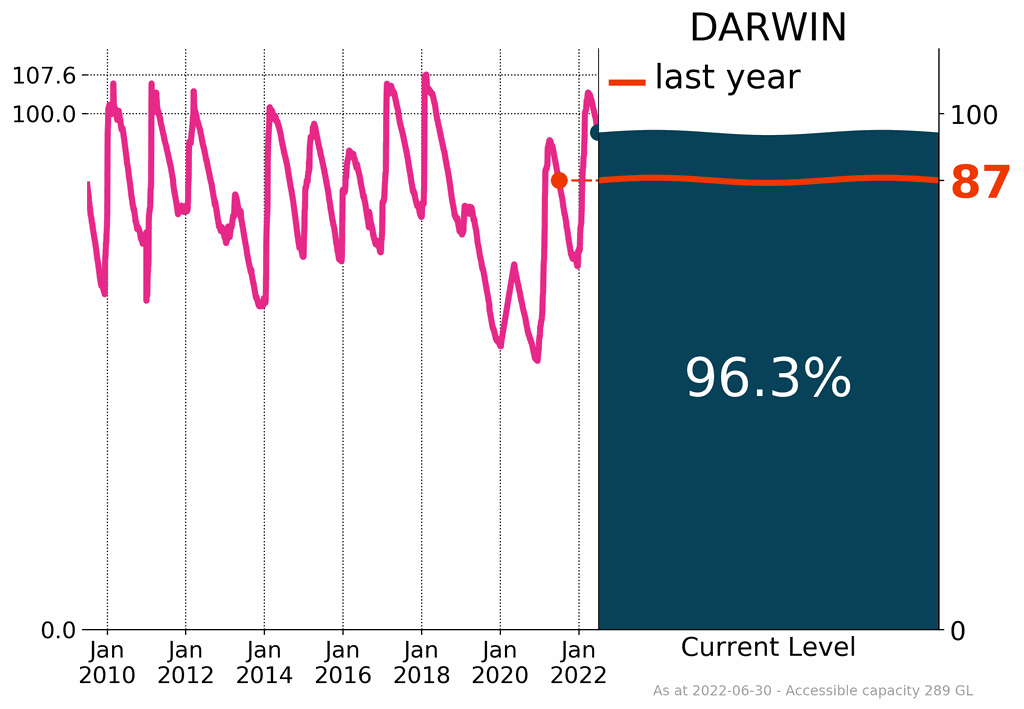
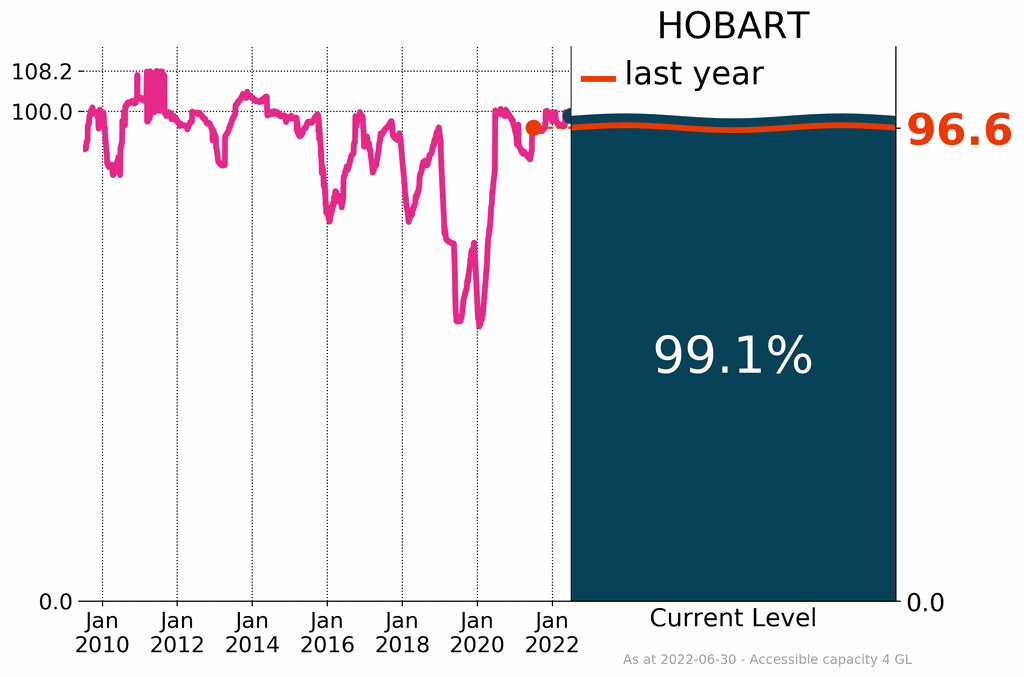
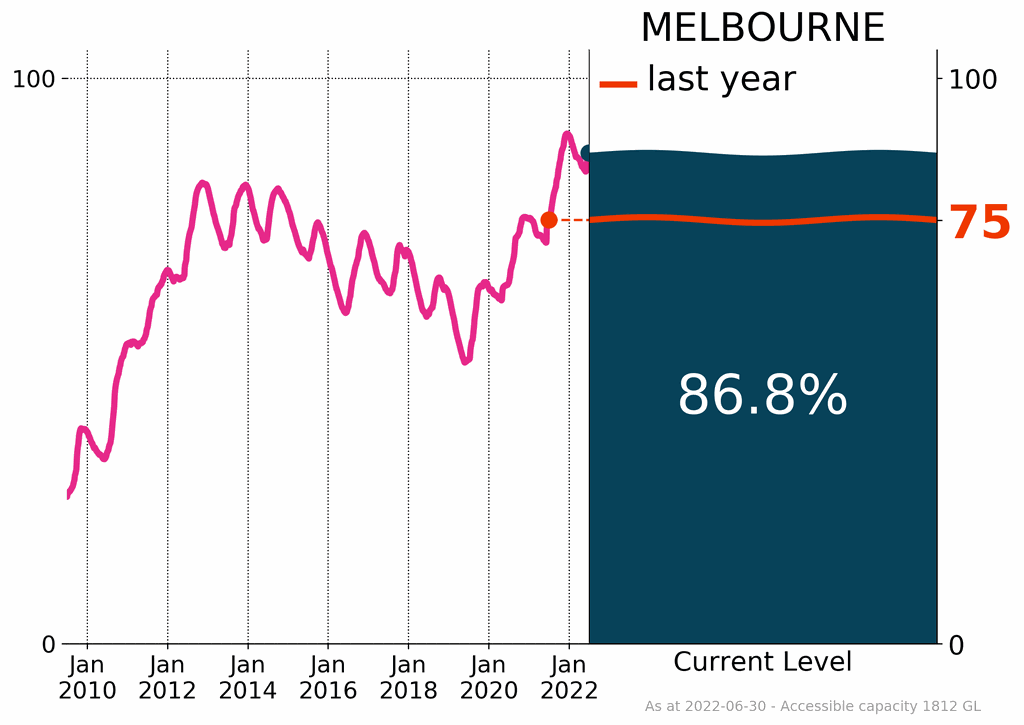
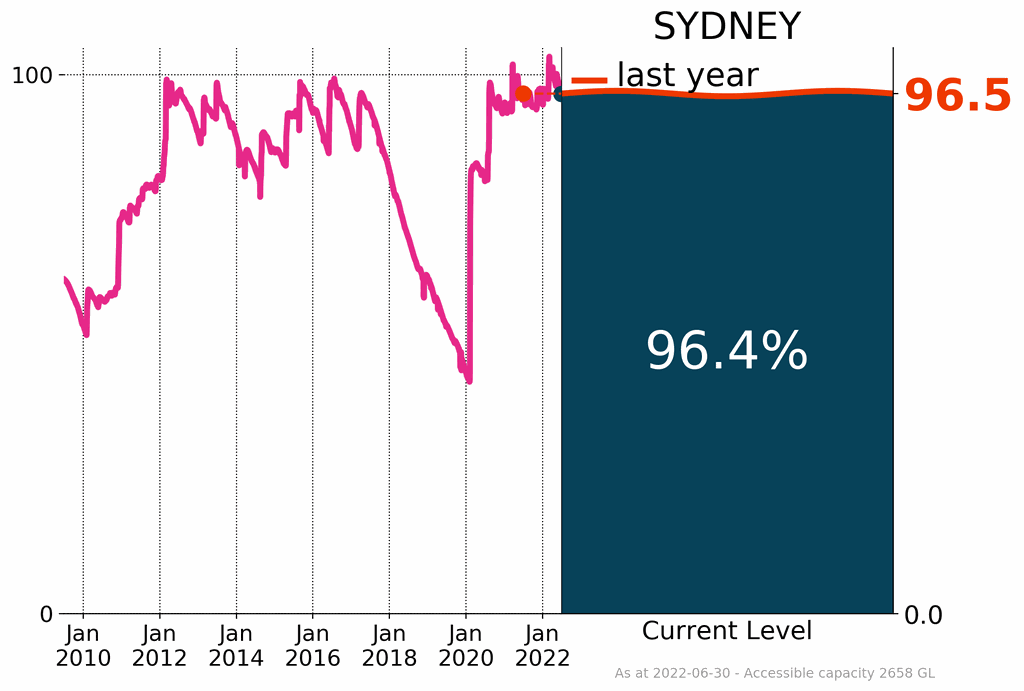
Surface water storages that supply the major capital cities finished the financial year with volumes greater than 85% full, with the exceptions of Adelaide and Perth.
Adelaide received average rainfall in 2021–22, which maintained its storage volumes following below average rainfall last year–storage volume was at 48.5% at the end of 2021–22 compared to 45.9% in the previous year. Adelaide's water supply needs are augmented by alternative sources, mostly water transfers from the River Murray, with some supply from desalinated water and groundwater.
Perth's surface water storages were 48.4% at the end of 2021–22, up from 40.4% the previous year; however, there has been a general trend of long-term decline to surface water inflows to the city's storages. Perth's water supply is more reliant on desalinated water and groundwater than surface water. The city's water supply strategy involves 'banking' of groundwater and desalinated water in its surface water storages during low demand periods to buffer peak supply period requirements.

Surface water storages
Increased surface water volumes across most of Australia
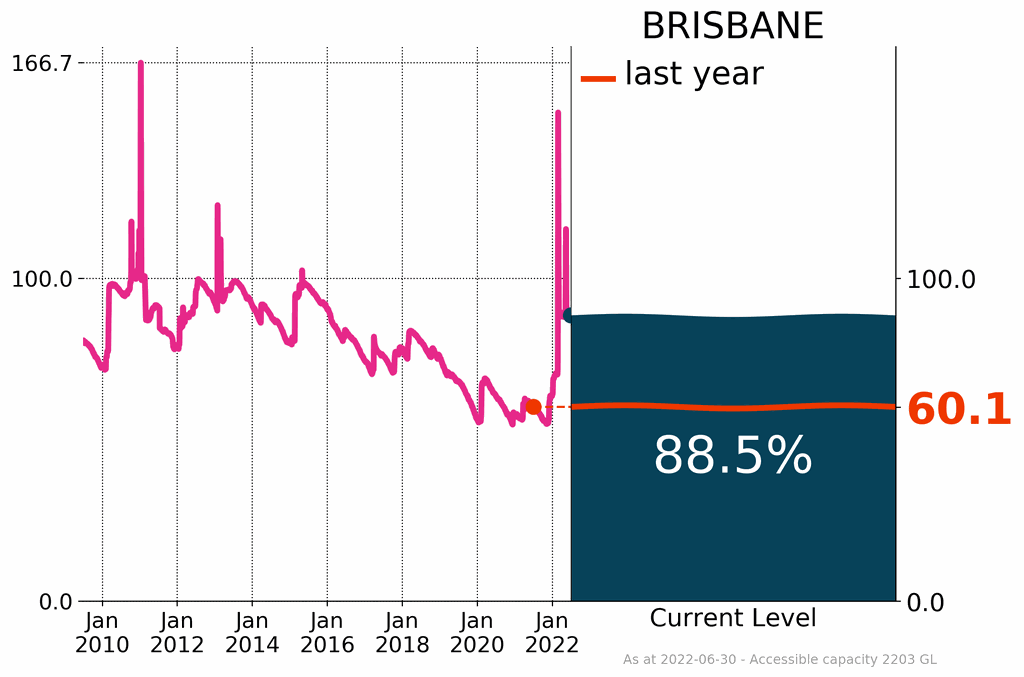
Surface water storages that supply the major capital cities finished the financial year with volumes greater than 85% full, with the exceptions of Adelaide and Perth, which rely on alternative water sources to meet supply needs (see Water Availability).
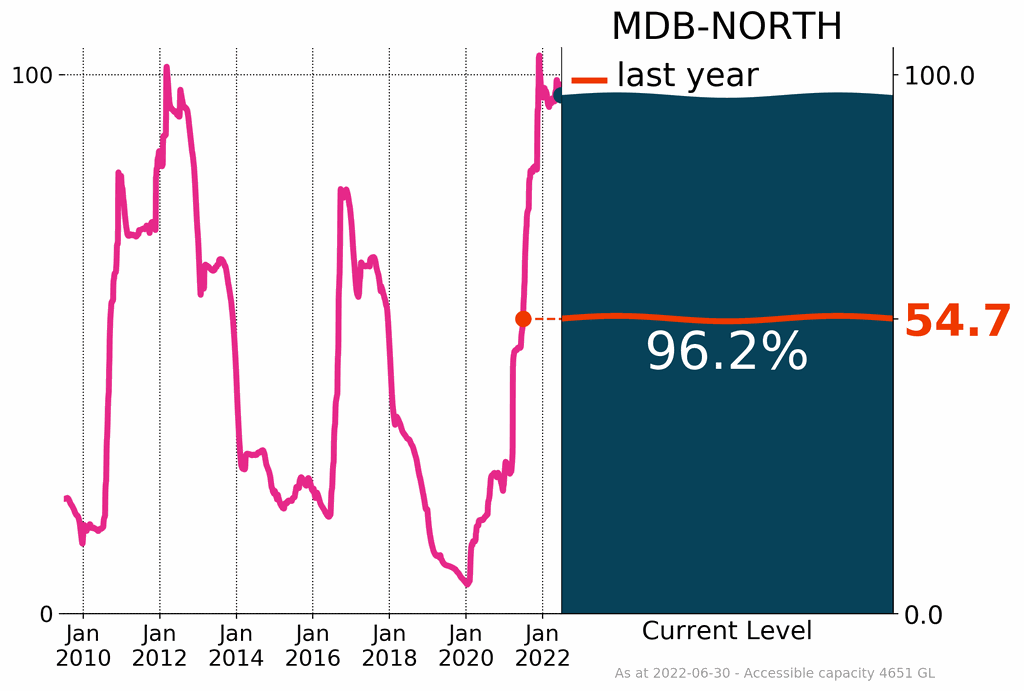
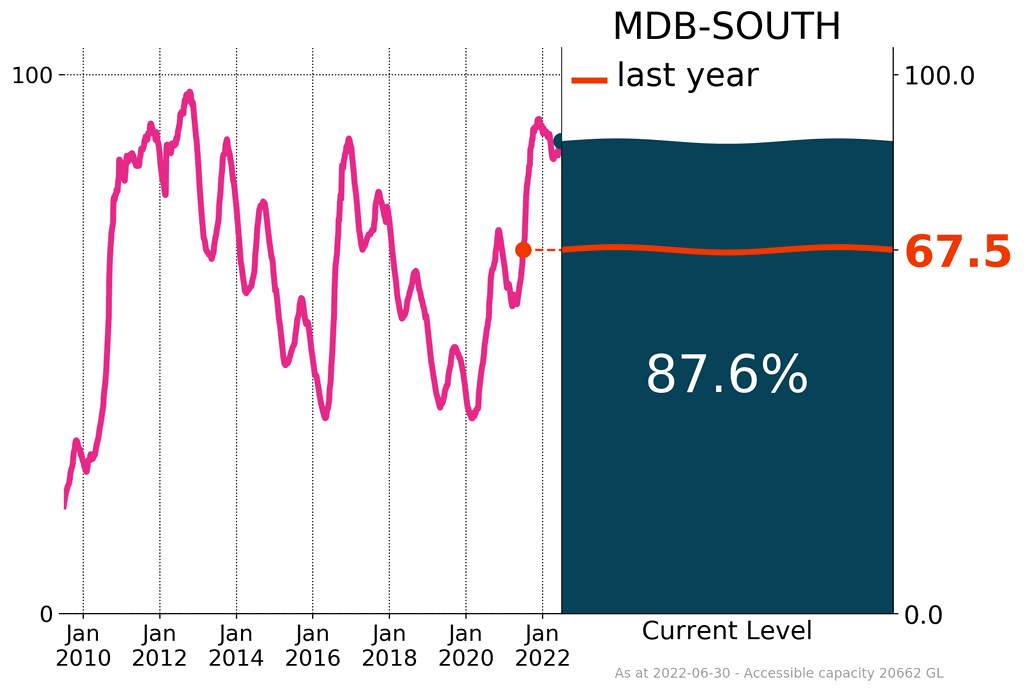
The Murray–Darling Basin ended the year with a total volume of 89.2%, a significant increase from the same time last year (65.0%). Storages in the southern Basin were at 87.6% in June 2022, and those in the northern Basin at 96.2%, an increase from their 67.5% and 54.7% respectively last year.
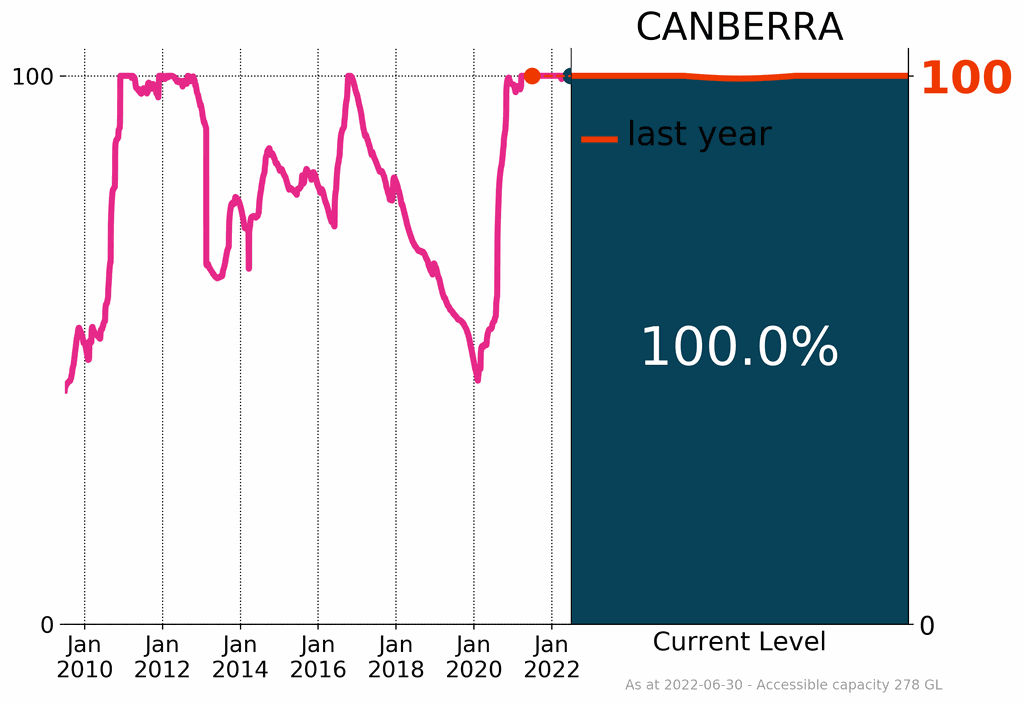
An unusually wet winter filling season in the northern Murray–Darling Basin, and further inflows over in spring meant that the storages were already reasonably full ahead of Australia's wettest November on record. The subsequent above average rainfall in December across most of the Basin, except for the Victorian and South Australian parts, resulted in many storages in New South Wales and the Australian Capital Territory reaching 100% and spilling. Australian Capital Territory storages have been at 100% and spilling since November 2020. Above average to very much above average rainfall over the summer period and through to the end of March resulted in levels being much higher than the same time last year. These levels were sustained with average rainfall in May.
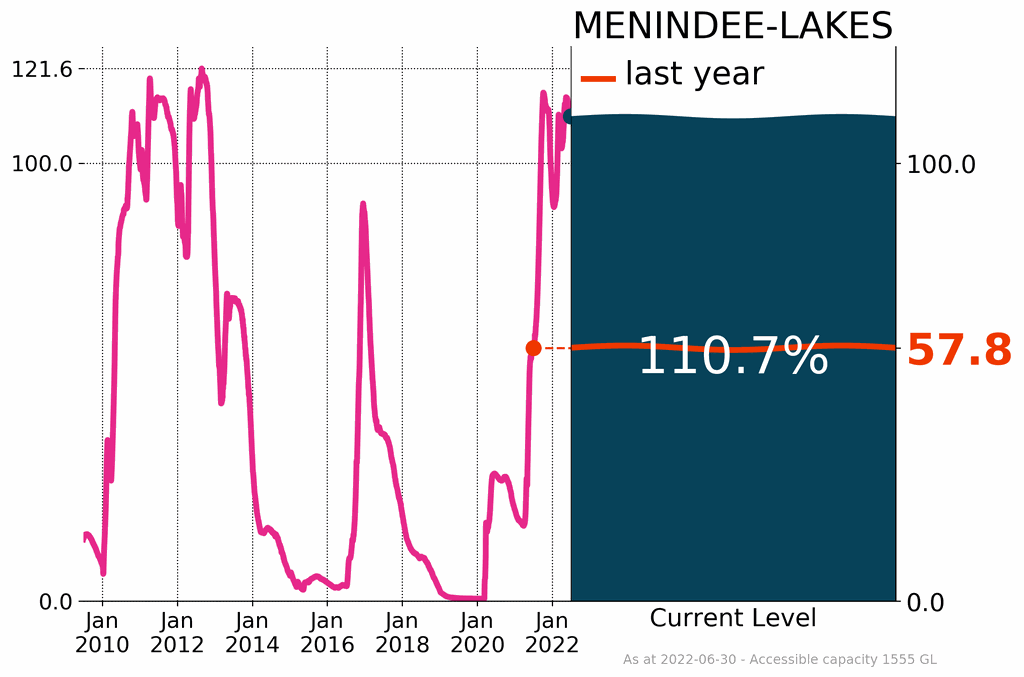
Flood waters resulting from above average rainfall in the northern Murray–Darling Basin contributed to rapid filling of Menindee Lakes, which reached 84.6% of accessible capacity by August, its highest since December 2012, and significantly higher than August 2020 when it was 24.8% full. By September, Menindee Lakes was at 113% of accessible capacity and spilling. Releases were made to the Menindee Lakes system in December and January to accommodate forecast flows from upstream tributaries. There were further increases in Menindee Lakes by the end of March with flood flows from the New South Wales Border Rivers and southern Queensland tributaries entering the system; this increased further in April and May following above average rainfall in upstream catchments. Menindee Lakes accessible capacity was 110.7% at the end of 2021–22, close to double its level last year.
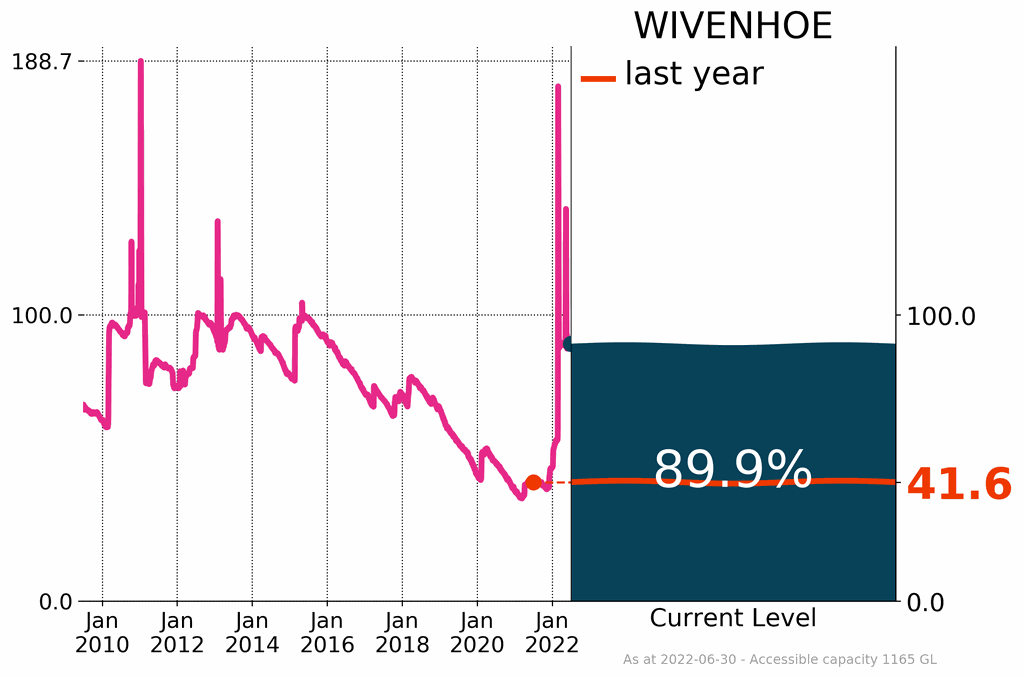
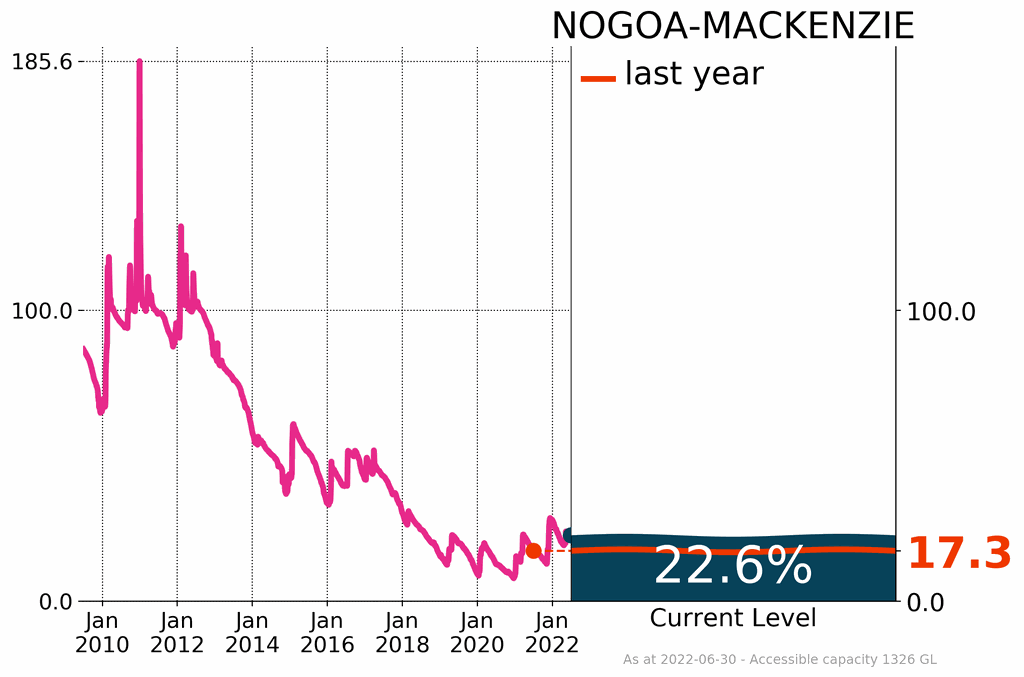
South East Queensland storages started the year low, continuing the trend of significant decreases over the past three years. November's very much above average rainfall and continued high rainfalls in December did not have a significant impact on the region's storages, which remained low until the intense and sustained rainfall in February and March in south-eastern Queensland and eastern New South Wales that resulted in a rapid rise in inflows to some major storages. Wivenhoe, the largest storage in South East Queensland, reached full capacity for the first time since June 2015, with its level increasing from 57% on 23 February to over 183% on 28 February, equivalent to an increase of by than 1.4 million megalitres. This rapid replenishment of storages was not seen in central Queensland, where February's average rainfall made little change to already-low levels. The Nogoa Mackenzie rural system finished 2021–22 at 22.6%, only slightly higher than 17.3% last year.
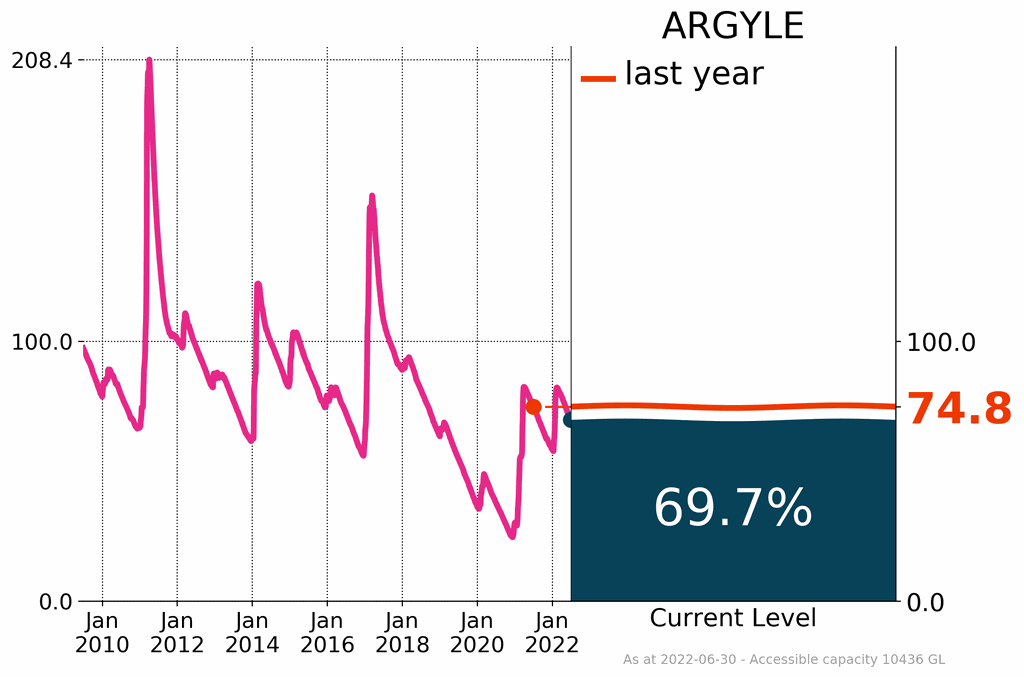
Northern Australia received average rainfall during the wet season (October–April), with Lake Argyle, the largest water supply storage in Australia, reaching 81.8% of accessible capacity by February, mainly due to monsoon flow and an associated tropical low that developed into tropical cyclone Anika. Lake Argyle finished the financial year at 69.7%, a slight decrease from 74.8% last year.


Individual storages
Australia has over 500 major storages, several thousand small storages, and in excess of two million farm dams. More detailed water information for eleven nationally significant water management regions is provided in the National Water Account. Individual timeseries of storage volume as a percentage of capacity for major storages are available from Water Data Online.
Water markets
Record volumes of allocation traded
During 2021–22, widespread above average rainfall and improved water availability resulted in record high volumes of water allocations traded for a financial year (8,110 gigalitres). However, prices for allocations remained low, similar to the previous year.
In the Murray–Darling Basin (MDB), high volumes of water in storages resulted in all high reliability entitlement holders receiving 100% allocations by the end of 2021–22. In addition, all major general reliability entitlements also received full allocations. For further information on entitlement reliability categories, please refer to the Australian Water Markets Report.
As a consequence of high water availability, average water allocation prices in the southern MDB, Australia's largest water market accounting for over 90% of total allocation trades by volume, were around $70 per megalitre (ML) during 2021–22. This was a slight decrease from prices in 2020–21 ($100 per ML) and a significant decrease from $700 per ML in January 2020, when average storage levels were at 32% for the southern MDB.
In contrast to allocation trades, 2021–22 saw low volumes of entitlements being traded, but at record high average prices. Nationally, 1,323 gigalitres of entitlements were traded, which was the lowest volume since 2010–11. In the MDB, surface water entitlement trade accounted for about 60% of total national entitlement trades by volume, with most major high security and general security entitlements trading for record high average prices. High prices are likely to be driven by demand from irrigators looking to underpin ongoing water requirements for high value crops with ongoing water entitlements.
Further information on water markets is in the Murray–Darling Basin Water Information Portal and the Australian Water Markets Report.
Groundwater
Groundwater levels across Australia varied widely in 2021–22, with 42% of bores below average, 30% average and 28% above average. High rainfall and flooding in some areas recharged stores that had been low due to prolonged drought conditions between 2017 and 2020. However, groundwater levels have remained low in other parts of Australia due to a lack of recovery from drought and dry conditions in 2021–22 and long-term trends associated with extraction and climate change.
The northern Murray–Darling Basin (MDB) and south-eastern Queensland experienced a recovery of groundwater stores due to increased recharge and reduced pumping associated with heavy rainfall and flooding in November and again in February and March. In contrast, many bores in the southern MDB and on the Victoria–South Australia border remain below average, reflecting long term consequences of groundwater extraction. The Victoria–South Australia border area has also received very low rainfall over recent years, including during 2021–22.
In south-west Western Australia, groundwater levels have generally been in decline over the past 40 years due to decreasing rainfall and increasing groundwater demand. In efforts to restore groundwater levels, initiatives in recent years have included managed aquifer recharge and measures to reduce groundwater extraction. Average winter rainfall in 2021–22 resulted in recharge to surficial aquifers of the Gnangara Mound. This is an improvement from the previous two years of low winter rainfall resulting in low groundwater recharge and low groundwater levels.
In the Top End of the Northern Territory, where groundwater recharge is reliant on wet season rainfall and streamflow, levels were below average in 2021–22 due below average rainfall in the 2021–22 wet season; however, groundwater levels were higher than the historically low levels between 2018 and 2020.


Major climate influences
A combination of drivers influenced Australia's climate in the 2021–22 financial year: the middle of 2021 was dominated by a negative Indian Ocean Dipole (IOD); La Niña emerged over spring and influenced the first half of 2022; and the Southern Annular Mode (SAM) was positive throughout much of the financial year.
The El Niño–Southern Oscillation (ENSO) in the tropical Pacific Ocean remained neutral throughout winter 2021, before signs of La Niña development were detected in early spring. Cooler than average sea surface temperatures became more widespread in the tropical Pacific Ocean from late October , with values of the Southern Oscillation Index (SOI) close to La Niña levels. La Niña became established in late November with the coupling of the ocean and atmospheric circulation in the tropical Pacific Ocean.
The 2021–22 La Niña peaked by late January; this was followed by a very slow decline towards neutral. Oceanic indicators of ENSO returned to neutral values (neither La Niña nor El Niño) during mid-to-late autumn, although some atmospheric indicators continued to show a La Niña-like signal at the end of June.
La Niña events increase the chances of above average rainfall for much of northern and eastern Australia. Even as La Niña weakens, it can continue to influence global weather and climate.
A negative Indian Ocean Dipole (IOD) pattern developed from mid-May 2021. Although the event weakened temporarily in August and September, the negative phase of the IOD persisted into early December with residual atmospheric patterns continuing for several weeks after weekly oceanic values of the IOD had returned to neutral in late spring.
Signs of negative IOD development in 2022 began from late autumn, with the IOD index very close to or exceeding negative IOD thresholds (i.e. at or below −0.4 °C) for three weeks up to the end of June.
A negative IOD increases the chances of above average winter–spring rainfall for much of southern and eastern Australia. Maximum temperatures are also more likely to be below average across southern Australia during a negative IOD, while across northern Australia warmer than average maximum and minimum temperatures are more likely during a negative IOD.
From late winter 2021 there was a stronger than average polar vortex around Antarctica, and an associated larger than average Antarctic ozone hole. This contributed to a positive phase of the Southern Annular Mode (SAM) from late August, with SAM remaining mostly positive throughout the months of spring and December. Positive SAM can also be promoted by La Niña in the spring and summer, which would have contributed to the extraordinarily persistent positive SAM during October to December 2021. SAM was again positive in much of April 2022.
Positive SAM typically enhances chances of above average rainfall over much of New South Wales during spring, and increases the chance of rainfall in much of eastern Australia during late spring and summer. Positive SAM is more likely to occur in late spring and summer with La Niña. This means it typically enhances the wet signal of La Niña when they occur together. However, western Tasmania is typically drier as positive SAM shifts weather systems further south than their average path. During winter, positive SAM also has a drying influence on south-west and south-east Australia and Tasmania.
In addition to the influence of climate drivers and natural variability, Australia's climate is increasingly affected by global warming. Based on the temperature dataset ACORN-SAT, Australia's climate has warmed by 1.47 ± 0.24 °C between 1910 (when records began) and 2020, with most of the warming occurring since 1950. The ocean waters around Australia have also warmed significantly over the past century, being consistently very warm over the past two decades. This background warming trend can only be explained by human influence on the global climate.
Rainfall has increased across most of northern Australia since the 1970s, especially in the north-west during the northern wet season (October to April). However, year-to-year rainfall variability remains high for northern Australia, with the 2021–22 wet season area-average rainfall almost exactly the same as the 1961–90 average.
Observations show that there has been an increase in the intensity of heavy rainfall events in Australia, with larger increases typically observed in the north of the country. A warmer atmosphere can hold more water vapour than a cooler atmosphere, and this relationship alone can increase moisture in the atmosphere by 7% for each 1 °C of global warming. Increased atmospheric moisture can also provide more energy for some processes that generate extreme rainfall events, which further increases the likelihood of heavy rainfall due to global warming.
There has been a significant decline in April to October rainfall over south-east and south-west Australia in recent decades, including in the Murray–Darling Basin. In the south-east of Australia, April to October rainfall has declined by around 12% since the late 1990s. There has been a decline of around 16% since 1970 in April to October rainfall over the south-west of Australia. The trend is particularly strong for the period from May to July over south-west Western Australia, with rainfall since 1970 around 20% less than the 1900–1969 average.
The influence of climate change on Australia's climate is discussed further in State of the Climate 2020.
Notable events
See also the Monthly Weather Review for extra details, including events affecting smaller geographical regions or causing limited damage.
On 20 July, a cold front brought damaging winds to central and eastern agricultural districts of South Australia, with gusts over 80 km/h recorded at several locations. A tornado damaged homes in Adelaide's north-east.
On 24 July, multiple fast-moving tornadoes brought down trees and damaged property south of Adelaide. Small hail fell across the Adelaide Hills, covering the ground in ice.
Severe thunderstorms also affected parts of New South Wales at the end of September, with damaging winds, heavy rain, and hail on the 29th and 30th. Giant hail (5 to 7 cm in diameter) was reported 40 km north of Bourke, with large hail also reported at Cunnamulla and Eulo on the 29th, while on the 30th a tornado was observed at Clear Creek, near Bathurst. The tornado caused damage to houses, powerlines, and trees along a 25 to 30 km line.
Severe thunderstorms also brought giant hail to parts of southern and south-east Queensland on 30 September, with 6 cm hail reported on the western Darling Downs.
Warmth was persistent across the north during October, with severe to extreme heatwave conditions affecting the Kimberley and Top End during the month. A large number of stations in the Northern Territory and western Queensland set early season temperature records for the warmest day so early after mid-winter, while others observed record runs of consecutive days of high temperatures, including 23 consecutive days of 40.0 °C or above at Argyle Aerodrome in the Kimberley. Three consecutive days of at least 42.0 °C were observed at Tennant Creek Airport, each exceeding the previous highest October maximum temperature record of 41.9 °C.
On 14 October, a tornado was observed at Armidale in New South Wales, with reports of damage to buildings and cars. Large hail, up to 5 cm in diameter, was reported at multiple locations including Tenterfield, Lalor Park, Ropes Crossing, and the Blue Mountains.
On 20 October a severe thunderstorm moved through Coffs Harbour and Sawtell, resulting in extensive damage to homes and the Toormina shopping centre, and leaving hail in drifts up to 30 cm deep on the ground.
Severe thunderstorms in Queensland brought giant hail and other damaging phenomena in October, including:
- giant hail in areas near the Sunshine Coast on the 14th
- golf ball sized hail south-east of Rockhampton on the 18th
- a funnel cloud and possible tornado at Bracewell near Gladstone on the 18th
- giant hail, up to 16 cm in diameter, at Yalboroo (between Mackay and Proserpine) on the 19th, including the largest hailstone with a verified measurement in Australia
- giant hail up to 11 cm in diameter in the Mackay area on the 20th, and a wind gust of up to 120 km/h at Mackay Airport with sightings of a weak tornado
- heavy rain and severe winds, leading to localised flash flooding at Brisbane Airport, and a weak tornado, which damaged buildings around the Port of Brisbane and Brisbane Airport on the 21st
Australia's wettest November on record brought record-high November total rainfall to numerous sites in New South Wales, Queensland and South Australia. During the month, periods of heavy rainfall contributed to areas of flash flooding and riverine flooding across eastern and south-east Australia.
Significant impacts included:
- Flooding across large areas of inland New South Wales and Queensland from the 11th, with further flooding caused by renewed rainfall from the 21st to the end of the month.
- At St Arnaud, in Victoria's Wimmera, a storm cell dumped 1.5 times the monthly average rainfall in just a couple of hours on the 3rd, resulting in significant flooding and evacuations.
- Heavy rain and hail resulted in damaged crops and flooding in South Australia's Riverland on the 6th, while storms in Melbourne brought heavy rainfall to northern and eastern suburbs and caused flash flooding in some south-eastern suburbs.
- On the 9th storms caused damage to the North Coast rail line north of Rockhampton in Queensland.
- Alice Springs Airport, in the southern Northern Territory, recorded its wettest November day on record on the 10th, with the Todd River bursting its banks.
For more details see Special Climate Statement 75 Australia's wettest November on record.
Western Australia experienced heatwave conditions in late November which continued through to the start of December. The north of Western Australia continued to experience severe heatwave conditions a number of times in December, with a number of sites in the Pilbara observing their hottest December on record for either mean maximum temperature or mean minimum temperature.
Marble Bar recorded a total of 16 days with maximum temperatures of at least 45 °C in December, the highest count for December on record and the second-highest count for any month. Marble Bar also recorded 31 consecutive days above 42 degrees (from 29 November to 29 December), the longest such run since Jan–Feb 2007.
A severe to extreme heatwave affected the west coast of Western Australia in late December, with daytime and overnight temperatures peaking on Christmas Day (25th) and Boxing Day (26th). Several sites observed their highest December temperature on record or warmest December night on record. Some sites observed daily records for any time of the year. During the event, Perth observed 4 consecutive days with maximum temperatures reaching at least 40 °C, a first for December, although 4 consecutive days with maximum temperatures of at least 40 °C also occurred in February 2016 and February 1933.
Geraldton Airport recorded 6 consecutive days with maximum temperatures at 40 °C or above between the 24 and 29 December, which was its longest such run in December and the equal second-longest run for any month at Geraldton Airport (combining observations from the current site and those from the old site, extending back to 1941).
Severe winds affected broad areas of eastern Australia on 19 December as a cold front crossed south-eastern Australia, with gusts over 100 km/h recorded at a number of locations in Victoria, New South Wales, and Tasmania. Damage to trees and structures were reported across parts of New South Wales and Victoria; in Sydney's northern beaches, the State Emergency Service received almost 600 requests for assistance.
A tropical low pressure system, which intensified into tropical cyclone Seth, brought heavy rainfall to parts of the Northern Territory and Queensland towards the end of December, and generated widespread moderate to locally heavy falls across the Top End for several days. Daily rainfall records for December were set at numerous sites in the Top End of the Northern Territory between the 25th and 28th. Extreme rainfall continued in northern Queensland until the end of the month, including 345 mm at Kowanyama over two days.
Tropical cyclone Seth fell below cyclone strength on 1 January; the remnant tropical low resulted in extremely heavy rain around Gympie in the Wide Bay and Burnett region in Queensland on the 7th, with more than 400 mm recorded in Bureau gauges in the hills to the north-west of Gympie. Major flood warnings were issued for the Mary River following rainfall totals in excess of 600 mm over the catchment. Moderate flood levels were reported on the Burnett River, and flooding affected parts of Bundaberg CBD and Bundaberg South.
Severe thunderstorms on 6 January brought large hail and heavy rain to parts of Victoria around Ballarat, damaging potato and other crops, while on the 13th severe thunderstorms hit the Portland region, with the State Emergency Service called to clear almost 40 trees in the area.
In the middle of January, a very hot airmass over Western Australia and strong offshore winds blocked the usual arrival of cooler seabreezes; this drove temperatures over the Pilbara to record levels. The presence of ex-tropical cyclone Tiffany over the Top End and Kimberley contributed additional heat into the upper atmosphere over the Pilbara. On the 13th temperatures in excess of 50 °C were observed along the north-west coast. Onslow Airport recorded a maximum temperature of 50.7 °C, a high temperature record for Western Australia and equal to the highest temperature on record for Australia. The previous Western Australian record was 50.5 °C, set at Mardie on 19 February 1998. 50.7 °C was first observed in Australia on 2 January 1960 at Oodnadatta in South Australia.
Severe-intensity to extreme-intensity heatwave conditions affected the west coast of Western Australia, from the Pilbara to the Southwest coast, just after mid-January. Between the 18th and 23rd Perth Metro had 6 consecutive days of at least 40 °C, the longest run for any month in 123 years of combined observations (from the official Perth records).
From mid-January, the remnants of ex-tropical cyclone Tiffany brought heavy rain to central Australia as it moved south, forming a complex low pressure system. Widespread moderate to heavy rainfall caused ponding, overland flow, and rises in local creeks, which impacted local transport networks and necessitated lengthy detours on some transport routes. Intense rainfall across parts of pastoral and southern South Australia between the 20th and 24th resulted in flash flooding. In western and central Victoria, there were further storms, heavy rain, flash flooding, and large hail in on the 26th and 27th. Parts of South Australia received more than four times their average January rainfall. The State Emergency Service responded to more than 110 calls for help and more than 5,300 properties in Victoria’s west were left without power.
On 1 and 2 February, severe super cell thunderstorms over Brisbane city, and its outer suburbs, and Moreton Bay brought intense rainfall, downed trees, and a short-lived tornado; this resulted in delays to transport, damage to buildings, and power outages.
Heatwave conditions in the west of Western Australia contributed to Extreme to Catastrophic fire danger in early February, with ignitions across the South West Land Division on 4 February leading to multiple fires, including:
- Bridgetown in the South West, burning 5,000 hectares and destroying property, including one house
- Denmark in the South West, destroying 4 homes
- Corrigin and Bruce Rock areas in the Central Wheatbelt, burning 40,000 hectares and at least one house
- Narrogin in the Central Wheatbelt.
Later in the month one house was destroyed in Jerramungup, south-east of Perth, as fires ignited by lightning burnt through around 900 hectares on the 11th.
In Tasmania, a fire in the Franklin–Gordon Wild Rivers National Park burned through at least 300 hectares, threatening a globally significant stand of ancient Huon pines on 15 February. Rain from the 16th to 18th helped relieve what could have been a significant fire due to difficult and remote terrain.
A slow-moving low pressure trough led to heavy rain across south-eastern Queensland and parts of eastern New South Wales from 22 February to the end of the month, with further heavy rain in early March. Intense rainfall on already saturated catchments led to flash flooding and riverine flooding across large areas of south-east Queensland, the Wide Bay and Burnett, and the Sunshine Coast, as well as parts of New South Wales. Multi-day rainfall totals for the 6-days ending 9 am on 28 February were at least 2.5 times the February average rainfall across parts of south-east Queensland and north-east New South Wales, and in some parts of Queensland more than 5 times their monthly average. Totals for the 6 days were above 200 mm over a large area from the New South Wales Mid North Coast to the Wide Bay and Burnett District in Queensland. More than 30 sites reported 6-day totals in excess of 1,000 mm (1 metre of rain), with the highest totals mostly between the Gympie region and Numinbah on the Queensland/New South Wales border.
Widespread major flooding resulted across south-east Queensland, including on the Mary River at Gympie, which reached its highest levels since 1893; on the Sunshine Coast where levels similar to 1992 were reached; at Brisbane City, which exceeded the peak height of the 2013 floods; and on the Bremer River at Ipswich, which reached levels similar to 2013.
Minor to moderate flooding occurred in parts of New South Wales, including flash flooding in Sydney's western and inner western suburbs on 22 and 23 February. There was major flooding in north-east New South Wales as the system moved southward into the state overnight on the 27th and into the last day of the month. The Lismore levee was overtopped on the morning of the 28th, with the river level exceeding the March 1974 peak; as a result, numerous people required rescue.
For more details see Special Climate Statement 76 Extreme rainfall and flooding in south-eastern Queensland and eastern New South Wales.
Following on from heavy rain up to the end of February, the development of an East Coast Low at the beginning of March resulted in further heavy rain across coastal New South Wales. Rain fell upon already wet soils, full rivers and water storages. Record flood peaks occurred at Lismore on the Wilsons River, along the Tweed River, and at Coraki and Woodburn on the Richmond River. Major flooding was observed for parts of Sydney including the Hawkesbury–Nepean River at North Richmond and Windsor. Showers and thunderstorms continued to impact flood-affected areas as another East Coast Low brought widespread rainfall and renewed flooding in the second week of March.
Later in the month, storms again brought very heavy rain to the Gold Coast, with more than 300 mm recorded in 24 hours at some locations on the 28th. Major flood warnings were issued for the Myall Creek, Narran River, and Condamine River, with major flooding occurring at Dalby and Warra on the 29th. Major flood warnings were also issued for the Tweed, Richmond, Clarence, Bellinger, and Wilsons rivers. Lismore residents were evacuated after floodwater entered the city's central business district for the second time in a month, with Byron Bay, Ballina and other Northern Rivers towns also experiencing flash flooding.
For more details see Special Climate Statement 76 Extreme rainfall and flooding in south-eastern Queensland and eastern New South Wales.
The northern and central coasts of Queensland experienced severe- to extreme-intensity heatwave conditions from late February into the middle of March. Parts of the north of Western Australia and the north of the Northern Territory also experienced heatwave conditions, with severe intensity in the north-east of the Northern Territory. March temperature records were broken at several locations in each of the Northern Territory, Queensland, and Western Australia.
At the beginning of April, a moist south-to-south-easterly airstream over south-eastern New South Wales, eastern Victoria, and north-eastern Tasmania initially saw significant rain over Gippsland, with flood warnings issued for several catchments. By the 6th, the showers had moved to the New South Wales central and southern coast and adjacent inland areas. Rain falling onto already wet catchments saw a renewed period of flooding, with evacuation orders affecting more than 2,000 residents across Greater Sydney on the 7th.
Thunderstorms with heavy rain and strong winds affected south-eastern Tasmania, with gusts over 100 km/h at several locations, and some stations, mostly in the south-east, observing daily rainfall records for May in the 24 hours to 9 am on the 6th. Flash flooding was also reported, around 2,800 properties lost power, and the State Emergency Service reported just under 100 calls for assistance.
Daily rainfall records were observed across much of the eastern half of Queensland, northern Queensland, and parts of New South Wales between 10 and 14 May, with large parts of Queensland having received two to eight times the average monthly total for May by the middle of the month. Flooding affected parts of Queensland from the coastal northern tropics, to areas of the Central West, and south-east Queensland.
A cold front and associated low pressure system brought storms and wind gusts in excess of 100 km/h to south-west Western Australia from 22 May with:
- large accumulations of small hailstones reported in Kulin
- heavy rain, thunder and lightning across the Perth metropolitan area on the morning of the 23rd, and severe storm warnings from Geraldton in the north, through to the south coast and east to the Goldfields
- a tornado reported at Beenong, 300 km south-east of Perth on the 23rd
- rough seas, with dangerous winds and thunderstorm warnings and a 5 m swell off Jurien Bay on the 24th.
A deep low pressure system and associated cold front tracked across south-east Australia at the end of May, bringing cold air and "speckled" cloud in a strong south-westerly airstream behind the front. Some stations in Victoria and New South Wales observed record-low daily maximum temperatures for May, while snow was reported settling to relatively low locations across parts of the south-east, and good falls of snow were received in Alpine areas.
A cold outbreak during the first week of June brought persistent rainfall across much of Tasmania and southern Victoria, extending into the New South Wales Southern Tablelands, with maximum temperatures around 2 to 3 °C below average over large areas. In South Australia, some stations set daily records during the 24 hours to 9 am on 5 June, with heavy rainfall, flash flooding, and damaging winds over Adelaide and the Mount Lofty region. However, records were mostly set at stations with less than 30 years of observations. In the 24 hours to 9am on 6 June, totals of 60 to 80 mm were recorded in north-eastern Victoria, with Minor flood warnings issued for the Kings River. In the Alpine regions, up to 50 cm of snow was reported in 48 hours, with several ski resorts starting the season one week earlier than usual.
Where to find more information
The 2021–22 Financial year climate and water statement provides a range of climate and water information at a national level.
Climate summaries are produced for each month and season, for Australia nationally and for the states and most capital cities. Special Climate Statements are produced on an occasional basis, and provide a detailed summary of weather/climate events which are unusual in the context of the climatology of the affected region.
More detailed water information for eleven nationally significant water management regions is provided in the National Water Account. You can also access data used in this report through Regional Water Information. The Monthly Water Update provides a regular snapshot of rainfall, streamflow, stream salinity and storage volumes for ten of Australia's 13 drainage divisions. The Groundwater Information Suite provides data on bore water levels and trends, and associated data on hydrogeology and groundwater management.
Data information
For more information, find area average data and timeseries for the financial year period, with maps for the 12-months periods ending June available from recent conditions.
Data currency
All values in this statement were compiled from data available on the issue date. Subsequent quality control and the availability of additional data may result in minor changes to final values. The use of current and historical climate information allows for comparison of climate impacts from one year to the next and aligns with other reporting processes that occur over financial year periods.
Data sources
The Bureau collects, manages and safeguards Australia's climate data archive. Several datasets have been developed from this archive to identify, monitor and attribute changes in the Australian climate.
This statement was prepared using the following sources:
- Rainfall from the Australian Gridded Climate Dataset (AGCD) analyses.
- Temperature from Australia Water Availability Project (AWAP) analyses.
- Area-average time series for the financial year are calculated from the homogenised Australian temperature dataset (ACORN-SAT) and AGCD monthly rainfall.
- Root-zone soil moisture from Australian Water Resources Assessment Landscape model (AWRA-L) 7.0 analyses.
- Water storage information and the Murray-Darling Basin Information Portal.
- Sea surface temperature from the ERSSTv5 dataset.
A note on base periods
In climatology a baseline, or long-term average, is required against which to compare changes in climate over time. Use of the 1961–1990 base period for reporting anomalies follows international conventions set by the World Meteorological Organization.
A period of minimum 30 years is required to form a robust climatological average, accounting for decadal variability. In general, baseline climatological periods try to make use of the period with the best data coverage. The 1961–1990 period is used globally as it coincides with consistent national temperature records observations and allows comparison across countries. However alternate averaging periods are also used for other purposes, such as facilitating comparison to a more recent period for climate outlooks, or to the pre-industrial period for long-term climate change.
Product code: IDCKGC6AR0
Downloads
- Statement as PDF
- Interactive timeseries graphs as .png files
- Water storage levels graphs as .png files
- Data sources are listed in sections including the About section