National Water Account 2015

Canberra: Region overview

The region is located in the upper reaches of the Murrumbidgee River catchment, which is the main source of its water supply. It covers the Australian Capital Territory and parts of New South Wales. The city of Canberra is the largest urban centre within the Murray–Darling Basin.

Rainfall

Rainfall icon

824 mm

2% more than last year   
> long-term average

Storage

Storage icon

80% full

3% more than last year   
282,898 ML total capacity

Streamflow

Streamflow icon

Queanbeyan River
Molonglo River*
Cotter River*

below average*

similar to last year

calendar icon showing water year from 1 July 2014 to 30 June 2015

WATER SOURCES

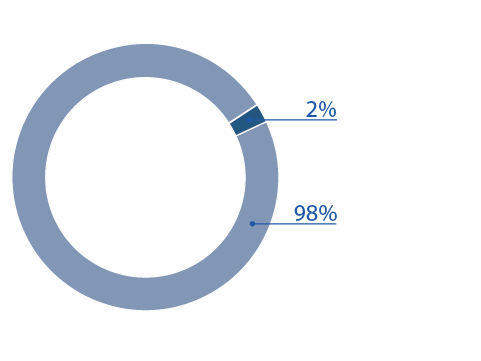
Graph showing breakdown of water sources use in the Canberra region for the 2014–15 year. 48,768 megalitres of surface water was diverted or approximately 98% of total water sourced; Groundwater extracted was 1,061 megalitres or 2% of total water sourced.

Groundwater

Surface water

49,829 ML

total water used

2% less than last year

WATER ACCOUNTING STATEMENTS

Water accounting statements icon

Assets

266,085 ML

3%

Icon showing in 2014-15 water assets increased by 3% from 2013-14.

Liabilities

0 ML


Inflows

819,398 ML

27%

Icon showing in 2014-15 water inflows increased by 27% from 2013-14.

Outflows

698,275 ML

29%

Icon showing in 2014-15 water outflows increased by 29% from 2013-14.

Net change

6,995 ML


Icon showing direction (increase) of net change in water assets in 2014-15.

WATER USE

Surface water diversion icon

48,768 ML

surface water diverted

2% less than last year

Groundwater extraction icon

1,061 ML

groundwater extracted

19% more than last year

Urban supply icon

47,115 ML

supplied to urban system

3% less than last year