


Adelaide: Key findings
For the water account period 1 July 2017–30 June 2018
- Despite high rainfall in July–August 2017, rainfall for the year was below average.
- Relatively poor rainfall for most of the year resulted in the first annual decrease in surface water storage in three years.
- The decrease in the region's surface water availability meant inter-region transfer from the River Murray increased from last year to meet urban demand.
Climate and water


Water use
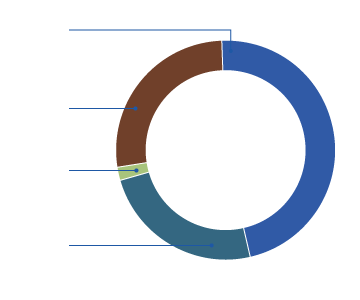
Water supplied

231,508 ML
urban system
70%
irrigation
2%
individual users
28%
Water status
Allocations
253,923 ML
total surface water and groundwater allocations
Water assets
178,755 ML
water assets at 30 June 2018

18,778 ML less than last year
Outlook
Decrease
in storage expected during the 2018–19 year