


Border Rivers: Supporting information
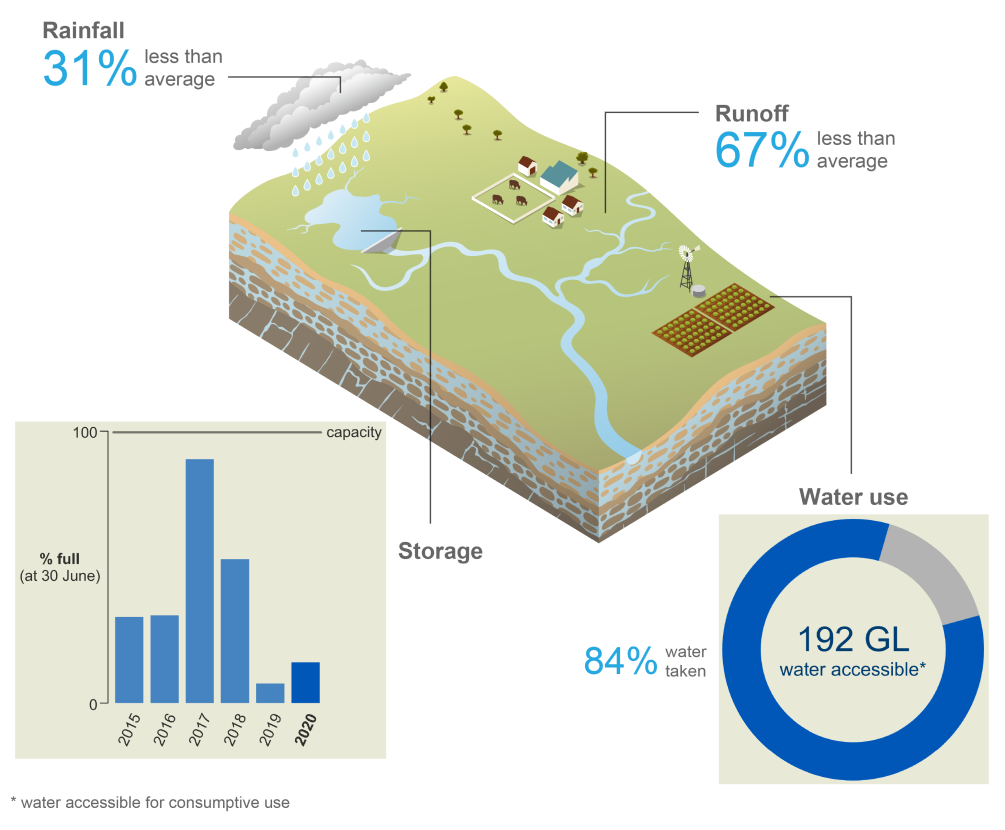
- Dry conditions contributed to low runoff and storage inflows across the region.
- End-of-year storage volume increased to 15% full due to high rainfall in February 2020.
- 84% of the water accessible for use was taken, primarily for irrigation and agricultural purposes.
For further information on the region's water accounting statements scroll down this page or click on the links below:
Water assets
")
- Water asset volumes in the region at 30 June 2020 were 178 GL, more than half of which is water held in storages. The remaining amount is water held in rivers and aquifers.
Storages
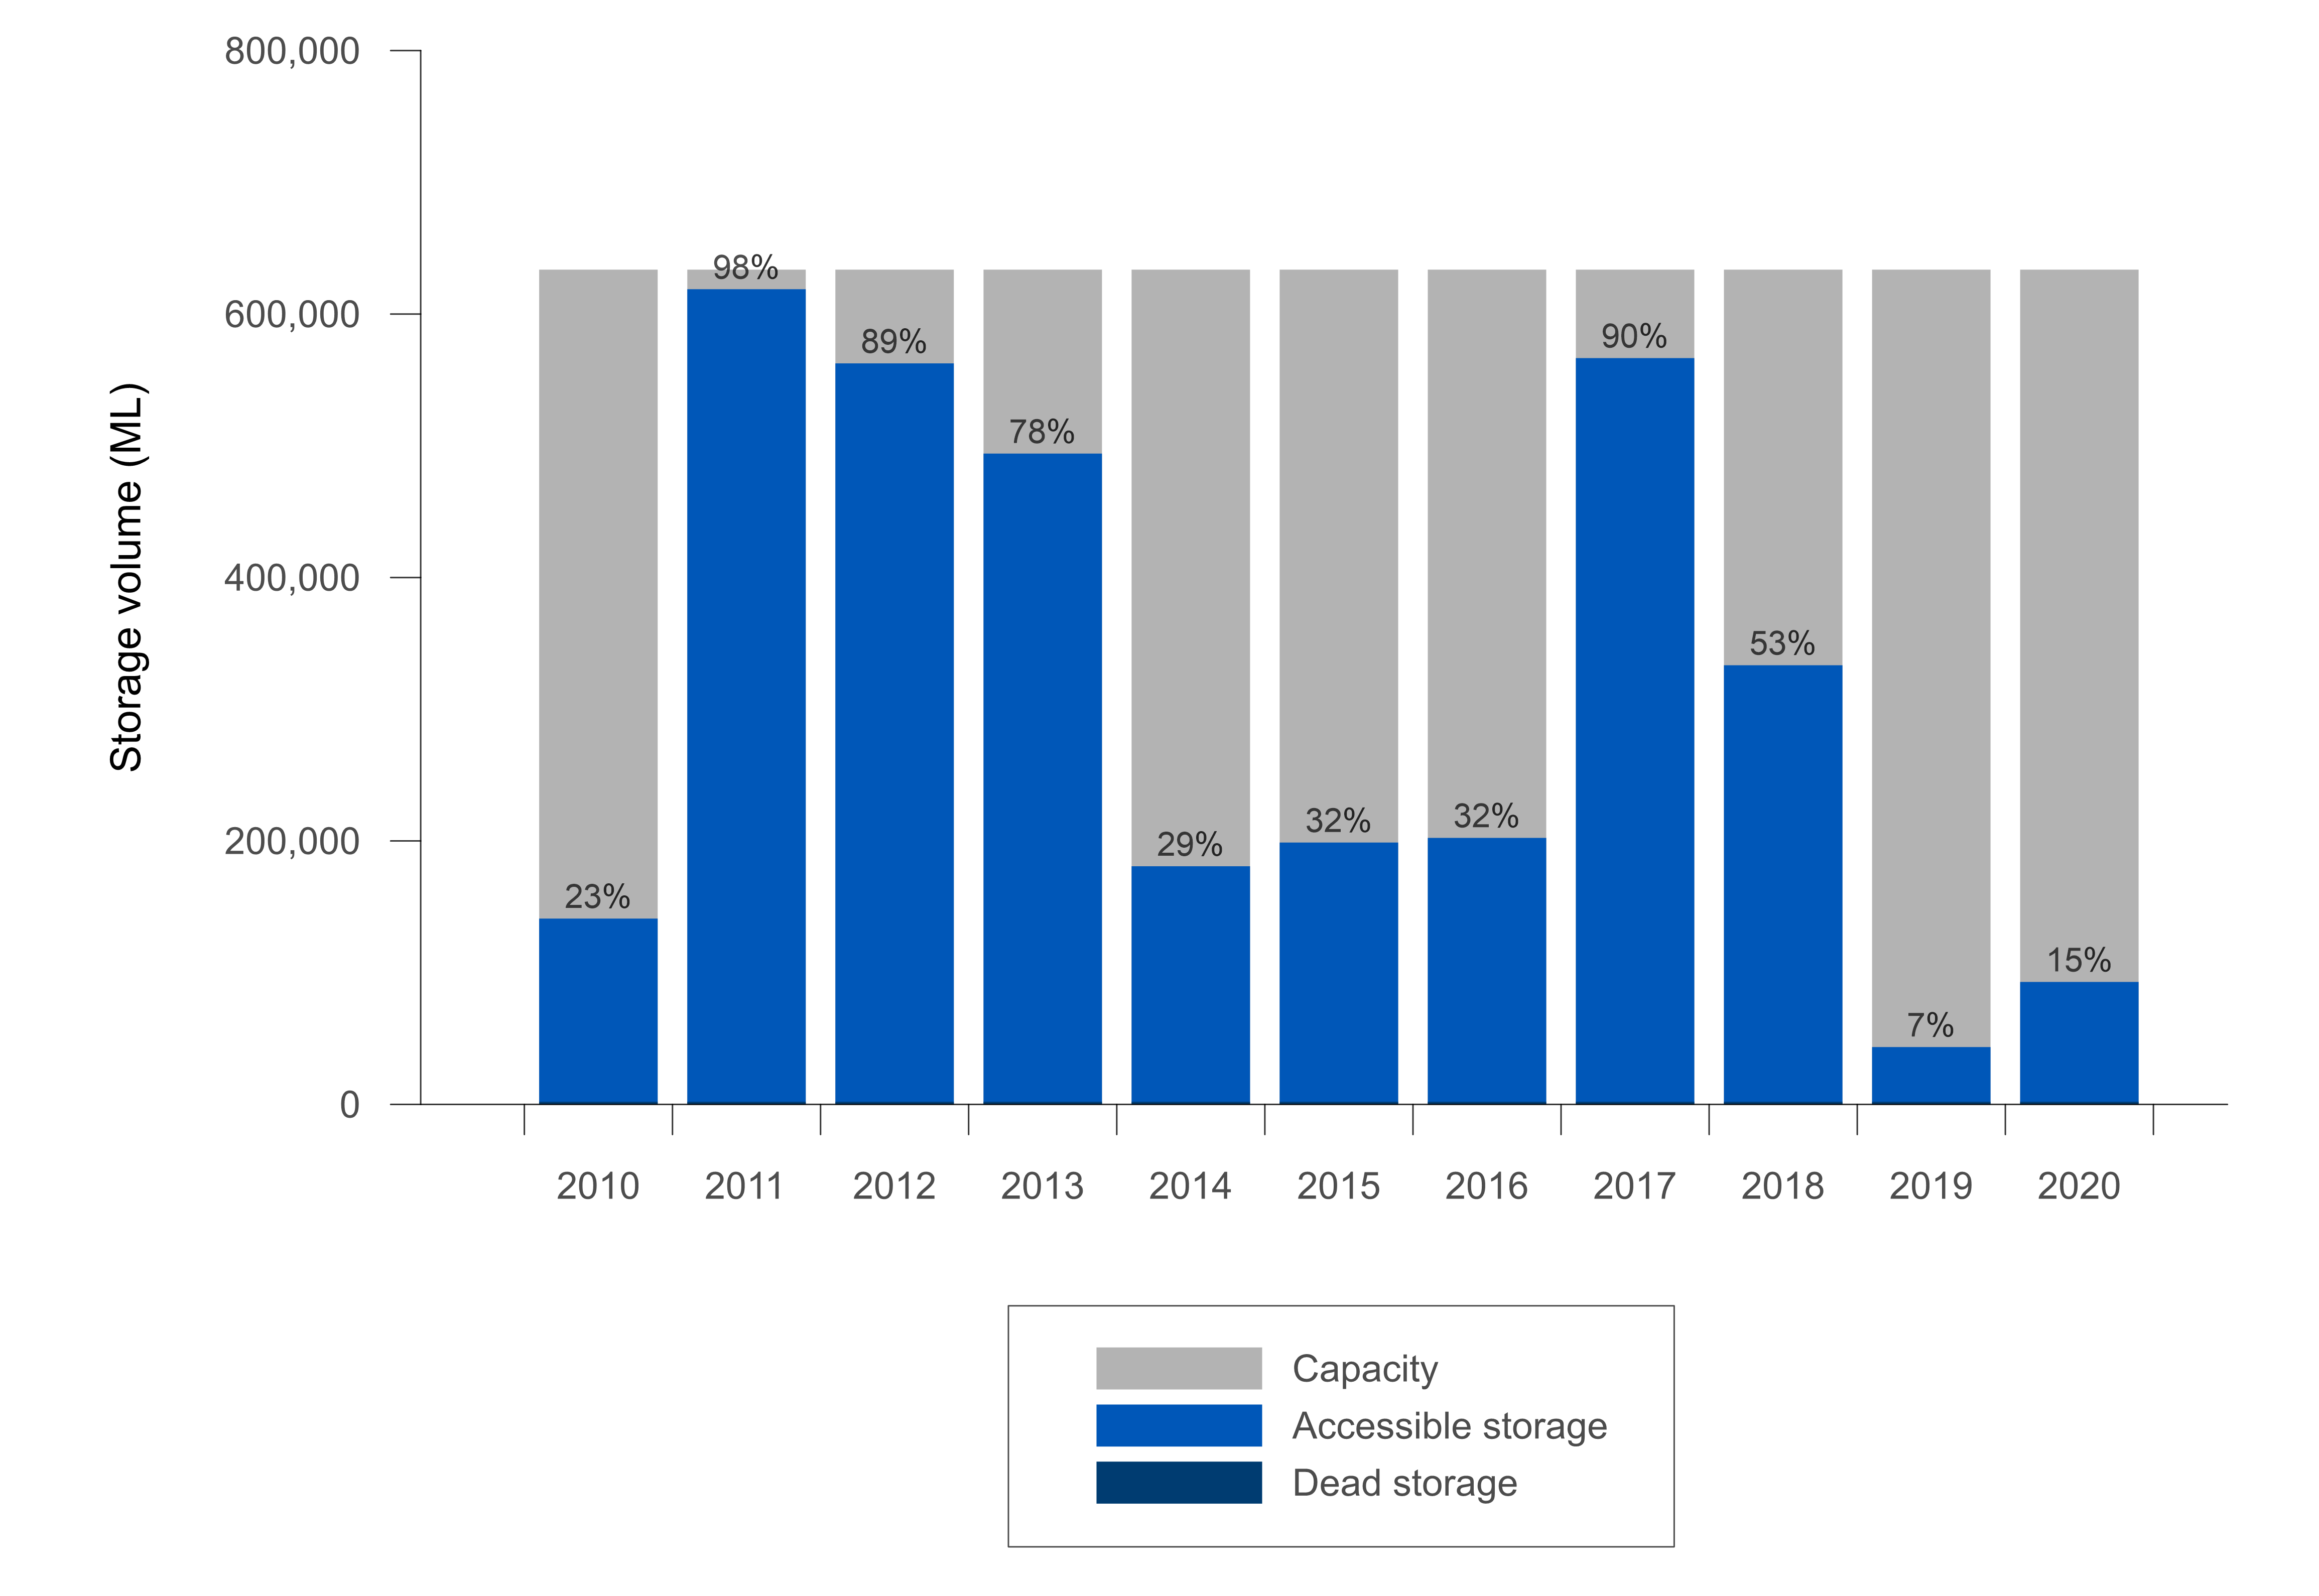
Figure S1 Total storage volume in the catchment at 30 June 2020 compared with the previous 10 years
- Storage volumes increased from 7% full at 30 June 2019 to 15% full at 30 June 2020, the first annual increase in storage in three years.
- Despite below-average annual rainfall in 2019–20, the increase in storage volume was influenced by higher storage inflows following heavy rainfall in February 2020.
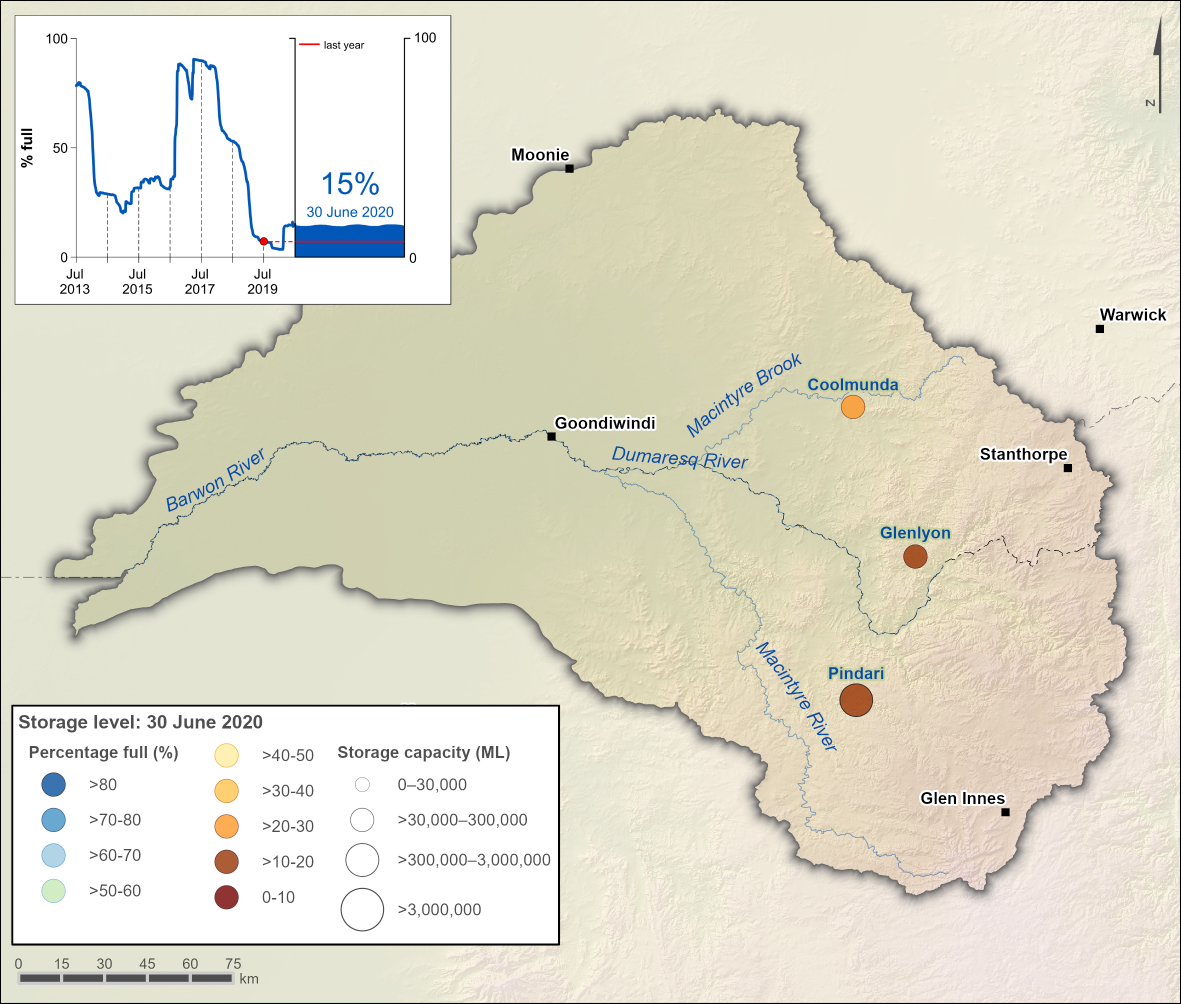
Figure S2 Percentage-full volume on 30 June 2020 for each storage and total storage volume from 2013–2020 (inset)
- In early February 2020, combined water storage in the catchment had dropped to less than 4% of capacity, the lowest level since January 1995.
- High rainfall associated with a coastal trough that crossed the region in February 2020 resulted in a rise in storage levels. This was the first significant rise in storage since March 2017.
- Glenlyon and Pindari storages were slightly less than 15% full at 30 June 2020; Coolmunda was just below 30% full.
- More detailed information on the individual storages within the region is available on the Bureau of Meteorology's Water Storage website.
Aquifers
- The volume of groundwater storage for the catchment represents sustainable diversion limit volumes as provided by the Murray–Darling Basin Authority.
- The groundwater storage at the end of the year was the same as the previous year, reflecting no change to the sustainable diversion limits.
Water flows
")
- Total surface water flows into the region's storages was 443 GL. The key item contributing to surface water inflows was runoff, which made up more than 90% of the total surface water inflows.
- For the third consecutive year, runoff was much lower than average (based on modelled data from 1971–2020) due to poor rainfall across the catchment.
- Outflow is typically one of the catchment's larger flows. In 2019–20, it made up around a quarter of the total surface water outflows; however, outflow was well below average due to the dry conditions and low runoff across the region.
- Water taken from surface water and groundwater resources for consumptive use (not including water diverted to the environment) was 160 GL, almost half of the total outflow (see Water use section below).
Water use
")
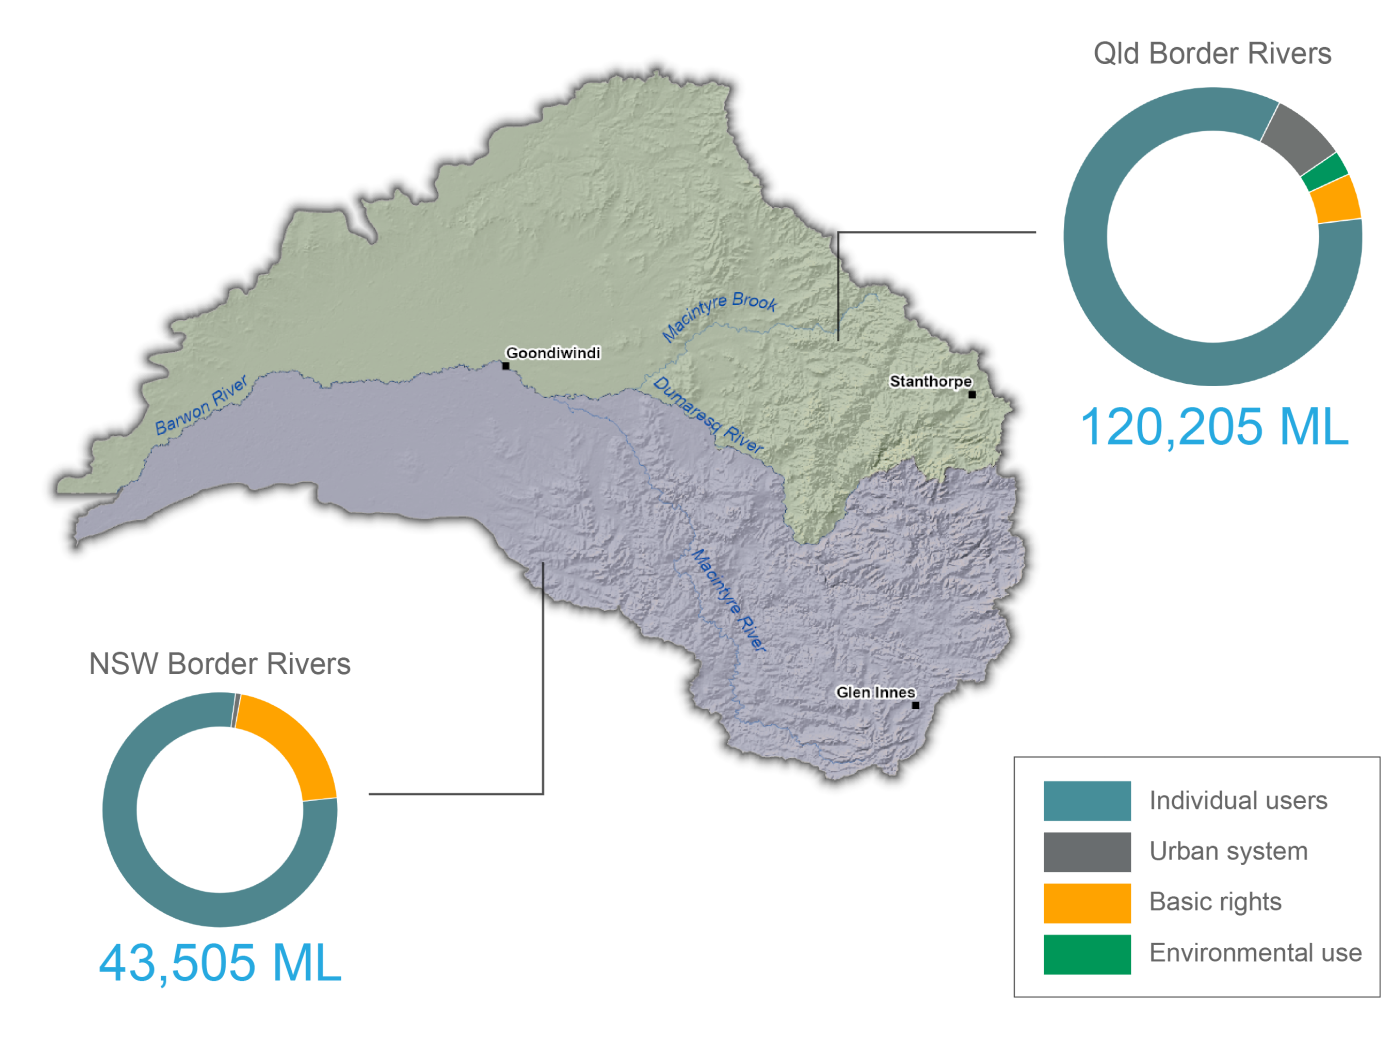
Figure S3 Water use during the 2019–20 year within the catchment's water resource plan areas
- Total water taken in the catchment was 164 GL.
- 83% of the water used was for individual users, mostly for irrigation and agricultural purposes, and 9% of the water use was for individual users under a basic right.
- 2% of the water use was for an environmental benefit, all from the Queensland Border Rivers Water Resource Plan area, while 6% of the water taken was for town supply.
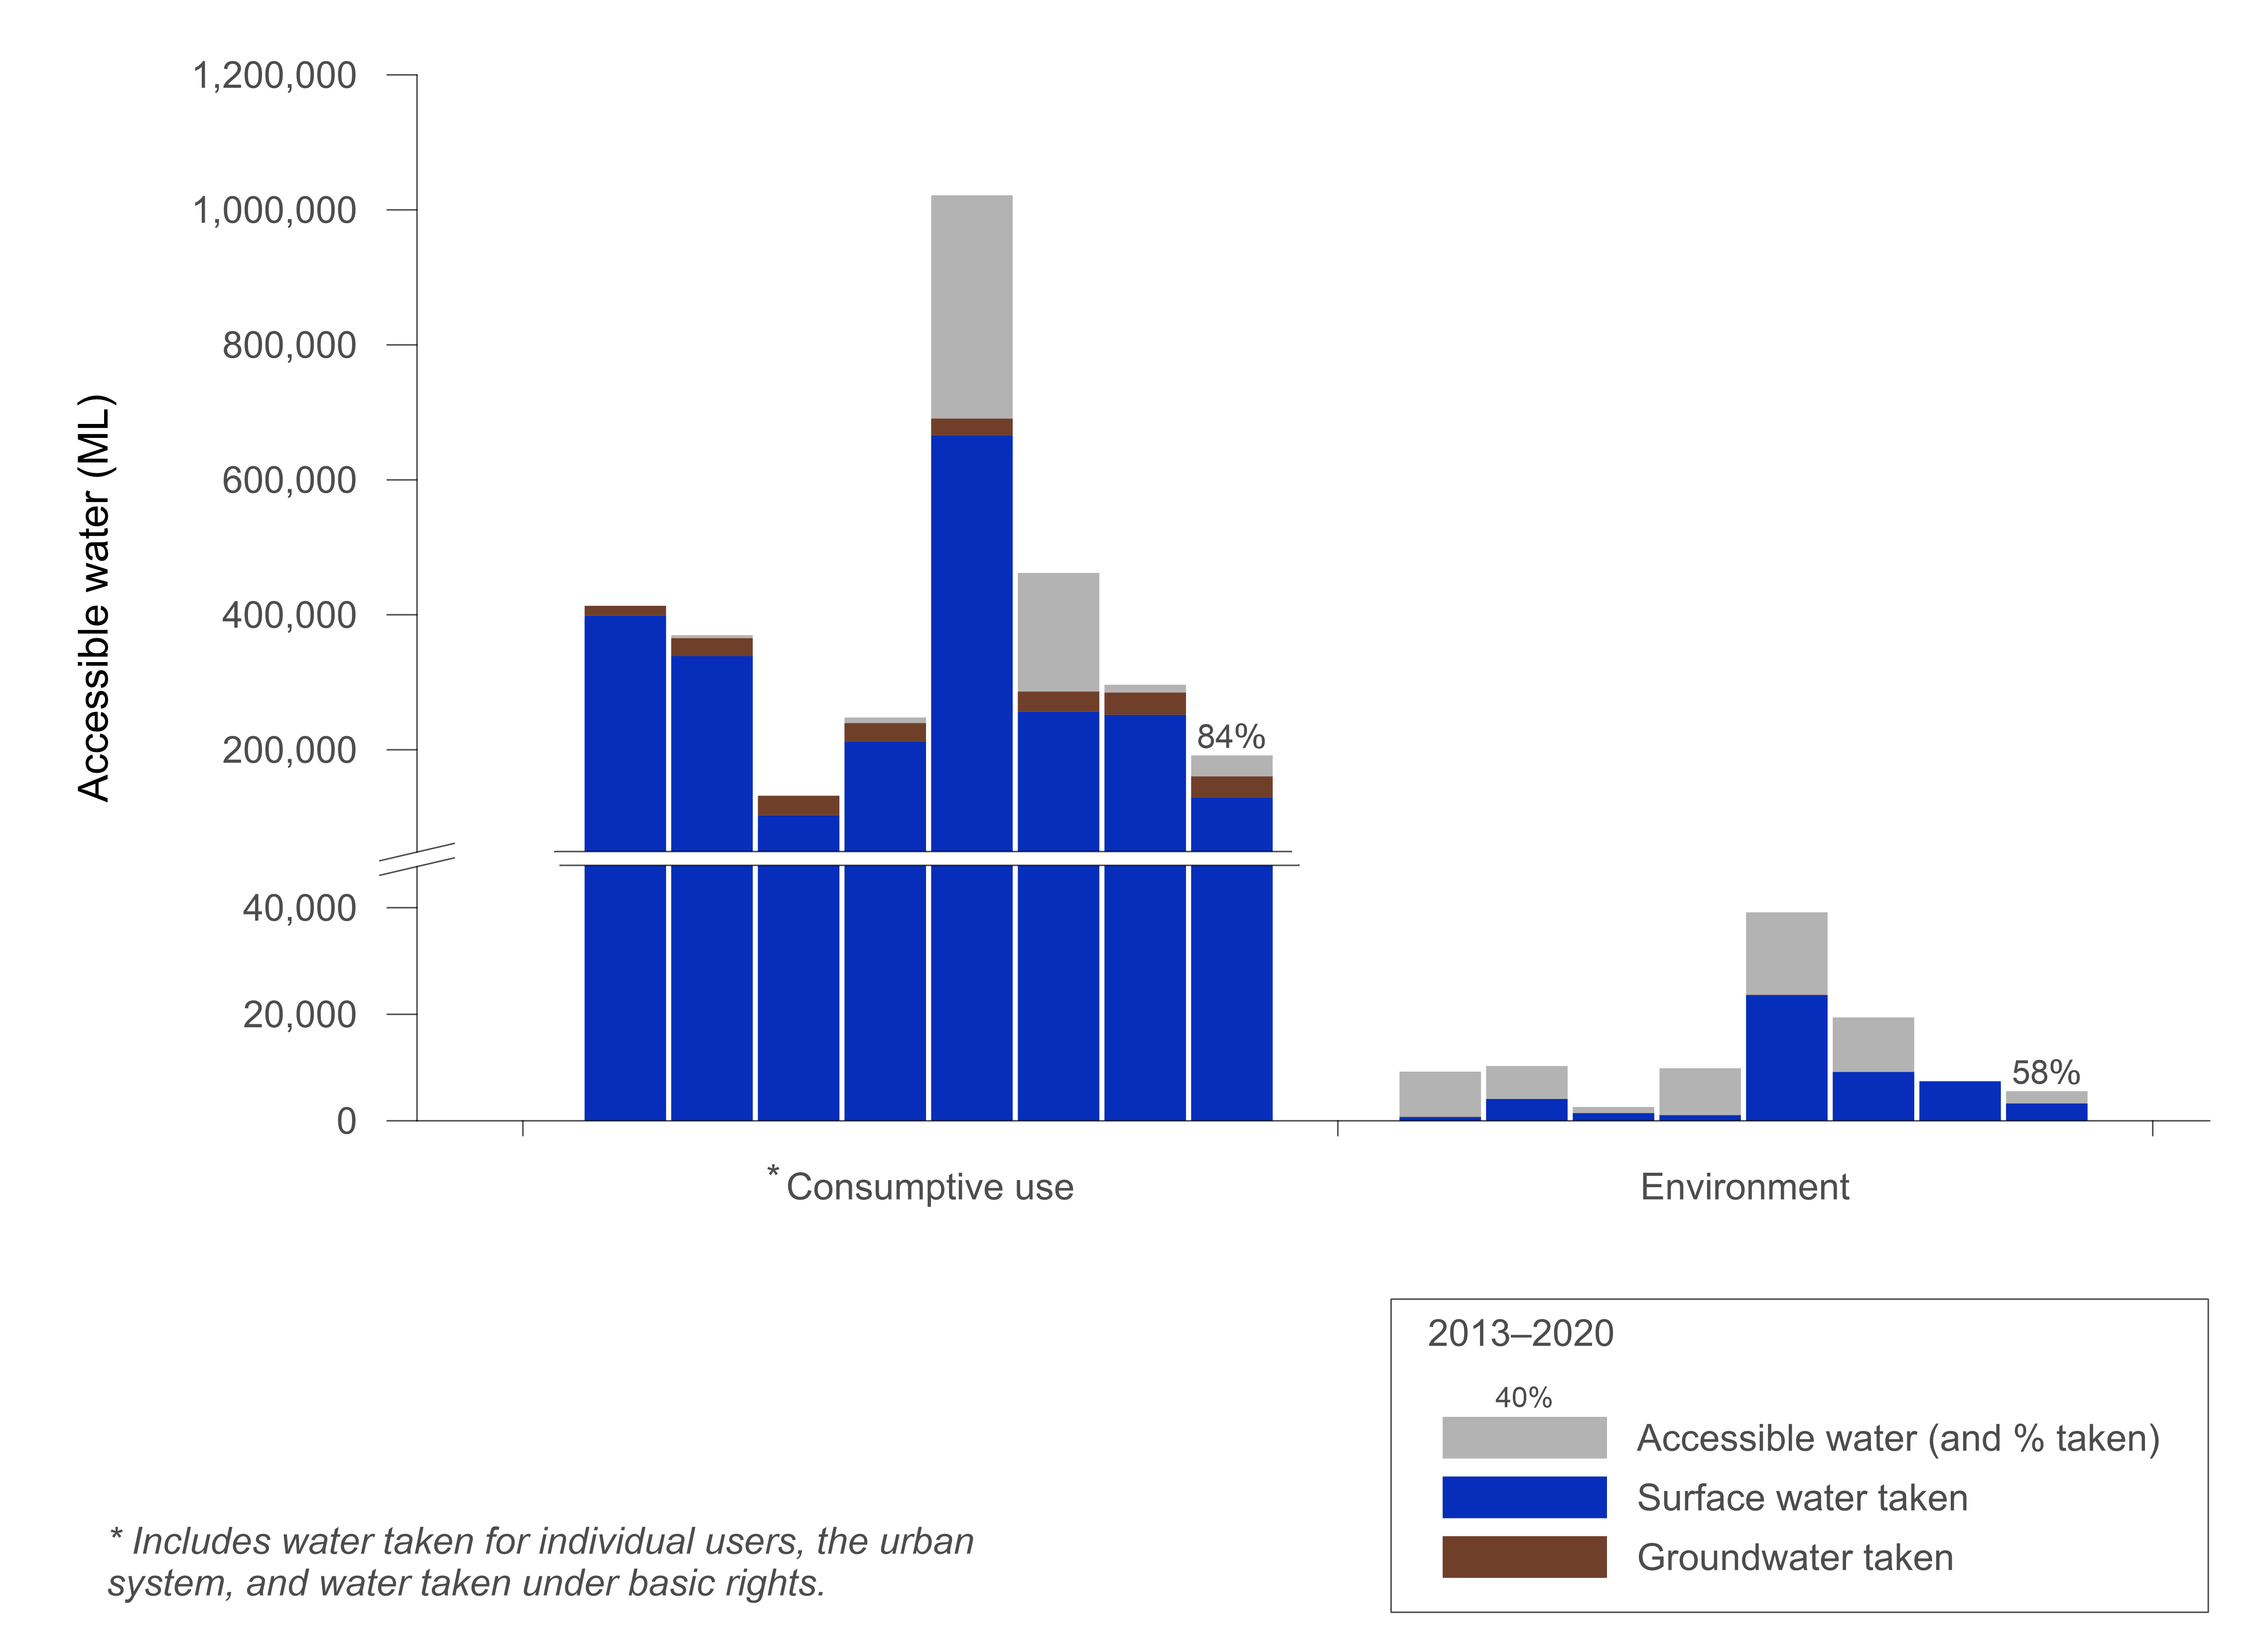
Figure S4 Accessible water and abstractions in the Border Rivers catchment for the years ending 30 June, from 2013–2020
- Accessible water is the volume of water in storages, rivers, and aquifers that is lawfully accessible for consumptive use. It is based on the volume of carryover of water entitlements from the previous year and announced allocations during the year.
- 84% of the accessible water was taken in 2019–20 (160 GL), mostly from surface water resources.
- Water accessible for consumptive use, as well as the actual water taken, was lower than the previous few years due to the continued dry conditions, particularly during the latter part of 2019.
- The volume of water accessible for environmental use, which is also based on the volume of carryover of water entitlements from the previous year and announced allocations during the year, is around 3% of the water accessible for consumptive use.