


Burdekin: Key findings
For the water account period 01 July 2021 – 30 June 2022
- Total annual rainfall for the 2021-22 year was above average for the second consecutive year.
- High rainfall totals during November 2021 and May 2022 resulted in the end-of-year storage volume increasing to 99% full from 97% the previous year.
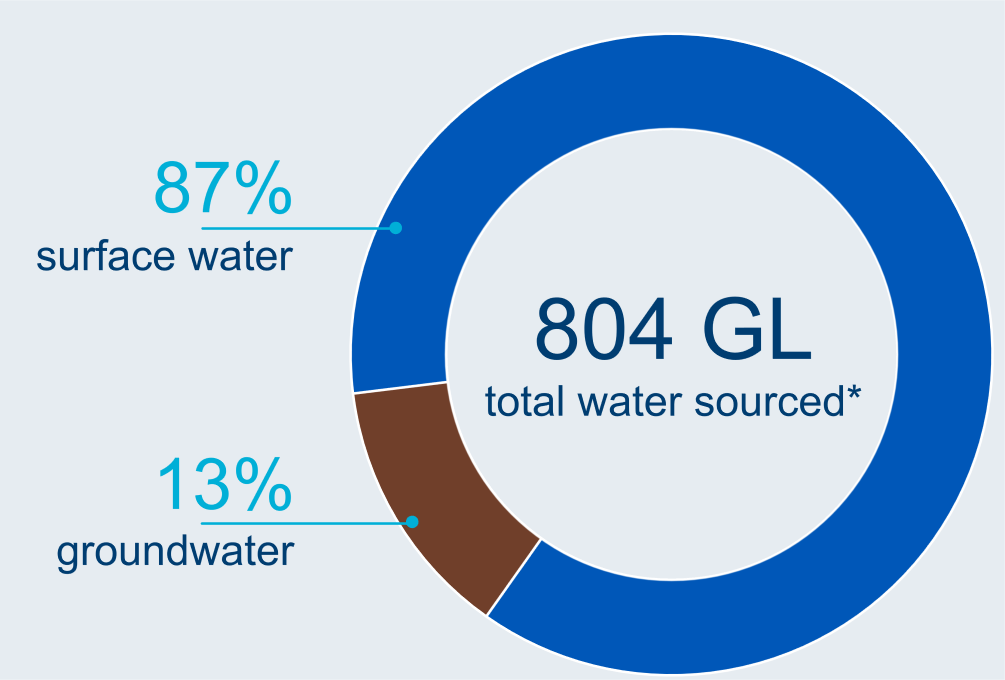
- Water taken from surface water and groundwater resources for consumptive use was 804 GL, 5% less than last year.
Climate and water
Rainfall

742 mm
13% above the average of 657 mm
Streamflow

below average
for most of the year
Storage

99% full

2% more than last year
Water use from all sources
Water sourced
Water supplied
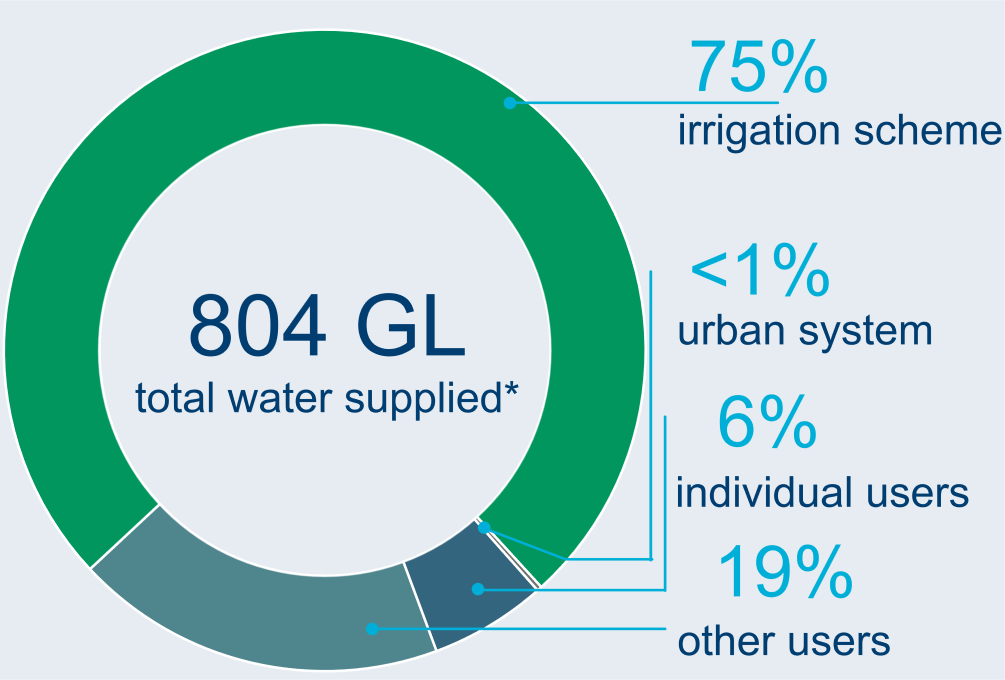
* Includes non-allocated water use
Water status of water resources
Water availability
8,403 GL
total surface water available in 2021–22

31% less than last year
Water accessible
1,585 GL
total surface water and groundwater accessible in 2021–22
slightly less than last year
Water taken
804 GL
total surface water and groundwater taken in 2021–22 year
5% less than last year