


Daly: Climate and water
Annual rainfall in the region was above average, which is largely attributed to a storm event that occurred during 25–26 December 2015. Areas in the lower part of the Daly region experienced more than 460 mm of rainfall in the 48-hour period, equivalent to a 1-in-100-year rainfall event, which resulted in a major flood in the Daly River. Yet rainfall and streamflow during the typically wettest part of the year were below average.
Introduction
The Daly region lies within the wet–dry tropics of northern Australia, which has a distinct and predictable climatic seasonality. Almost all rainfall in the region occurs during the wet season (November–April). As a consequence, flow in the rivers is strongly seasonal.
Although the majority of the annual flow in the region's rivers occurs during the wet season, the Daly River system is one of the few in northern Australia to have perennial flow. The dry-season flow (May–October) is mostly dominated by input of groundwater from the two underlying limestone aquifers, Tindall and Oolloo (see Water resources in 'Region description' for more information).
Climate conditions
Rainfall
In general, below-average rainfall conditions were experienced across much of northern Australia during the 2015–16 year. Climate across Australia was largely influenced by strong El Niño conditions in the Pacific Ocean, one of the strongest El Niño events since 1950. During September–November, in the months leading up to and into the early part of the wet season, Australia's climate was also influenced by a positive phase of the Indian Ocean Dipole, which also contributed to the relatively dry conditions throughout northern Australia.
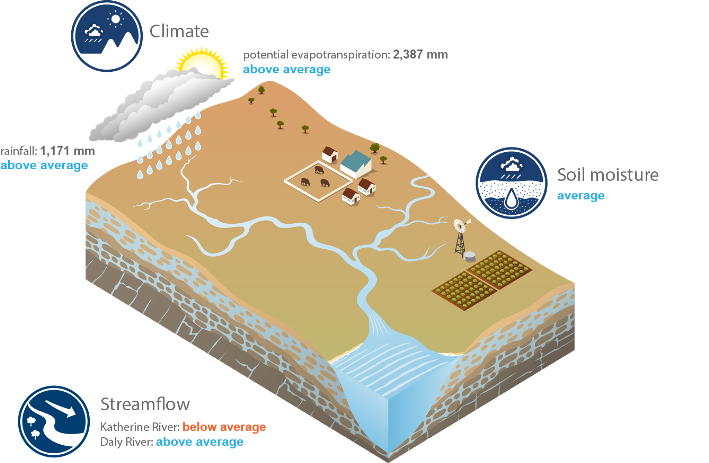
The Daly region was one of the few areas in northern Australia where annual rainfall was above average. Total area-averaged rainfall over the Daly region during the 2015–16 year was 1,171 mm, which is above the long-term area-averaged rainfall of 1,034 mm (based on the 1900–2016 period). Rainfall ranged from more than 1,200 mm in the northwest to less than 900 mm along the eastern parts of the region (Figure C1).

Figure C1 Total annual rainfall for the Daly region during the 2015–16 year
Rainfall across most of the southern and western portions of the region was above average for the 2015–16 year; rainfall in the northeast of the region was below average (Figure C2).
Figure C2 Annual and monthly rainfall deciles for the Daly region during the 2015–16 year
The above-average annual rainfall across the Daly region during the 2015–16 year is largely attributed to a single storm event that occurred 25–26 December 2015. This event also contributed to the highest monthly rainfall total for December on record (Figure C2). Most of the rainfall during this event occurred in the lower Daly region. Around the township of Nauiyu (Daly River), more than 462 mm of rainfall was observed during the 48-hour period, which is equivalent to a greater than 1-in-100-year rainfall event. This event is described in more detail in the Significant water events section below.
During the typically wettest months of the year (January–March), the region experienced below-average rainfall (figure C2–C3). This was the second year in a row that rainfall has been below average during the typically wet months of the year (see the 2015 Account).

Figure C3 Total monthly rainfall for the Daly region during the 2015–16 year compared with the long-term average and percentiles for the region
Evapotranspiration
The total area-averaged potential evapotranspiration over the Daly region during the 2015–16 year was 2,387 mm, which is above the long-term area-averaged potential evapotranspiration of 2,324 mm (based on the 1911–2016 period). Potential evapotranspiration was relatively uniform across the region but marginally higher in the southern parts (Figure C4).
Typical of the climate conditions across northern Australia, annual potential evapotranspiration over the Daly region is much greater than the total annual rainfall. This means that on an annual basis the landscape is generally dry and can be described as water-limited (CSIRO 2009b). Only during high-rainfall periods in the wet season does rainfall exceed potential evapotranspiration, which drives the seasonal streamflow.

Figure C4 Total annual potential evapotranspiration for the Daly region during the 2015–16 year
Potential evapotranspiration across the majority of the Daly region was very much above average for the 2015–16 year (Figure C5), which may be attributed to the decreased rainfall (and hence cloud cover) that occurred during the typically wettest months of the year (January–March).

Figure C5 Annual potential evapotranspiration deciles for the Daly region during the 2015–16 year
Soil moisture
Soil moisture in the root zone (0–1 m depth) for the 2015–16 year was above average in the southern parts of the region and generally average across the remainder of the Daly region, compared with the 1911–2016 period (Figure C6).
Figure C6 Annual and monthly soil moisture deciles in the root zone (0–1 m depth) for the Daly region during the 2015–16 year
Similar to rainfall, soil moisture was below average for the majority of the year (Figure C6). Soil moisture was only above average across most the region for 2 months of the year (December 2015–January 2016), which can be attributed to a single storm event that occurred over the region during 25–26 December 2015 (see Significant water events below).
More information on soil moisture distribution across the Daly region is available in the Australian Landscape Water Balance.
Streamflow responses
Significant water events
A high magnitude flood event occurred in the region during a 2-week period from late-December 2015 to early-January 2016 (Figure C7). On 1 January 2016, flow in the Daly River peaked just below 6,000 m3/s, one of the larger flood peaks recorded along the Daly River. This event was attributed to a tropical low that formed over the lower part of the Daly region in late-December. At a rain gauge near the township of Nauiyu (Daly River), more than 462 mm was recorded during the 48-hour period between 25–26 December. According to the Bureau of Meteorology's Design rainfall website, this is equivalent to a greater than 1-in-100-year rainfall event.
Flood classifications have been assigned to flows in the Daly River based on river levels that would inundate the town of Nauiyu. During the flood event from late-December 2015 to early-January 2016, major flood levels in the Daly River were exceeded for almost 2 weeks. The entire township of Nauiyu (population of approximately 500 people) was evacuated for the duration of this event. More than 55% of the total annual flow in the Daly River occurred during the 2-week flood (Figure C7).

Figure C7 Flood event in the Daly River during the 2015–16 year
This rainfall-runoff event contributed to record monthly flows in the Daly River during December–January (see Streamflow section below).
Streamflow
The Katherine and Daly rivers are two primary rivers within the Daly region. The location of key gauging stations at Mount Nancar (G8140040) and the Katherine Railway Bridge (G8140001) along these rivers are provided in Figure R5 in 'Region description'.
In both the Katherine and Daly rivers, above-average monthly flows occurred in December–February, during the early part of the wet season. For the remainder of the wet season, flow was well below average, particularly the 2-month period between March and April when the majority of the total annual flow usually occurs in the region (figures C8–C9).
The very high monthly flows during December–January were primarily attributed to the single rainfall event that occurred in late-December (see Significant water events). The majority of the rainfall associated with this event occurred downstream of Katherine. Consequently, flows in the Daly River during this event were relatively much higher than flows experienced in the Katherine River (figures C8–C9). The monthly flows in the Daly River during December and January were the highest on record for those months.
Total annual streamflow in the Daly River was above average; annual streamflow in the Katherine River was below average, which reflects the annual rainfall pattern across the region during the year (Figure C2).

Figure C8 Total monthly flow along the Katherine River compared to long-term average and percentiles for the river

Figure C9 Total monthly flow along the Daly River compared to long-term average and percentiles for the river
Major water reforms
No major water reforms occurred in the Daly region during the 2015–16 year.