Daly: Water stores
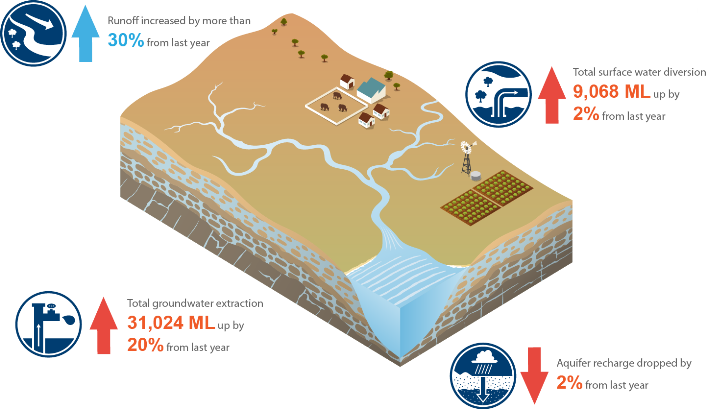
These notes provide a water balance for each of the region's water stores for the 2015–16 year. A storm event in late December caused major flooding across the region and contributed to an increase in annual runoff from the previous year. Yet relatively poor rainfall during January–March, the typically wettest months of the year, resulted in a decrease in aquifer recharge and contributed to an increase in water use during the year.
Surface water store

The water balance for the Daly region's surface water store is provided in Table S5. The volume of surface water in the region at 30 June 2016 could not be quantified, but was assumed to remain unchanged from the volume at the start of the 2015–16 year (Table S5).
| 2016 ML | 2015 ML | |
| Opening surface water store | – | – |
| Inflows | 9,429,219 | 7,540,191 |
| Outflows | (9,677,881) | (4,117,414) |
| Balancing item | 248,662 | (3,422,871) |
| Closing surface water store | – | – |
A schematic diagram representing all surface water inflows and outflows during the 2015–16 year is provided in Figure S2.
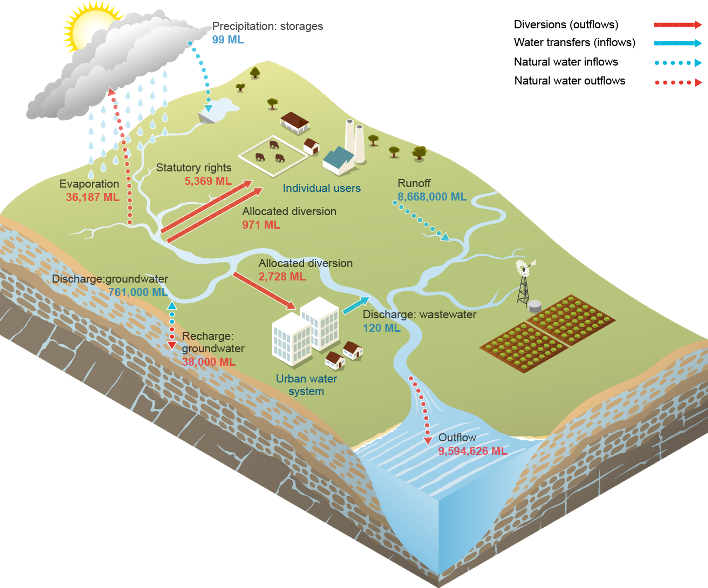
Figure S2 Water inflows and outflows for the surface water store during the 2015–16 year
Surface water inflows
The largest natural water inflow in the region was runoff, which was almost a third more than the previous year. The increased runoff is primarily attributed to a single storm event in late December that caused major flooding across the region (see Climate and Water). Precipitation on Copperfield Dam was 99 ML, similar to the previous year. The remaining natural surface water inflow (discharge: groundwater) was less climate-dependent and decreased compared with the previous year.
The only water transfer in the region (discharge: wastewater) was relatively minor and changes little from year to year.
Surface water outflows
The largest natural water outflow was river outflow, which was more than double that of the previous year. More than half of the outflow occurred in just a 2-week period early in the wet season, when a large storm on 25–26 December resulted in a major flood event in the Daly River (see Climate and water).
Evaporation during the 2015–16 year, which includes 36,000 ML from rivers and 187 ML from Copperfield Dam, was relatively similar to the previous year. Recharge: groundwater has been relatively low over the previous four years.
Total surface water diverted in the region (9,068 ML) increased marginally from the previous year. Diversion: statutory rights (5,369 ML) accounted for approximately 60% of the total diversion in the region. Allocated diversion: urban system (2,728 ML) and allocated diversion: individual users (971 ML) accounted for approximately 30% and 10% of the total diversion, respectively. The volume of allocated water diverted from each river is shown in Figure S3.
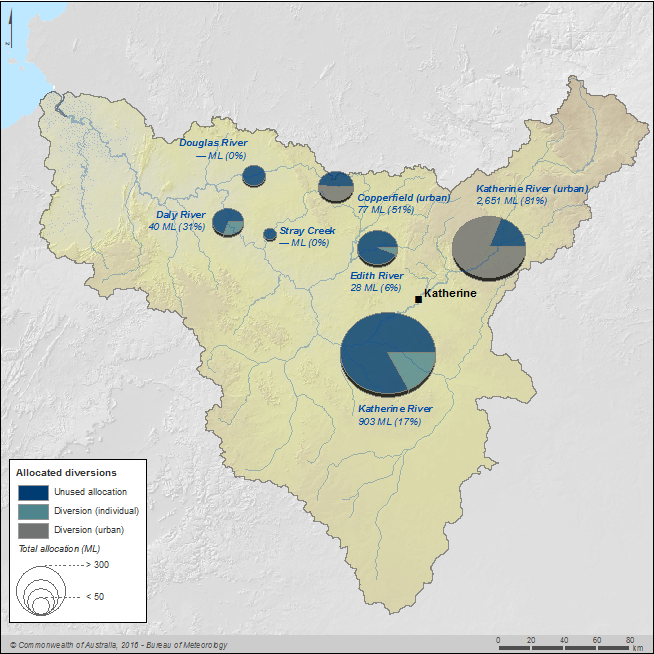
Figure S3 Allocated water diversions during the 2015–16 year; percentage of allocation diverted is also shown
For a more detailed description of the water usage in the region, and the associated entitlements, see the Surface water rights note.
Surface water balancing item
The calculation of the surface water balance (Table S5) yielded a balance of 248,662 ML, which is less than 3% of the total surface water inflows during the year.
It is likely that the balancing item is primarily attributed to uncertainties associated with the runoff estimation (a large source of surface water increase). Runoff is estimated from a rainfall–runoff model (see Methods) and it is reasonable to expect a relatively high uncertainty around this volume. The balancing item for the 2015–16 year was much lower than that for the previous year (Table S5), which likely reflects a more accurate estimation of runoff relative to last year's estimate.
Groundwater store

The water balance for the Daly region's groundwater store is provided in Table S6. The volume of groundwater in the region at 30 June 2016 could not be quantified; however, the change in groundwater storage during the 2015–16 year was estimated.
| 2016 ML | 2015 ML | |
| Opening groundwater store | – | – |
| Inflows | 418,000 | 428,000 |
| Outflows | (792,024) | (1,035,600) |
| Change in groundwater store | 336,000 | 592,000 |
| Balancing item | 38,024 | 15,600 |
| Closing groundwater store | – | – |
A schematic diagram representing all groundwater inflows and outflows during the 2015–16 year is provided in Figure S4.
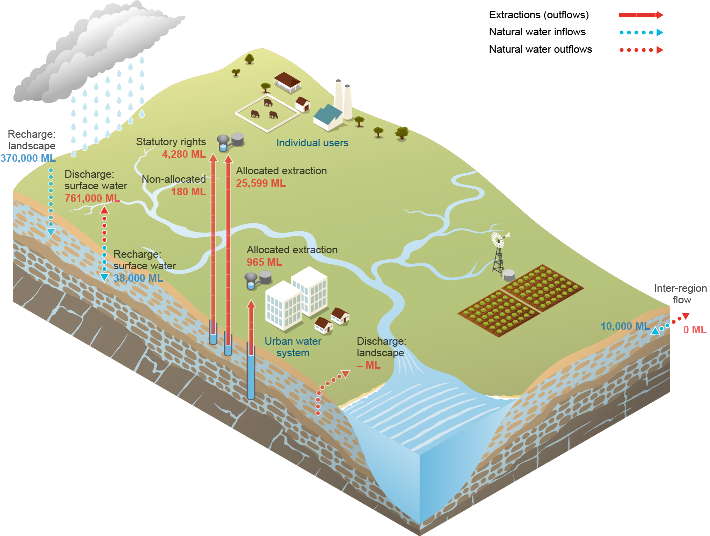
Figure S4 Water inflows and outflows for the groundwater store during the 2015–16 year
Groundwater inflows
Almost 90% of the total groundwater inflows are attributed to recharge: landscape. Recharge from the landscape has been relatively similar for the previous four years and consistently lower than the discharge from the aquifers. The relatively low recharge volumes have contributed to the drop in aquifer storage over the last four years.
Similar to the recharge from the landscape, recharge: surface water has also been relatively low over the previous four years. Inter-region inflow changes little from year to year.
Groundwater outflows
The largest water outflow was discharge: surface water, which made up more than 96% of the total groundwater outflows.
The remaining outflows relate to groundwater extraction. Total groundwater extracted in the region (31,024 ML) increased by approximately 20% from the previous year. Allocated extraction: individual users (25,599 ML) and allocated extraction: urban system (965 ML) accounted for approximately 83% and 3% of the total extraction, respectively. The volume of allocated water extracted from each aquifer is shown in Figure S5.
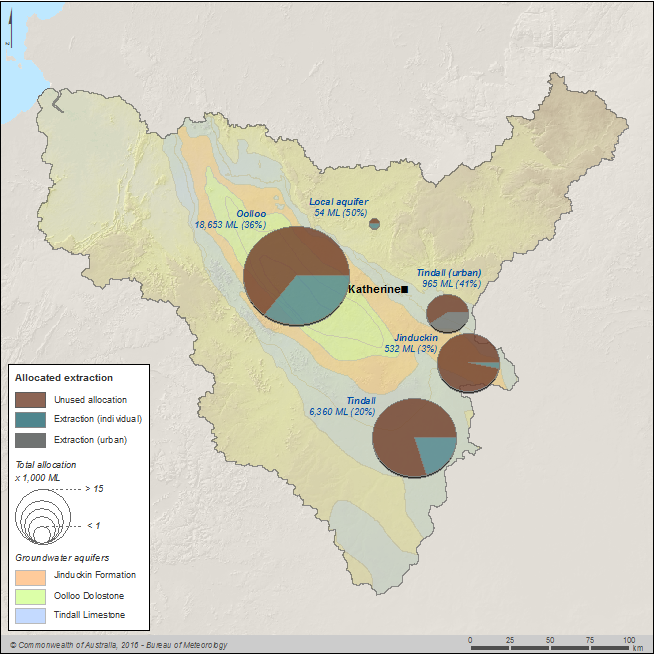
Figure S5 Allocated groundwater extractions from each aquifer within the Daly region during the 2015–16 year; percentage of allocation extracted is also shown
Extraction: statutory rights (4,280 ML) accounted for approximately 14% of the total extraction in the region. The remaining groundwater extracted refers to non-allocated extractions: individual users (180 ML), which accounted for less than 1% of the total groundwater extraction and changes little from year to year.
For a more detailed description of the water usage in the region, and the associated entitlements, see the Groundwater rights note.
Groundwater balancing item
The calculation of the groundwater balance (Table S6) yielded a balance of 38,024 ML, which is less than 10% of the total groundwater inflows during the year.
It is likely that the balancing item is primarily attributed to uncertainties associated with the groundwater recharge from landscape (a large source of groundwater increase) and groundwater discharge to surface water (a large source of groundwater decrease). Both of these flows are estimated from a groundwater model (see Methods) and it is reasonable to expect a relatively high uncertainty around these volumes.


