


Ord: Statement of Changes in Water Assets and Water Liabilities
Water availability in the Ord region decreased by 1,874,456 ML during the 2015–16 year. This is the second successive year the water availability in the region has decreased. The change in water available in the region at the end of the year is represented by the change in net water assets.
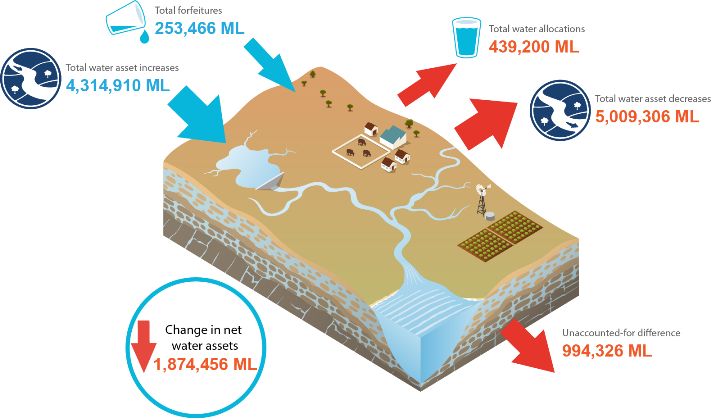
The Statement of Changes in Water Assets and Water Liabilities is provided in the table below. The statement is prepared on an accrual basis, and presents the changes in water assets and water liabilities that occurred during the reporting year. These changes include accrual transactions (e.g. allocations and forfeitures) and actual water flows, both natural and engineered.
Items in the statements are hyperlinked to the associated section of the Statement details. Methods used to derive item volumes are provided in the Reference information.
for the year ended 30 June 2016
| 2016 ML | 2015 ML | |
|---|---|---|
| Water asset increases | ||
| Surface water increases | 4,306,338 | 6,467,901 |
| Precipitation | 647,542 | 582,188 |
| Runoff | 3,607,211 | 5,834,254 |
| Point return: irrigation | 51,000 | 51,000 |
| Discharge: wastewater | 585 | 459 |
| Total surface water increases | 4,306,338 | 6,467,901 |
| Groundwater increases | 8,572 | 9,333 |
| Inter-region inflow | – | – |
| Recharge: landscape | 8,572 | 9,333 |
| Total groundwater increases | 8,572 | 9,333 |
| Total water asset increases | 4,314,910 | 6,477,234 |
| Water liability decreases | ||
| Surface water liability decreases | 247,762 | 212,960 |
| Adjustment and forfeiture: individual users | 14,402 | 16,130 |
| Adjustment and forfeiture: urban system | 343 | 340 |
| Adjustment and forfeiture: irrigation | 233,017 | 196,490 |
| Total surface water liability decreases | 247,762 | 212,960 |
| Groundwater liability decreases | 5,704 | 4,901 |
| Adjustment and forfeiture: individual users | 4,836 | 3,974 |
| Adjustment and forfeiture: urban system | 868 | 927 |
| Total groundwater liability decreases | 5,704 | 4,901 |
| Total water liability decreases | 253,466 | 217,861 |
| Water asset decreases | ||
| Surface water decreases | 5,009,306 | 6,264,737 |
| Evaporation | 2,055,633 | 2,458,054 |
| Outflow | 2,953,593 | 3,806,638 |
| Leakage: landscape | 80 | 45 |
| Total surface water decreases | 5,009,306 | 6,264,737 |
| Groundwater decreases | – | – |
| Inter-region outflow | – | – |
| Discharge: landscape | – | – |
| Total groundwater decreases | – | – |
| Total water asset decreases | 5,009,306 | 6,264,737 |
| Water liability increases | ||
| Surface water liability increases | 424,911 | 425,187 |
| Allocation: individual users | 37,336 | 37,612 |
| Allocation: urban system | 775 | 775 |
| Allocation: irrigation | 386,800 | 386,800 |
| Total surface water liability increases | 424,911 | 425,187 |
| Groundwater liability increases | 14,289 | 14,206 |
| Allocation: individual users | 11,589 | 11,506 |
| Allocation: urban system | 2,700 | 2,700 |
| Total groundwater liability increases | 14,289 | 14,206 |
| Total water liability increases | 439,200 | 439,393 |
| Unaccounted-for difference | ||
| Unaccounted-for difference | (994,326) | (1,025,105) |
| Unaccounted-for difference | (994,326) | (1,025,105) |
| Total unaccounted-for difference | (994,326) | (1,025,105) |
| Total unaccounted-for difference | (994,326) | (1,025,105) |
| Change in net water assets | (1,874,456) | (1,034,140) |