


Murray–Darling Basin: Key findings
For the water account period 1 July 2022 – 30 June 2023
- Total annual rainfall was above average for the third consecutive year, following the region's wettest spring on record.
- The total Basin storage level at the end of the year was 95%, an increase of 4% from 2021–22.
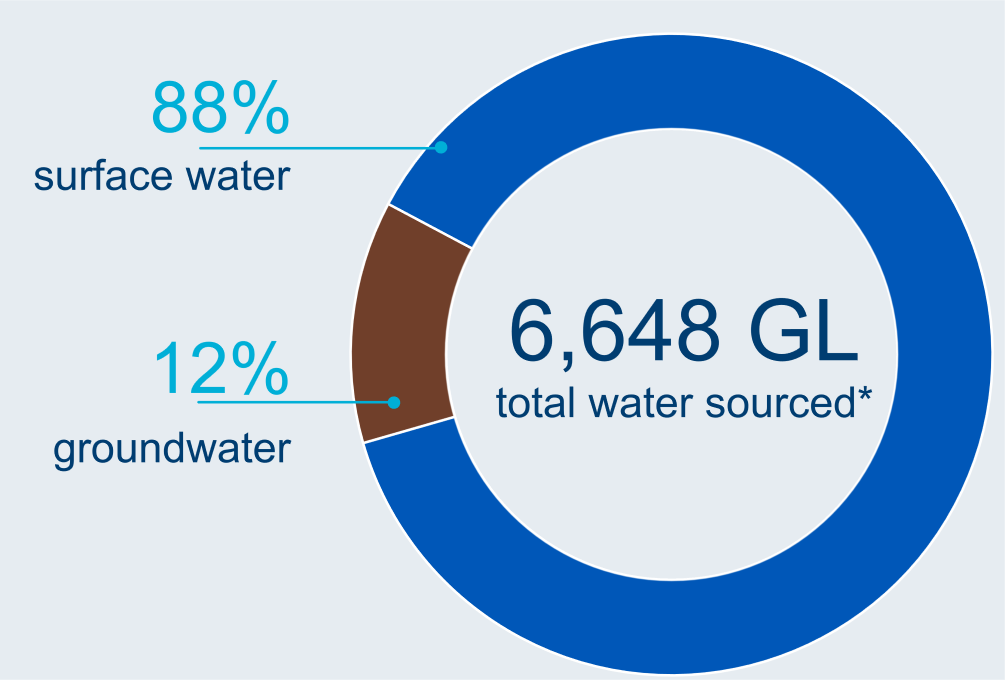
- Water taken from surface water and groundwater resources for consumptive use was 6,648 GL, 22% less than the previous year.
Climate and water
Rainfall
605 mm
%30 above the Basin average
Streamflow
above average
for much of the year
Storage
95% full

4% more than last year
Water use
Water sourced
Water taken
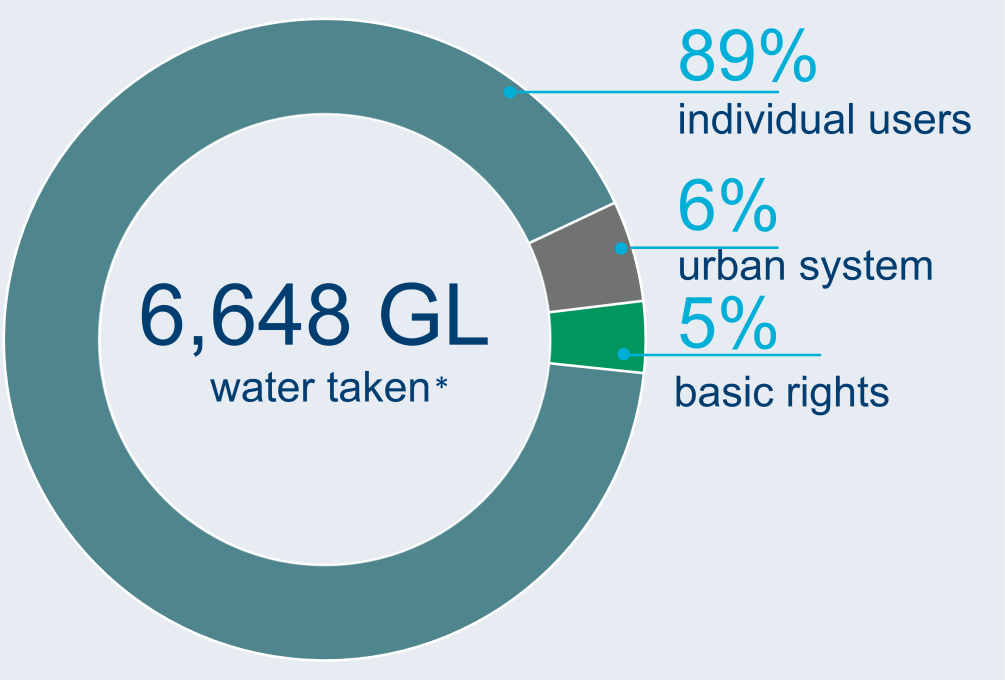
* water taken for consumptive use
Water status
Allocations
14,915 GL
total surface water and groundwater allocations
Water availability
63,860 GL
surface water available in 2022–23
Highest on record (since 2010)