


Burdekin: Climate and water
For the water account period 1 July 2023 to 30 June 2024
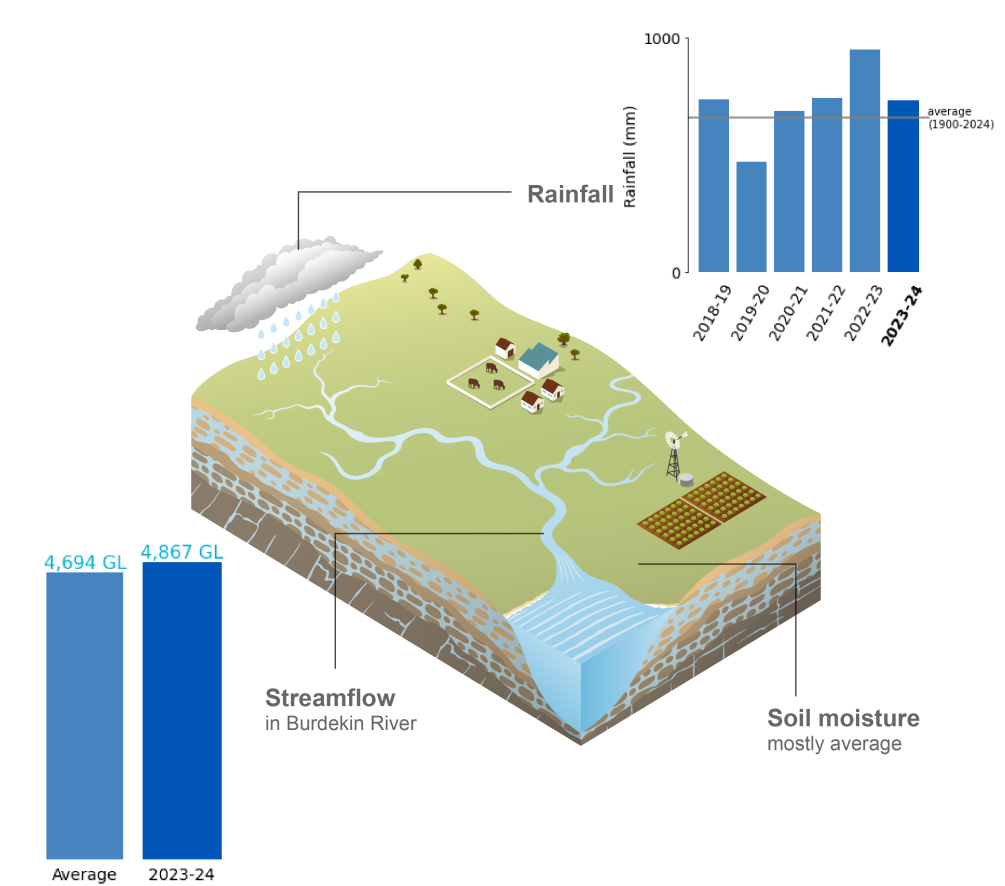
- Annual rainfall in the Burdekin region during 2023–24 was above average for the fourth consecutive year, with the 2023–24 wet season accounting for 86% of the region's total annual rainfall.
- Soil moisture in the root zone (0–1 m depth) was predominantly average across most of the region throughout the reporting period, with above-average conditions prominent in the north.
- Total annual flows were below average at all sites, except for the Burdekin River at Sellheim (the region's largest river), where streamflows were slightly above the long-term average.
For further information on the region's climate and water conditions during the 2023–24 year scroll down this page or click on the links below:
About the region
- The Burdekin region spans across two climatic zones. East of the Great Dividing Range, the climate is characterised by tropical monsoonal conditions, with hot, humid summers and warm, dry winters. In contrast, the climate west of the Great Dividing Range is characterised by dry tropical conditions, with hot, dry summers and warm, dry winters.
- Most of the region's rainfall occurs during the northern wet season between October and April, driven by active monsoon phases and tropical cyclones. Rainfall is significantly higher east of the Great Dividing Range compared to areas west of the range.
- Streamflow in the region's rivers generally reflects the distribution of rainfall throughout the year. Higher streamflow and storage inflows typically occur from October to April, while streamflows can periodically cease to flow during the dry season between May and September.
Climate conditions
Rainfall
Figure C1 Annual and monthly rainfall deciles for the Burdekin region during the 2023–24 year
- Total area-averaged rainfall in the Burdekin region during 2023–24 was 734 mm, 11% above the long-term average of 660 mm, making it the region's fourth consecutive year of above-average rainfall.
- During the first week of July, an upper-level trough and associated cloud band brought unseasonable widespread rainfall totals of 25 to 50 mm across the region, contributing to the region's twelfth-wettest July on record.
- Between August to October, the absence of rain-bearing systems in the region resulted in little rainfall over this period. While rainfall is typically low during these months leading up to the wet season, it was the region's driest August-to-October period on record.
- In late September, an El Niño event in the tropical Pacific Ocean was declared underway (as stated in this Climate Driver Update) and remained active through to the end of autumn. Historically, El Niño events increase the likelihood of below-average rainfall, particularly during winter to spring, and likely contributed to the lack of rainfall between August and October.
- Severe thunderstorms brought heavy rainfall across the region during late November, contributing toward the region's twelfth-wettest November on record, with some sites recording their highest November monthly rainfall totals, officially marking the beginning of the 2023–24 wet season.
- Tropical Cyclone Kirrily impacted the region during late January, delivering up to 200 mm of rainfall across the region, though rainfall in January was only 11% above the long-term average.
- Over the course of summer, above-average sea surface temperatures off the Queensland coastline enhanced onshore moisture, leading to rainfall being 19% above the long-term seasonal average.
- At the end of autumn, the El Niño-Southern Oscillation returned to neutral, with its influence gradually waning on the region's climate, but despite its presence throughout the 2023–24 wet season, rainfall during the wet season was 13% above the long-term average, accounting for 86% of the region's rainfall during the reporting period.
- Following the conclusion of the 2023–24 wet season, rainfall was a third of the April-May long-term average, while rainfall in June was 54% above the long-term average.
- More information on the 2023–24 northern wet season and Australia's climate and water during the 2023–24 reporting year can be found in Australia's 2023–24 Northern Wet Season Summary and the Financial Year Climate and Water Statement 2023–24.
Figure C2 Total monthly rainfall for the Burdekin region during the 2023–24 year compared with the average and percentiles for the region
- Rainfall during the 2023–24 wet season was above average from November to February, with November ranking about the 90th percentile.
- Outside of the 2023–24 wet season, July equalled the 90th percentile, while June was above average.
- August to October were equal to or less than the 10th percentile, while April and May ranked slightly above the 10th percentile.
Actual evapotranspiration
Figure C3 Annual and monthly actual evapotranspiration deciles for the Burdekin region during the 2023–24 year
- Total area-averaged actual evapotranspiration in the Burdekin region was predominantly average to above average during 2023–24, due to above-average rainfall from November to February maintaining water availability across the region.
- Unseasonable rainfall in July increased water availability across the region, which resulted in average to above average evapotranspiration throughout July and August.
- Following the region's driest August-to-October period on record, evapotranspiration declined to below average levels in September and October, leading up to the 2023–24 northern wet season.
- On the back of the region's twelfth-wettest November on record, evapotranspiration rebounded to above average conditions across most of the region during November, and remained predominantly above average throughout summer.
- Although rainfall was close to average in March, evapotranspiration was a tale of two halves, with above-average evapotranspiration prominent in the north, while below-average conditions were prominent in the south.
- Throughout most of the 2023–24 wet season, evapotranspiration was average to above average, primarily due to above-average rainfall from November to February.
- Evapotranspiration remained varied across the region following the conclusion of the 2023–24 wet season, reflecting the distribution of rainfall throughout the region, with below-average evapotranspiration becoming more dominant across the region at the end of the reporting period.
Soil moisture
Figure C4 Annual and monthly soil moisture deciles for the Burdekin region during the 2023–24 year
- Soil moisture in the root zone (0–1m depth) for the Burdekin region was predominantly average to above average during 2023–24, primarily due to above-average rainfall from November to February improving soil moisture conditions.
- Unseasonable rainfall in July increased soil moisture across most of the region, except for the far northern tip, where soil moisture was largely below average.
- With very little rainfall observed across the region from August to October, soil moisture decreased rapidly, with very much below average soil moisture reaching its greatest extent in October.
- In response to the region's twelfth-wettest November on record, soil moisture rebounded, becoming above average across most of the region during December, and remained average to above average through to the end of 2023–24 wet season.
- Following the conclusion of the 2023–24 wet season, soil moisture remained predominantly average through to the end of June, despite little rainfall in April and May.
- More information on the soil moisture conditions across the Burdekin region during the 2023–24 reporting year is available on the Australian Water Outlook.
Streamflow responses
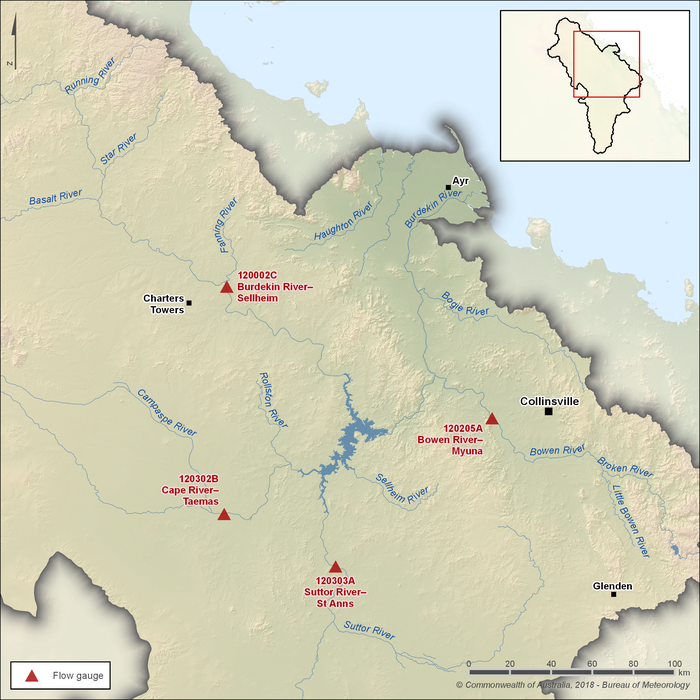
Figure C5 Key flow gauging stations along the main rivers within the Burdekin region
- The Burdekin, Cape, and Suttor rivers are the primary river systems within the Burdekin region, and flow into Lake Dalrymple, which supports the region's Burdekin Haughton Water Supply Scheme.
- Four gauging stations are used to represent seasonal flow patterns in the region's rivers, three of which monitor flows into Lake Dalrymple, while the other gauging station—Bowen River at Myuna (Station 120205A)—monitors flows through the Bowen River, downstream of Lake Eungella, which provides water for the region's Bowen Broken Water Supply Scheme.
- Flows in the rivers upstream of Lake Dalrymple are generally very low or can cease to flow during the dry season between May and October. In contrast, flows below Lake Dalrymple (in the Burdekin River) and Lake Eungella (in the Bowen River) are regulated by releases from the dams, and consequently, streamflows are generally perennial.
Figure C6 Total monthly flow for major rivers in the Burdekin region during the 2023–24 year compared with the average and percentiles
- Total annual flows in the region's major rivers were below average during 2023–24, except for the Burdekin River at Sellheim (Station 120002D), where total annual flows were 4,867 GL, approximately 4% above the long-term average of 4,694 GL.
- Despite unseasonable rainfall across the region in July, streamflows were below average at all sites, except for the Bowen River at Myuna (Station 120205A), where streamflows were 49% above the long-term monthly average of 15 GL.
- Following the region's driest August-to-October period on record, streamflows remained low in the Burdekin and Bowen rivers, and ceased to flow in the Cape and Suttor rivers.
- Throughout the wet season, streamflows remained close to average despite above-average rainfall from November to February.
- Although Tropical Cyclone Kirrily impacted the region in late January, streamflows remained average to below average, as the heaviest rains occurred north of the Burdekin region.
- By the end of the 2023–24 wet season, streamflows returned to near-base flows, and with little rainfall observed across the region during April and May, the Suttor River at St Anns (Station 120303A) ceased to flow in May.