


Burdekin: Supporting information
For the water account period 1 July 2023 to 30 June 2024
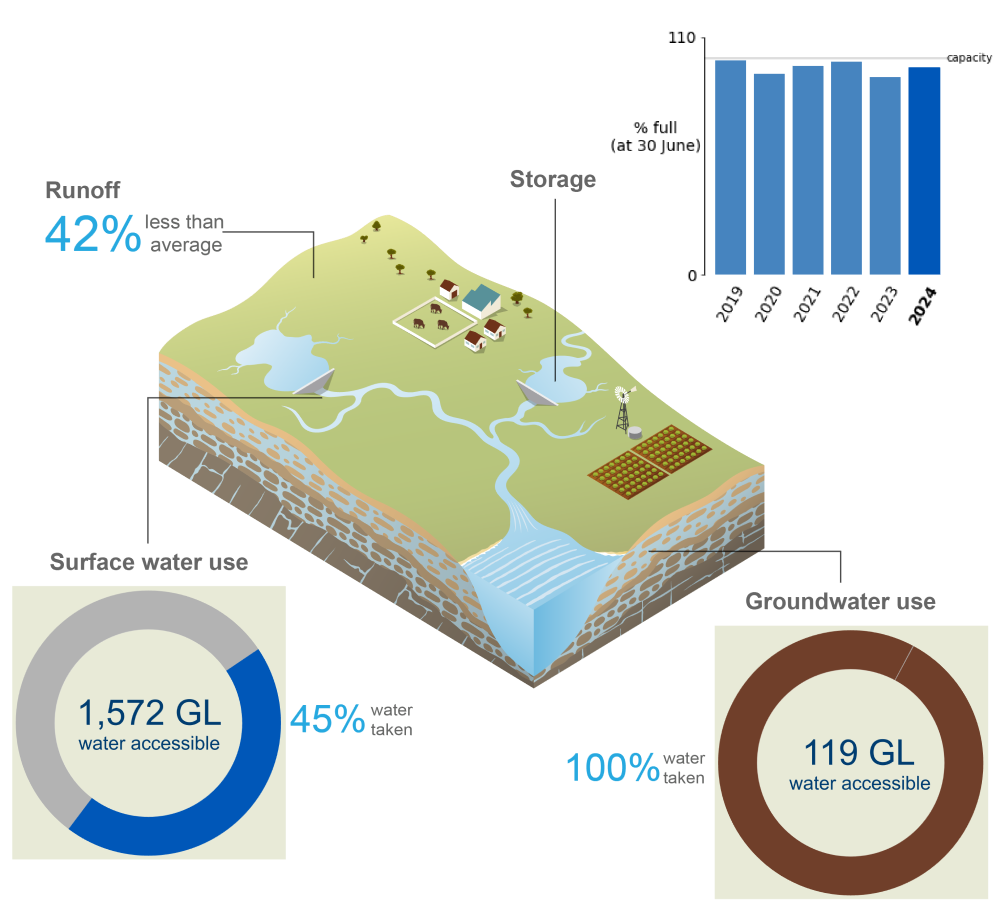
- Annual rainfall in the Burdekin region during 2023–24 was above average for the fourth consecutive year, although runoff and surface water inflows into the region's surface water storages were below average.
- Total storage volume in the Burdekin region increased by 4.4% during the reporting year, finishing at 96.0% full on 30 June 2024.
- Approximately 49% of surface water and groundwater resources in the Burdekin region were taken, primarily for allocated diversions to irrigation users under the Burdekin Haughton Water Supply Scheme.
For further information on the regions water accounting statements scroll down this page or click on the links below:
Water assets
")
- The total volume of water assets in the Burdekin region was 2,121 GL on 30 June 2024, with approximately 90% of the water assets held in surface water storages.
- Aquifers accounted for approximately 8% of the total water assets in the Burdekin region, while the remaining volume of water assets was contained in rivers.
- A detailed breakdown of water assets in the Burdekin region is available in the Statement of Water Assets and Water Liabilities.
| Surface water | 2024 | 2023 | 2022 | 2021 | 2020 | 2019 |
| Burdekin Falls | 1,770,861 | 1,690,213 | 1,850,538 | 1,804,949 | 1,728,597 | 1,837,447 |
| Clare Weir | 16,394 | 13,096 | 14,401 | 15,691 | 15,512 | 13,609 |
| Eungella | 111,748 | 109,530 | 92,526 | 91,926 | 97,396 | 111,425 |
| Giru Weir | 685 | 690 | 657 | 711 | 764 | 759 |
| Lake Paluma | 11,512 | 10,229 | 9,427 | 11,309 | 7,846 | 11,490 |
| Accessible total | 1,911,200 | 1,823,758 | 1,967,549 | 1,924,586 | 1,850,115 | 1,974,730 |
| Dead storage | 9,405 | 9,405 | 9,405 | 9,405 | 9,405 | 9,405 |
| Total storage | 1,920,605 | 1,833,163 | 1,976,979 | 1,933,991 | 1,859,520 | 1,984,135 |
| Total capacity | 2,000,897 | 2,000,897 | 2,000,897 | 2,000,897 | 2,000,897 | 2,000,897 |
| % full | 96.0% | 91.6% | 98.8% | 96.7% | 92.9% | 99.2% |
- The total storage volume in the Burdekin region increased by 4.4% during 2023–24, finishing at 96.0% full on 30 June 2024.
- Lake Dalrymple, formed by Burdekin Falls Dam, accounts for almost 92% of the region's total surface water storage.
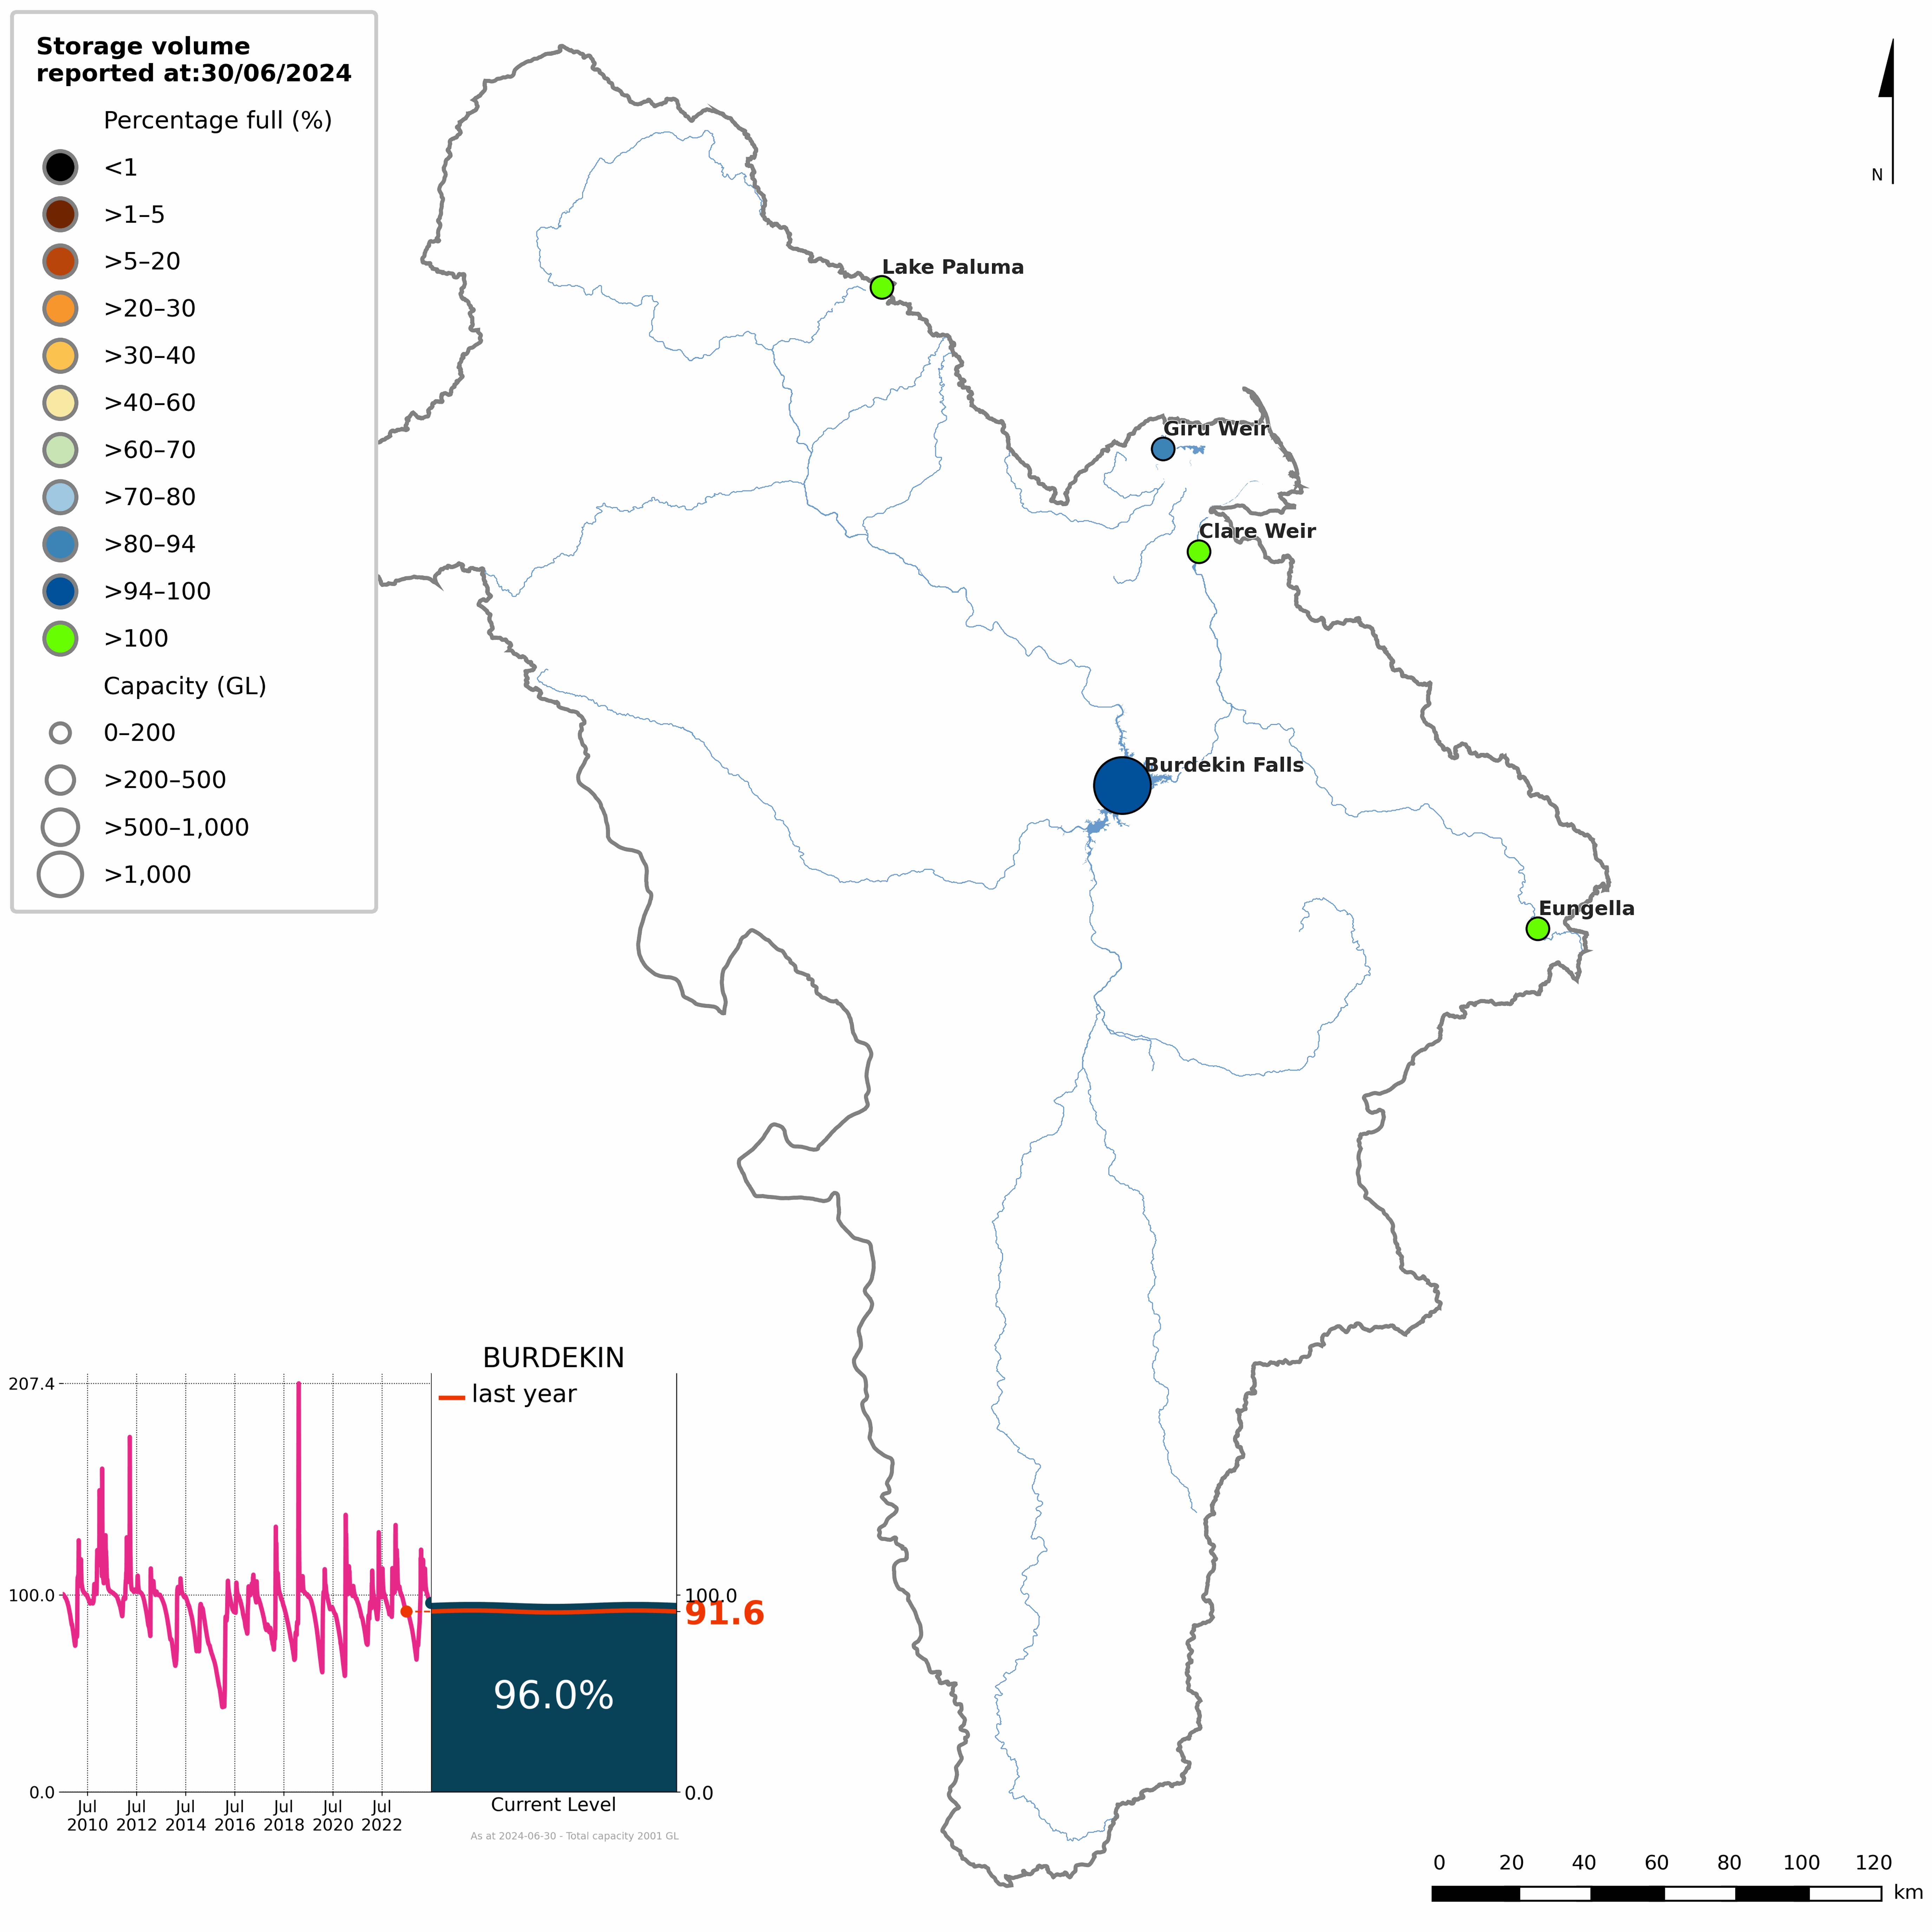
Figure S1 Percentage-full volume on 30 June 2024 for each
storage and total storage volume from 2010–2024 (inset)
- The total storage volume in the Burdekin region began the 2023–24 year at 91.6% full—the lowest opening storage volume since 2014–15
- Following the region's driest August-to-October period on record, storages across the Burdekin region dropped to approximately 66% full during October.
- In response to above-average rainfall in November and December, storages rebounded, rising above 100% full during December for the first time since April 2023.
- On January 26, Tropical Cyclone Kirrily crossed the Queensland coast near Townsville as a weakening category 1 system. Although the heaviest falls from the system occurred north of the Burdekin region, the region was still impacted by heavy rain, causing storages to increase rapidly, peaking around 125% full at the end of January.
- At the conclusion of the 2023–24 wet season, storages were just above 100% full, but fell below full capacity during May, due to a lack of rain-bearing systems in April and May.
- By 30 June 2024, the total storage volume in the Burdekin region was 96.0% full—up 4.4% from the same time last year.
- More detailed information on individual storages in the Burdekin region is available on the Bureau of Meteorology's Water Information Dashboard.
Water liabilities
")
- Water liabilities in the Burdekin region refer to the volume of allocation remaining on licence entitlements at the end of the reporting period (30 June).
- Licence entitlements in the Burdekin region contain carryover provisions, which allow any unused portion of the allocation to be carried over into the next reporting period.
- As all groundwater extractions are taken through non-allocated purposes, there are no groundwater allocated licences in the Burdekin region.
- A more detailed description of water allocations in the Burdekin region is provided in the Water use section.
| Description | 2024 | 2023 | 2022 | 2021 | 2020 | 2019 | |
| Opening balance at 01 July | 269,898 | 0 | 159,976 | 108,151 | 119,813 | 74,084 | |
| add | Allocation | 1,140,093 | 1,140,093 | 1,140,093 | 1,181,223 | 1,170,327 | 1,159,180 |
| less | Allocated diversion | 540,790 | 396,116 | 542,378 | 540,953 | 645,988 | 524,908 |
| less | Adjustment and forfeiture | 599,303 | 474,079 | 757,691 | 588,445 | 536,001 | 588,543 |
| Closing balance at 30 June | 269,898 | 269,898 | 0 | 159,976 | 108,151 | 119,813 | |
- Surface water allocations in the Burdekin region were 1,410 GL for 2023–24, primarily for medium security surface water licences. This was 270 GL higher than the previous reporting year due to the additional allocations carried over from the 2022–23 year.
- At the end of the 2023–24 reporting year, it was determined that 270 GL of surface water allocations would be carried over into the 2024–25 water year.
Water flows
")
- Total water inflows into the Burdekin region during 2023–24 were 6,967 GL, approximately half of the previous year's volume.
- Surface water inflows contributed 88% (6,145 GL) of total water inflows, with runoff accounting for 93% of the surface water inflows.
- Runoff into the region's surface water storages was 42% below than the long-term average of 9.715 GL (based on modelled data from 1971 to 2023), and the lowest since 2019–20.
- Groundwater inflows contributed 12% (822 GL) of total water inflows, in which recharge from surface water resulted in 92% of the total groundwater inflows.
- Artificial (managed) aquifer recharge, which occurs in the Lower Burdekin, attributed for 8% of the total groundwater inflows, almost double from the previous year. The volume of managed recharge is impacted by turbidity in the Burdekin River and changes in irrigation demand.
- Total water outflows from the Burdekin region during 2023–24 were 8,618 GL, approximately 39% lower than the previous year.
- Surface water outflows contributed 99% (8,500 GL) of total water outflows, mainly from outflow to sea , which comprised for 71% of the total surface water outflows.
- Outflow to sea from the region's rivers was 39% below the long-term average of 9,969 GL (based on modelled data from 1971 to 2023), and the lowest since 2019–20.
- Groundwater outflows contributed 1% (119 GL) of total water outflows, primarily from non-allocated extraction to irrigation users, which constituted for 98% of the total groundwater outflows.
- A more detailed breakdown of inflows and outflows for the Burdekin is available in the Statement of Changes in Water Assets and Water Liabilities.
Water availability
| Surface water | 2024 | 2023 | 2022 | 2021 | 2020 | 2019 |
| Water availability | 7,814,347 | 13,581,242 | 8,063,131 | 12,231,676 | 4,687,760 | 23,548,736 |
| Water accessible | 1,571,913 | 1,301,408 | 1,478,335 | 1,447,413 | 1,448,179 | 1,393,504 |
| Water taken | 702,712 | 557,431 | 720,644 | 698,992 | 804,027 | 685,148 |
| % water accessible taken | 45% | 43% | 49% | 48% | 56% | 49% |
- Surface water availability in the Burdekin region during 2023–24 was 31% below the long-term average of 11,267 GL, and 42% lower than the previous year, reflecting the decrease in runoff across the region.
- Changes in water availability across the Burdekin region are heavily influenced by runoff. Generally, when runoff increases or decreases, water availability responds in a similar way.
- Despite the decrease in water availability, surface water accessible for take in the Burdekin region was the highest on record, 16% above the average of 1,354 GL, primarily due to increased carryover from the start of the reporting period.
- In contrast, water taken from surface water resources in the Burdekin region was 10% below the average of 776 GL, but 26% higher than last year, mainly due to increased allocated diversions to irrigation users.
- The increase in water taken from surface water resources during 2023–24 may reflect the drier conditions in early spring and late autumn increasing irrigation demand.
- Overall, approximately 45% of the surface water accessible for take in the Burdekin region was taken, primarily for allocated diversions to various users across the region.
Water use
")
Consumptive use
| Surface water | 2024 | 2023 | 2022 | 2021 | 2020 | 2019 |
| Individual users | 72,562 | 40,950 | 46,374 | 255,420 | 261,377 | 227,258 |
| Industrial users | 26,301 | 23,706 | 27,383 | - | - | - |
| Inter-region supply | 12,700 | 12,700 | 12,700 | 12,539 | 20,108 | 15,705 |
| Irrigation users | 427,859 | 317,508 | 454,195 | 429,153 | 520,330 | 440,911 |
| Other users | 133,790 | 133,165 | 150,153 | - | - | - |
| Stock and domestic | 28,408 | 28,426 | 28,426 | - | - | - |
| Urban users | 1,092 | 976 | 1,413 | 1,880 | 2,212 | 1,274 |
| Total | 702,712 | 577,431 | 720,644 | 698,992 | 804,027 | 685,148 |
| Groundwater | 2024 | 2023 | 2022 | 2021 | 2020 | 2019 |
| Individual users | - | - | - | 148,028 | 147,521 | 136,748 |
| Commercial users | 104 | 104 | 104 | - | - | - |
| Industrial users | 1,029 | 1,232 | 679 | - | - | - |
| Irrigation users | 116,291 | 91,022 | 103,720 | - | - | - |
| Mining users | 140 | 140 | 556 | - | - | - |
| Other users | 447 | 338 | 364 | - | - | - |
| Stock and domestic | 648 | 648 | 648 | - | - | - |
| Urban users | 300 | 516 | 564 | - | - | - |
| Total | 118,959 | 94,000 | 106,635 | 148,028 | 147,521 | 136,748 |
- A total of 822 GL of water was taken from surface water and groundwater resources for consumptive use in the Burdekin region during 2023–24, approximately 26% more than the previous year, primarily due to increased surface water allocated diversions to irrigation users.
- Surface water diversions across the Burdekin region were 703 GL, around 26% higher than the previous year, but 10% below the average of 776 GL.
- Approximately 61% of surface water diversions in the Burdekin region were to irrigation users (under the Burdekin Haughton Water Supply Scheme), while other users accounted for 19% of the surface water diversions. The remaining volume of diversions were for individual users (10%), stock and domestic purposes (4%), industrial users (4%), inter-region supply (2%), and urban users (less than 1%).
- Allocated surface water diversions accounted for 77% of all surface water diversions, while the remaining volume of diversions were for was non-allocated purposes.
- Groundwater extractions across the Burdekin region were 119 GL, around 27% more than last year, and 29% above the average of 92 GL.
- Non-allocated extractions to irrigation users accounted for 98% of the total groundwater extractions, with the remaining volume of extractions made by industrial users, stock and domestic purposes, other users, urban users, mining users, and commercial users.
- There are no allocated extractions in the Burdekin region.
Allocations and diversions
| Surface water | 2024 | 2023 | 2022 | 2021 | 2020 | 2019 |
| Carryover | 269,898 | 0 | 159,976 | 108,151 | 119,813 | 74,084 |
| Allocated announcements | 1,140,093 | 1,140,093 | 1,140,093 | 1,181,223 | 1,170,327 | 1,159,180 |
| Allocated diversions | 540,790 | 396,116 | 542,378 | 540,953 | 645,988 | 524,908 |
| % used | 38% | 35% | 42% | 42% | 50% | 43% |
- Total surface water allocations in the Burdekin region during 2023–24 were 1,410 GL, approximately 24% more than the previous year.
- Approximately 38% of the surface water allocated in the Burdekin region was used, mostly by irrigation users in the Burdekin River Irrigation Area.
- There are no allocated groundwater entitlements in the Burdekin region—all extractions made are under non-allocated extractions.