


Canberra: Climate and water
For the water account period 1 July 2023 to 30 June 2024
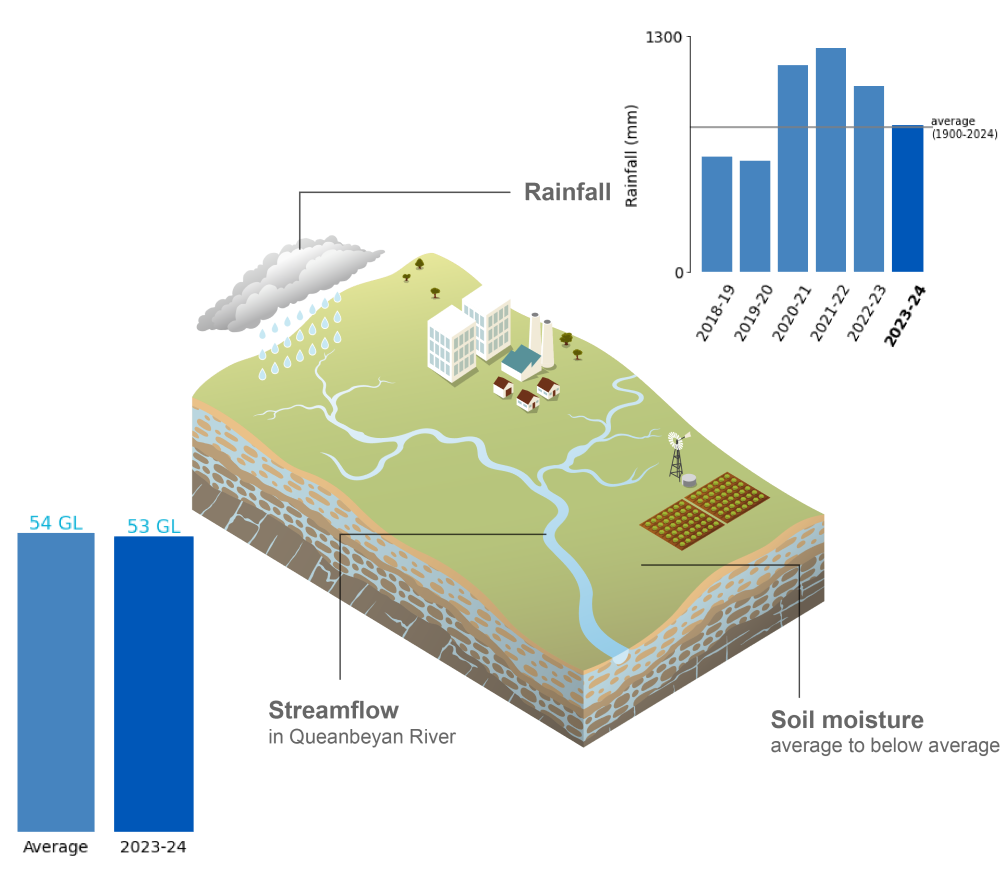
- Annual rainfall in 2023–24 was slightly above average across the Canberra region, including the seventh-wettest November-to-January period on record.
- Soil moisture in the root zone (0–1 m depth) was generally average to below average throughout the year, with drier conditions more prominent across the western, mountainous areas.
- Total annual flows were below average in the Molonglo and Cotter rivers, while flows in the Queanbeyan River remained close to average.
For further information on the region's climate and water conditions during 2023–24 scroll down this page or click on the links below:
About the region
- The Canberra region experiences a subtropical highland climate, characterised by cool to cold winters and mild to warm summers.
- Rainfall is relatively uniform throughout the year, with long-term monthly averages typically ranging from 50 to 75 mm. Higher totals are more common in mid-spring and summer due to increased thunderstorm activity.
- Streamflows in the Canberra region are generally higher during winter and spring, driven by increased runoff from partially saturated catchments following autumn and winter rainfall. In the Murrumbidgee River, streamflows can be influenced by diversions from the Snowy Mountains Scheme.
Climate conditions
Rainfall
Figure C1 Annual and monthly rainfall deciles for the Canberra region during 2023–24
- Total area-averaged rainfall in the Canberra region during 2023–24 was 809 mm, slightly above the long-term average of 799 mm, marking the region’s fourth consecutive year of above-average rainfall.
- Rainfall from July to October was 53% below the long-term average for this period, primarily due to a lack of rain-bearing systems. This included the region’s seventh-driest July on record, which contributed to its ninth-driest winter on record.
- In late September, a positive Indian Ocean Dipole (IOD) and El Niño event in the tropical Pacific Ocean were declared underway (as stated in this Climate Driver Update). Historically, concurrent positive IOD and El Niño events increase the likelihood of below-average rainfall during winter and spring, likely contributing to the dry conditions observed from July to October.
- From November to January, rainfall was almost double the long-term average for the period, driven by several widespread thunderstorm outbreaks. This resulted in the region’s seventh-wettest November-to-January period on record, and contributed to its fifteenth-wettest summer on record.
- By late January, the positive IOD returned to neutral, while the El Niño event began to weaken, but despite their gradual decay, rainfall during February and March was 26% below the long-term average for that period.
- During the first week of April, an east coast trough delivered up to 100 mm of rainfall across the region, resulting in April rainfall being 46% above the long-term average.
- At the end of autumn, the El Niño-Southern Oscillation returned to neutral, but despite its waning influence on the region's climate, rainfall during the May-to-June period was 18% below the long-term average.
- More information on Australia's climate and water during the 2023–24 reporting year can be found in the Financial Year Climate and Water Statement 2023–24.
Figure C2 Total monthly rainfall for the Canberra region during 2023–24 compared with the average and percentiles for the region
- Rainfall was above average from November to January and again in April, although November was the only month to exceed the 90th percentile, while December and January fell just below the 90th percentile, but remained well above their long-term monthly averages.
- Of the eight months that recorded below-average rainfall, July and September were the only months at or below the 10th percentile. August rainfall was also well below average, but remained above the 10th percentile.
Actual evapotranspiration
Figure C3 Annual and monthly actual evapotranspiration for the Canberra region during 2023–24
- Total area-averaged actual evapotranspiration was above average across most of the Canberra region during 2023–24, supported by the fourth consecutive year of above-average rainfall, which sustained high water availability across the Queanbeyan and Molonglo river catchments.
- Throughout July and August, evapotranspiration was average to above average despite several months of below-average rainfall. This likely reflects the influence of above-average rainfall in March and April 2023, which enhanced water availability leading into the start of this reporting period.
- With a lack of rain-bearing systems affecting the region during winter and spring, evapotranspiration was generally average to below average throughout spring.
- Following the region’s seventh-wettest November-to-January period on record, evapotranspiration returned to above-average levels in December, and remained predominantly above average through to the end of summer.
- Although rainfall was slightly below average from March to June, regular rainfall events helped sustain water availability, supporting average to above-average evapotranspiration through to the end of this reporting period.
Soil moisture
Figure C4 Annual and monthly soil moisture deciles for the Canberra region during 2023–24
- Soil moisture in the root zone (0–1 m depth) for the Canberra region was average in the west, and below average in the east during 2023–24, which may reflect the periods of below-average rainfall during the reporting period.
- During winter, below-average soil moisture conditions developed in the southern half of the region and, following below-average rainfall across the region, gradually extended northward toward the end of the season.
- By September, soil moisture was very much below average across most of the region, with the greatest extent of record-low soil moisture occurring during this month.
- Following the region’s seventh-wettest November-to-January period on record, soil moisture rebounded to above-average conditions in December, and remained predominantly above average through to the end of summer.
- Despite rainfall being below average from March to June, soil moisture remained average to above average across the region through to the end of the reporting period.
- More information on the soil moisture conditions across the Canberra region during the 2023–24 reporting period is available on the Australian Water Outlook.
Streamflow responses
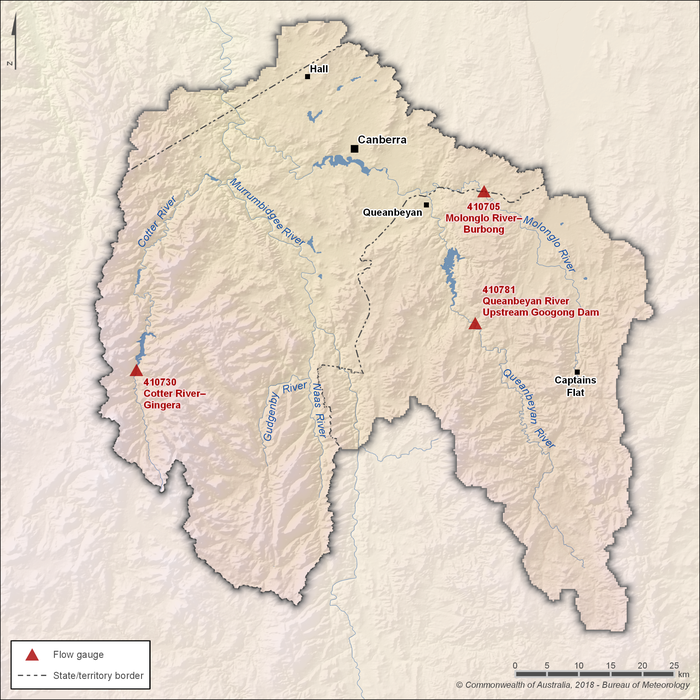
Figure C5 Key flow gauging stations along the main rivers within the Canberra region
- Within the Canberra region, five main river catchments contribute to the streamflow network. Four of these—the Cotter, Gudgenby, Molonglo, and Queanbeyan—feed into the Murrumbidgee River catchment.
- The Cotter and Queanbeyan rivers supply the majority of inflows into Canberra’s surface water storages. As a result, streamflows upstream of these catchments are monitored at two key gauging stations: Cotter River at Gingera (Station 410730) and Queanbeyan River upstream of Googong Dam (Station 410781).
- Flows in the Molonglo River, a major tributary of the Murrumbidgee River, pass through the Canberra city, where it is dammed by Scrivener Dam to form Lake Burley Griffin. Streamflows upstream of Lake Burely Griffin are monitored by the Molonglo River at Burbong (Station 410705) gauging station.
Figure C6 Total monthly flow for major rivers in the Canberra region during 2023–24 compared with the average and percentiles
- Total annual flows were below the long-term average in the Molonglo and Cotter rivers during 2023–24, while flows in the Queanbeyan River upstream of Googong Dam (Station 410781) were close to average.
- Flows in the Molonglo River at Burbong (Station 410705) were 18 GL across the reporting period, 55% below the long-term average of 40 GL. Similarly, flows in the Cotter River at Gingera (Station 410730) were 34 GL, 21% below the long-term average of 42 GL.
- Following below-average rainfall from July to October, streamflows at all sites remained well below average—close to the 10th percentile—reflecting the prolonged absence of rain-bearing systems.
- In response to the region's seventh-wettest November-to-January period on record, streamflows peaked above the 90th percentile at all sites in January.
- By the end of summer, flows returned to near-average levels across all sites, and remained average to below average through to the end of the reporting year, reflecting the near-average rainfall observed from March to June.