


Canberra: Supporting information
For the water account period 1 July 2023 to 30 June 2024
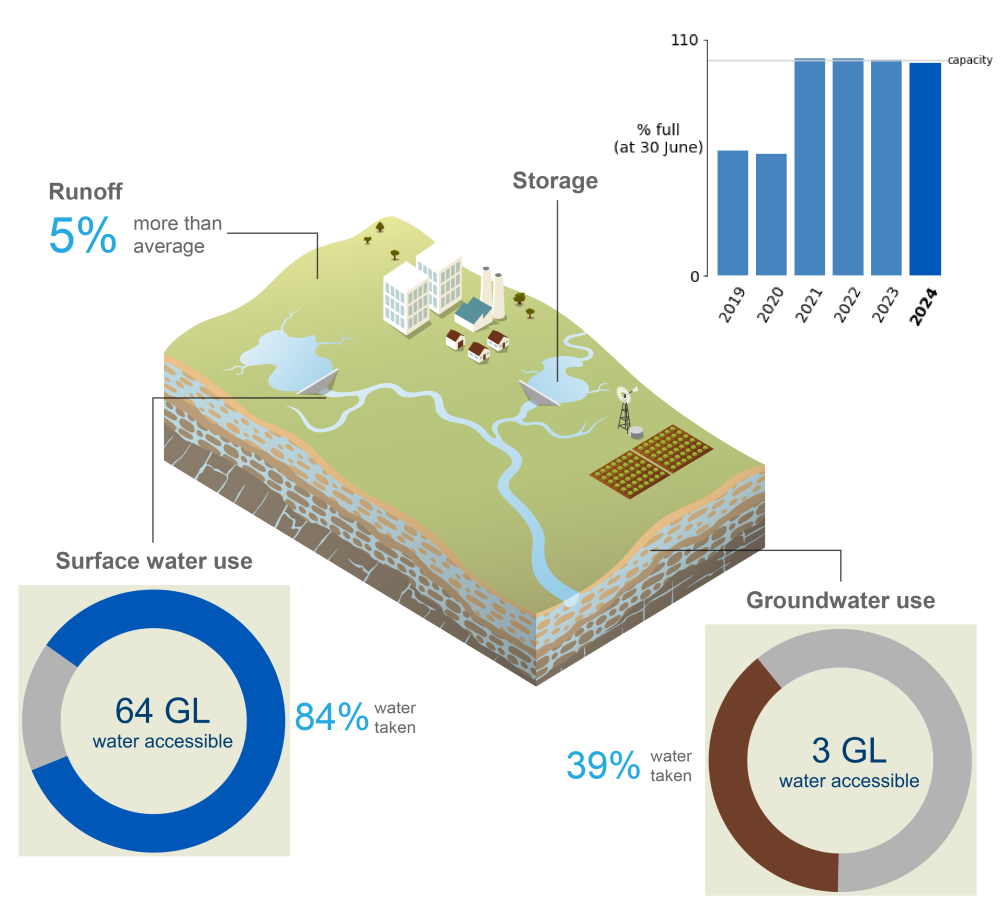
- Annual rainfall in the Canberra region during 2023–24 was slightly above average, contributing to near-average runoff, although surface water inflows into the region's surface water storages were below average.
- Total storage volume in the Canberra region decreased by 1.6% during the reporting year, finishing at 99.0% full on 30 June 2024, with storages recording the highest four-year average on record.
- Approximately 82% of total surface water and groundwater resources in the Canberra region were taken, primarily for diversions to the urban system.
For further information on the region's water accounting statements scroll down this page or click on the links below:
Water assets
")
- The total volume of water assets in the Canberra region was 322 GL on 30 June 2024, with approximately 87% of this volume held in surface water storages.
- Around 13% of the region's water assets were contained in rivers, lakes and wetlands, while the urban water supply system accounted for less than 1% of the total water assets.
- A detailed breakdown of water assets in the Canberra region’s is available in the Statement of Water Assets and Water Liabilities.
| Surface water | 2024 | 2023 | 2022 | 2021 | 2020 | 2019 |
| Bendora | 10,399 | 11,446 | 11,446 | 11,446 | 9,506 | 5,038 |
| Corin | 65,702 | 69,283 | 70,787 | 70,787 | 30,332 | 16,827 |
| Cotter | 79,374 | 79,374 | 79,374 | 79,374 | 60,665 | 65,245 |
| Googong | 119,409 | 119,409 | 119,409 | 119,409 | 55,439 | 73,116 |
| Accessible total | 274,884 | 279,512 | 281,016 | 281,016 | 155,942 | 160,226 |
| Dead storage | 5,058 | 5,058 | 5,058 | 5,058 | 5,058 | 5,058 |
| Total storage | 279,942 | 284,570 | 286,074 | 286,074 | 161,000 | 165,284 |
| Total capacity | 282,898 | 282,898 | 282,898 | 282,898 | 282,898 | 282,898 |
| % full | 99.0% | 100.6% | 101.1% | 101.1% | 56.9% | 58.4% |
- Total storage volume in the Canberra region decreased by 1.6% during 2023–24, finishing at 99.0% full on 30 June 2024.
- The end-of-year storage volume in 2023–24 was the fourth highest on record for the Canberra region, and contributed to the highest four-year average storage volume.
- Googong Dam, located on the Queanbeyan River, holds approximately 43% of the Canberra region’s total surface water storage, while the remaining volume is held in the Bendora, Corin, and Cotter reservoirs.
- Between 2009 and 2013, the Cotter Reservoir was enlarged through the construction of an 83-metre-high roller-compacted concrete dam wall, increasing its total storage capacity from 3.856 GL to 79.374 GL. This would strengthen the region's water supply in periods of drought (see 2013 Account).
- In March 2012, prior to the dam’s completion, the Cotter Reservoir spilled due to extraordinary rainfall and flooding. The completed dam wall spilled for the first time in July 2016.
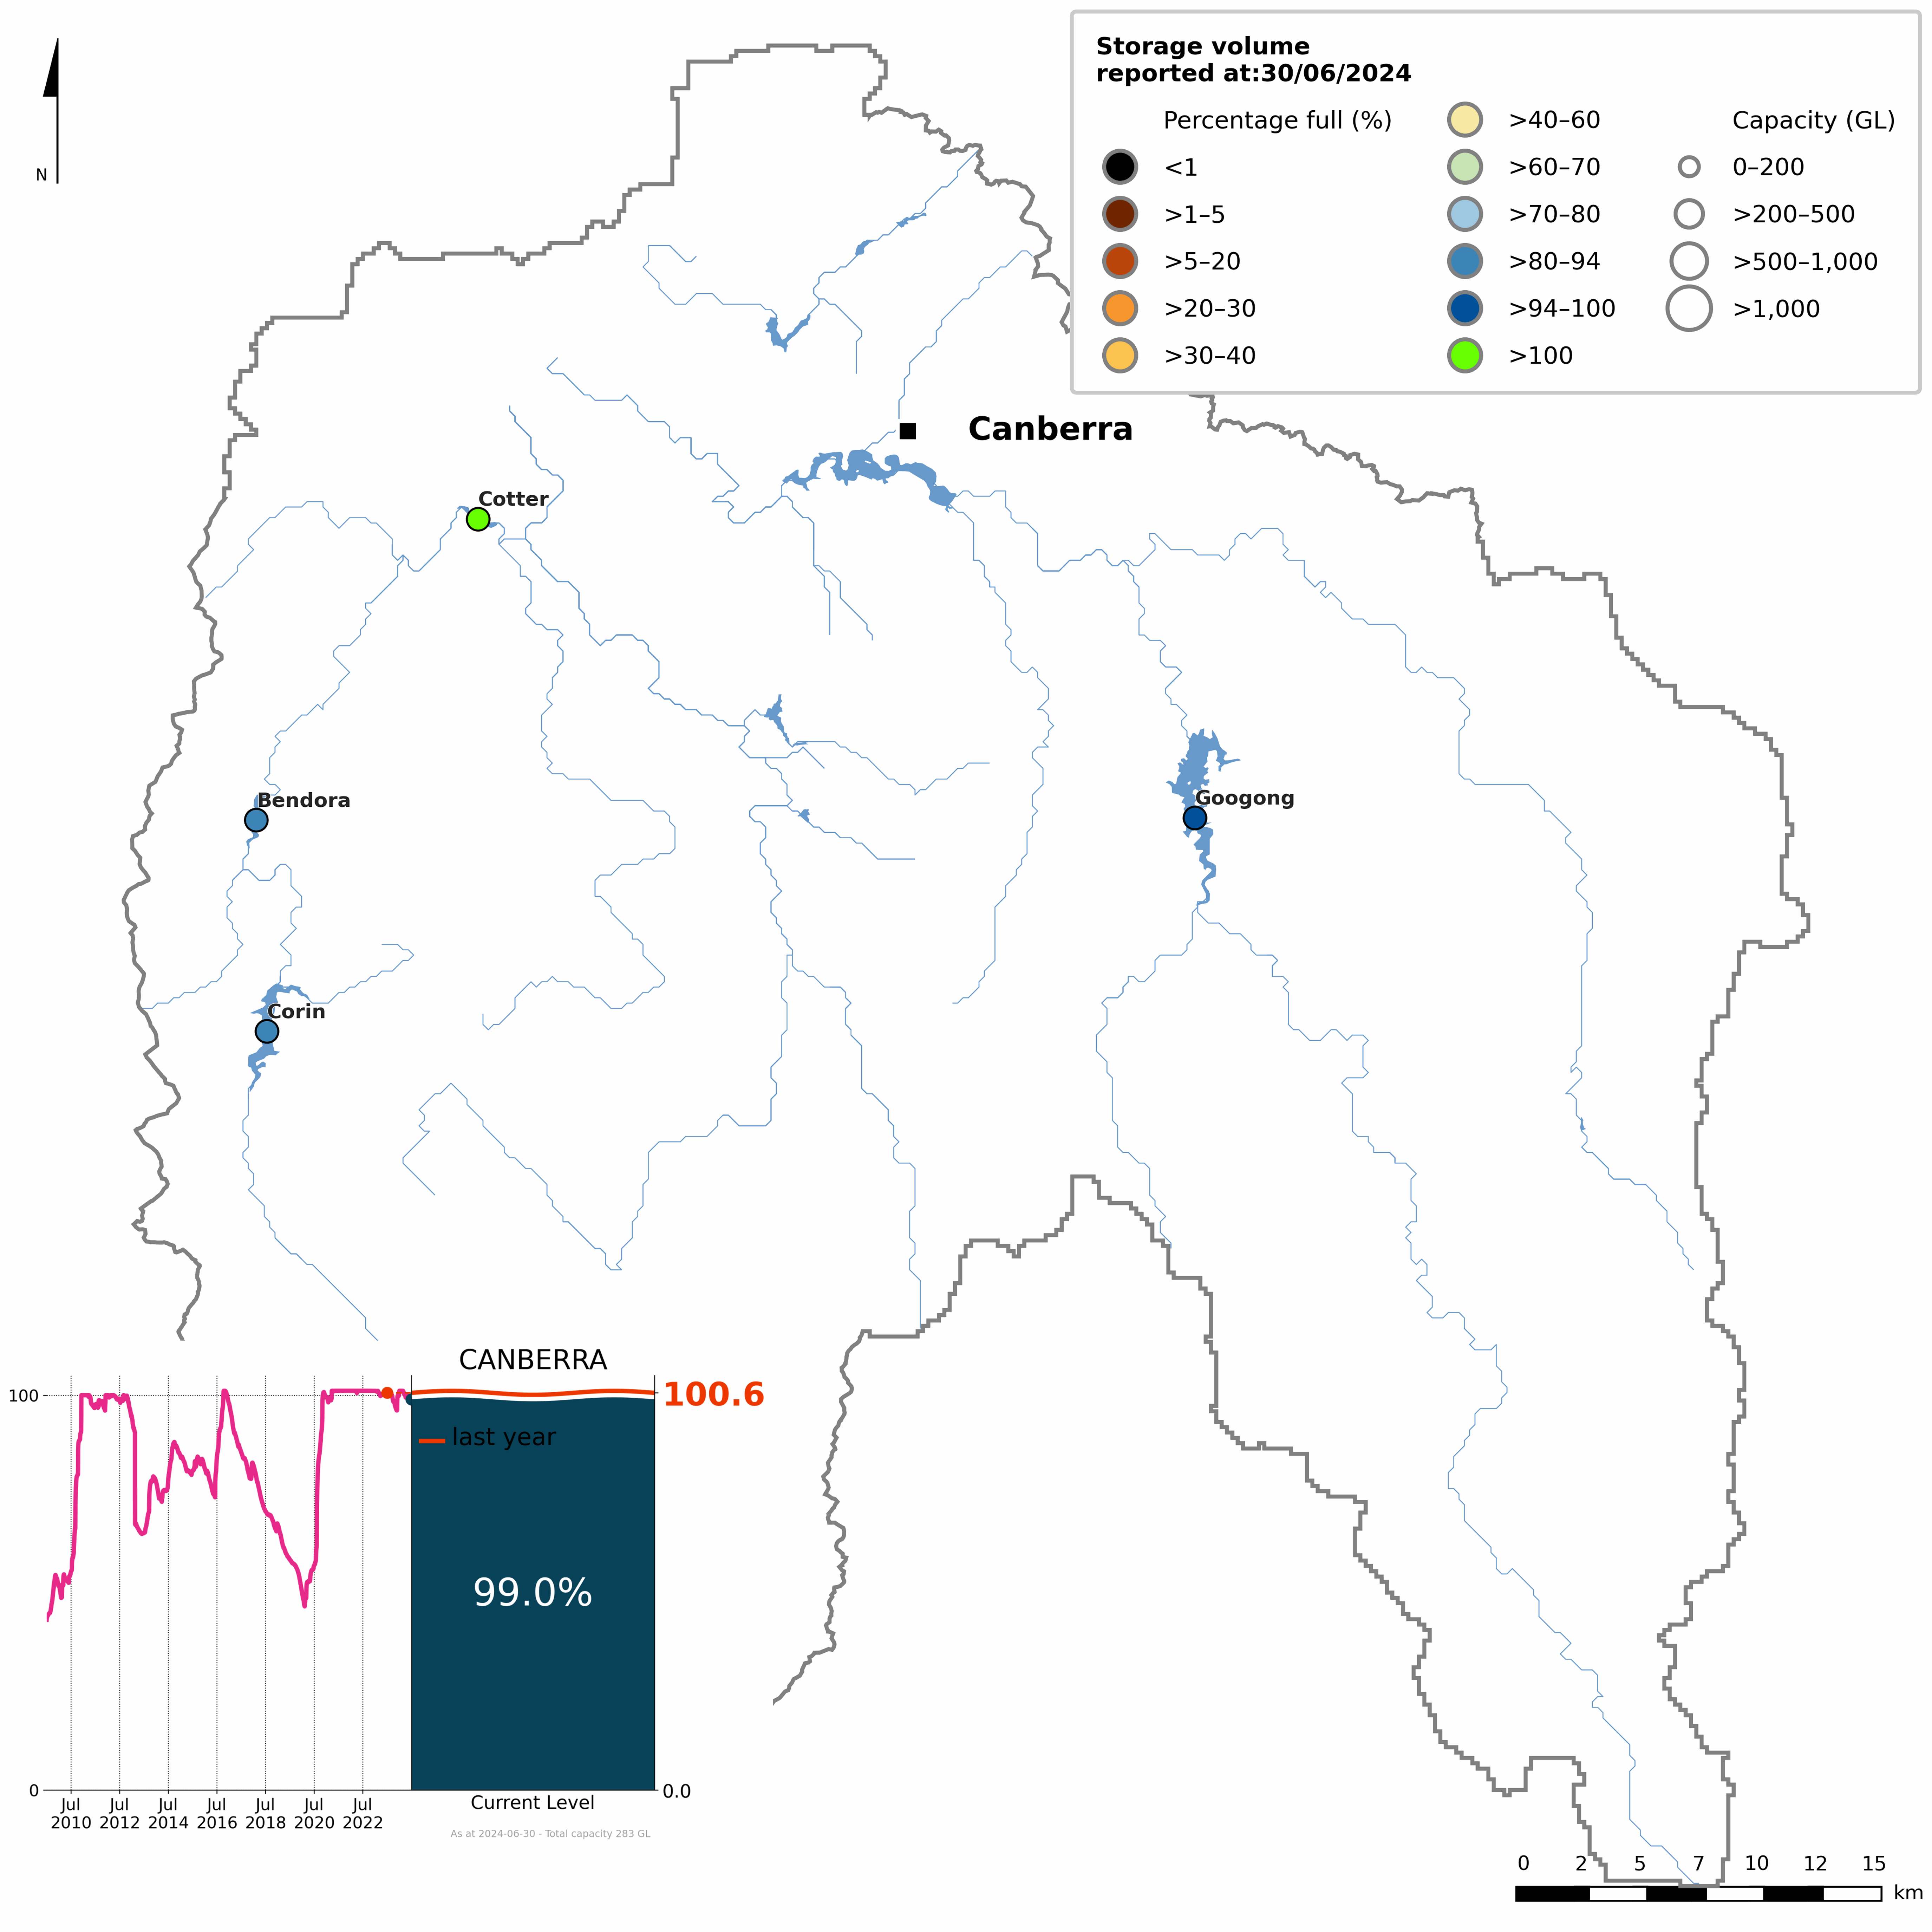
Figure S1 Percentage-full volume on 30 June 2024 for each storage and total daily storage volume from 2009–2024 (inset)
- The total storage volume in the Canberra region began the 2023–24 year at 100.6% full, following the region’s wettest three-year period on record.
- Below-average rainfall between July and October led to a gradual decline in storages, decreasing to around 96% by the end of October.
- Following the region’s seventh-wettest November on record, storages increased to approximately 102%, and remained above 100% through to the end of January.
- In response to below-average rainfall during February, storages dropping below 100%, but remained steady at approximately 99% for the remainder of the reporting year.
- By 30 June 2024, total surface water storage volume in the Canberra region was 99.0% full, with none of the individual storages falling below 80% during the reporting period.
- More detailed information on individual storages within the Canberra region is available on the Bureau of Meteorology’s Water Information Dashboard.
Water liabilities
")
- Water liabilities in the Canberra region refer to the volume of allocation remaining on licence entitlements at the end of the reporting period (30 June).
- Licences in the Canberra region do not have carryover provisions for unused allocations. As a result, any remaining allocation is forfeited at the end of the water year, and the closing balance is 0 ML for both surface water and groundwater licences.
- A more detailed description of water allocations in the Canberra region is provided in the Water use section.
| Description | 2024 | 2023 | 2022 | 2021 | 2020 | 2019 | |
| Opening balance at 01 July | 0 | 0 | 0 | 0 | 0 | 0 | |
| add | Allocation | 11,986 | 6,869 | 9,255 | 9,255 | 9,253 | 8,296 |
| less | Allocated diversion | 1,818 | 1,341 | 782 | 933 | 2,784 | 2,890 |
| less | Adjustment and forfeiture | 10,168 | 5,528 | 8,473 | 8,322 | 6,469 | 5,406 |
| Closing balance at 30 June | 0 | 0 | 0 | 0 | 0 | 0 | |
| Description | 2024 | 2023 | 2022 | 2021 | 2020 | 2019 | |
| Opening balance at 01 July | 0 | 0 | 0 | 0 | 0 | 0 | |
| add | Allocation | 2,326 | 2,341 | 4,646 | 4,698 | 2,448 | 2,537 |
| less | Allocated extraction | 639 | 453 | 319 | 549 | 1,064 | 763 |
| less | Adjustment and forfeiture | 1,687 | 1.888 | 4,327 | 4,149 | 1,384 | 1,774 |
| Closing balance at 30 June | 0 | 0 | 0 | 0 | 0 | 0 | |
- Surface water allocations in the Canberra region during 2023–24 were the highest on record, increasing by approximately 74% compared to the previous year. Groundwater allocations remained similar to the previous reporting period.
- Total surface water allocations were 12 GL across the Canberra region, while groundwater allocations were slightly over 2 GL.
- At the end of the reporting period, around 1.8 GL (15%) of surface water allocations and 0.6 GL (27%) of groundwater allocations were forfeited, with no allocations carried over into the 2024–25 water year.
Water flows
")
- Total water inflows into the Canberra region during 2023–24 were 969 GL, approximately 47% lower than the previous reporting year.
- Surface water inflows contributed 84% (810 GL) of total water inflows, primarily from runoff and inflow from outside the region, which accounted for 92% of the total surface water inflows.
- Groundwater inflows contributed 7% (67 GL) of total water inflows, with recharge from surface water making up 95% of the total groundwater inflows.
- Urban water inflows contributed 10% (93 GL) of total water inflows, entirely from diversion of surface water and wastewater collected.
- Total water outflows from the Canberra region during 2023–24 were 941 GL, approximately 59% lower than the previous reporting year.
- Surface water outflows contributed 90% (843 GL) of total water outflows, in which outflow to outside region attributed toward 82% of the total surface water outflows.
- Groundwater outflows contributed less than 1% (1 GL) of total water outflows, all from allocated extraction to individual users and extraction of statutory rights.
- Urban water outflows contributed 10% (97 GL) of total water outflows, mainly from treated wastewater discharge to surface water and supply of drinking water to residential customers, composing for 77% of the urban water outflows.
- A more detailed breakdown of inflows and outflows for the Canberra region is provided in the Statement of Changes in Water Assets and Water Liabilities.
Water availability
| Surface water | 2024 | 2023 | 2022 | 2021 | 2020 | 2019 |
| Water availability | 739,260 | 1,174,495 | 1,155,054 | 780,693 | 329,152 | 388,056 |
| Water accessible | 63,871 | 55,132 | 55,140 | 59,068 | 65,131 | 61,554 |
| Water taken | 53,703 | 49,604 | 46,667 | 50,746 | 58,662 | 56,148 |
| % water accessible taken | 84% | 90% | 85% | 86% | 90% | 91% |
- Surface water availability in the Canberra region during 2023–24 was 739 GL, 37% lower than the previous year, but 28% above the long-term average of 578 GL, reflecting the prolonged wet conditions in recent years.
- Changes to water availability across the Canberra region are heavily influenced by runoff. Generally, when runoff increases or decreases, water availability responds in a similar way.
- Despite the overall decrease in availability, surface water accessible for take in the Canberra region increased by 15% from the previous year, and was 16% above the average of 55 GL, primarily due to higher diversions to surface water users and the urban system.
- Likewise, water taken from surface water resources in the Canberra region during 2023–24 were 8% higher than the 2022-23 reporting period, and 6% above the average of 51 GL, mainly due to increased diversions to the urban system.
- The increase in both surface water accessible for take and water taken, despite the overall decline in water availability, may reflect the sustained high water availability in recent years easing pressure on water use across the Canberra region.
- Overall, approximately 84% of the surface water accessible for take in the Canberra region was taken during the reporting period, with the majority of diversions to the urban system.
Water use
")
Consumptive use
| Surface water | 2024 | 2023 | 2022 | 2021 | 2020 | 2019 |
| Individual users | 1,818 | 1,341 | 782 | 933 | 2,784 | 2,890 |
| Statutory rights | 495 | 495 | 495 | 495 | 495 | 297 |
| Urban system | 51,390 | 47,768 | 45,390 | 49,318 | 55,383 | 52,961 |
| Total | 53,703 | 49,604 | 46,667 | 50,746 | 58,662 | 56,148 |
| Groundwater | 2024 | 2023 | 2022 | 2021 | 2020 | 2019 |
| Individual users | 639 | 453 | 319 | 549 | 1,064 | 763 |
| Statutory rights | 434 | 434 | 434 | 434 | 435 | 435 |
| Total | 1,073 | 887 | 753 | 983 | 1,499 | 1,198 |
- A total of 55 GL of water was taken from surface water and groundwater resources for consumptive use in the Canberra region during 2023–24, around 8% more than the previous year, primarily due to increased surface water diversions to the urban system.
- Surface water diversions across the Canberra region were 54 GL, an increase of 8% from 2022–23, and approximately 6% above the average of 51 GL.
- Approximately 96% of surface water diversions were made to the urban system, with individual users accounting for 3% of diversions. The remaining volume of diversions were for users with statutory rights.
- Groundwater extractions in the Canberra region were just over 1 GL, with 61% of the volume extracted by individual users, while use groundwater users with statutory rights accounted for the remaining volume of groundwater extracted.
Allocations and diversions
| Surface water | 2024 | 2023 | 2022 | 2021 | 2020 | 2019 |
| Individual users | ||||||
| Carryover | 0 | 0 | 0 | 0 | 0 | 0 |
| Allocated announcements | 11,986 | 6,869 | 9,255 | 9,255 | 9,253 | 8,296 |
| Allocated diversions | 1,818 | 1,341 | 782 | 933 | 2,784 | 2,890 |
| % used | 15% | 20% | 8% | 10% | 30% | 35% |
- Total surface water allocations in the Canberra region (which excludes the urban water supply system) during 2023–24 were 12 GL, all for individual users.
- Approximately 15% of the allocated surface water in Canberra region was taken, around 36% higher than the 2022–23 reporting period, but 13% below the average of 2.1 GL.
| Groundwater | 2024 | 2023 | 2022 | 2021 | 2020 | 2019 |
| Individual users | ||||||
| Carryover | 0 | 0 | 0 | 0 | 0 | 0 |
| Allocated announcements | 2,326 | 2,341 | 4,646 | 4,698 | 2,448 | 2,537 |
| Allocated extractions | 639 | 453 | 319 | 549 | 1,064 | 763 |
| % used | 27% | 19% | 7% | 12% | 43% | 30% |
- Total groundwater allocations in the Canberra region during 2023–24 were 2.3 GL, all for private and commercial use. This was similar to last year, and close to the average of 2.4 GL.
- Approximately 27% of the allocated groundwater in the Canberra region was extracted, around 41% higher than the 2022–23 reporting period, and 6% above the average of 614 ML.
Urban supply system
| Water sources | 2024 | 2023 | 2022 | 2021 | 2020 | 2019 |
| Surface water | 51,390 | 47,768 | 45,390 | 49,318 | 55,383 | 52,961 |
| Total urban water supplied | 51,390 | 47,768 | 45,390 | 49,318 | 55,383 | 52,961 |
- A total of 51 GL of water was sourced for the urban supply system in the Canberra region during 2023–24, approximately 8% more than 2022–23, and 6% above the average of 48 GL.
- All water supplied to the Canberra region’s urban system was diverted from surface water storages, with no contribution from groundwater, inter-region inflows, or desalinated water.
- Surface water remains the dominant water resource across the Canberra region, supplying both the urban system and the majority of consumptive water use.
Water restrictions
")
- Icon Water introduced permanent water conservation measures for potable water use in November 2010, which govern how water can be used on gardens and lawns and for pool filling, car washing, and cleaning.
- For more information, refer to the Bureau of Meteorology's Water Restrictions website.