


Fitzroy: Climate and water
For the water account period 1 July 2023 to 30 June 2024
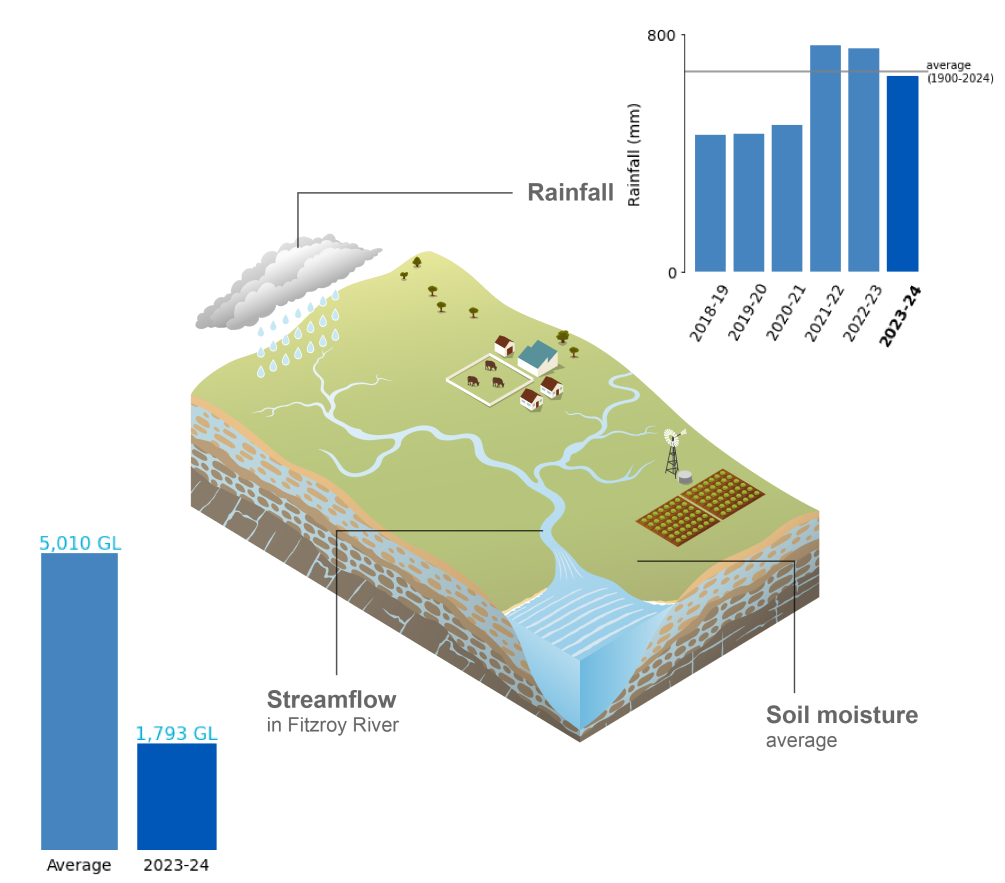
- Annual rainfall in the Fitzroy region during 2023–24 was close to average, with the 2023–24 wet season accounting for 83% of the region's total annual rainfall.
- Soil moisture in the root zone (0–1 m depth) was predominantly average throughout the reporting year, reflecting the near-average rainfall observed across the region.
- Total annual flows in the region's major rivers were below average at all sites, except for the Dawson River at Taroom. Streamflows in the Fitzroy River, the region's largest river, were 64% below the long-term average.
For further information on the region's climate and water conditions during the 2023–24 year scroll down this page or click on the links below:
About the region
- The Fitzroy region is dissected by the Tropic of Capricorn, giving rise to the region's two climatic zones — the northern and eastern areas are characterised by a subtropical climate, while the southern and western areas are characterised by a semi-arid inland subtropical climate. Summers are generally hot, with variable humidity, and winters are mild and dry.
- Rainfall in the region has high inter-annual variability, where some years are extremely wet, and others in drought. High rainfall totals are most common during the northern wet season between October and April, but are not unusual at other times of the year. Rainfall is typically higher close to the coast compared with inland areas.
- Streamflow in the region typically reflects the distribution of rainfall. Most streamflow and storage inflow occur during the northern wet season, between October and April, while streamflows can periodically cease to flow during the dry season between May and September.
Climate conditions
Rainfall
Figure C1 Annual and monthly rainfall deciles for the Fitzroy region during the 2023–24 year
- Total area-averaged rainfall in the Fitzroy region during 2023–24 was 659 mm, close to the long-term average of 676 mm.
- During the first week of July, an upper-level trough and associated cloud band brought unseasonable widespread rainfall totals of 25 to 50 mm across the region, leading to rainfall being 88% above the long-term July average.
- Between August and October, the absence of rain-bearing systems in the region resulted in little rainfall over this period. While rainfall is typical low during these months leading up to the wet season, it was the region's driest August-to-October period on record.
- In late September, an El Niño event in the tropical Pacific Ocean were declared underway (as stated in this Climate Driver Update). Historically, El Niño events increase the likelihood of below-average rainfall, particularly in winter and spring. A positive Indian Ocean Dipole (IOD) was also declared underway at the same time of the El Niño, but positive IODs have marginal influence on the region's climate.
- Severe thunderstorms impacted the region during late November, contributing toward the region's thirteenth-wettest November on record, officially marking the start of the 2023–24 wet season.
- Over the course of summer, above-average sea surface temperatures off the Queensland coastline enhanced onshore moisture, leading to rainfall being slightly above the long-term seasonal average.
- At the end of autumn, the El Niño-Southern Oscillation returned to neutral, with its influence gradually waning on the region's climate, but despite its presence throughout the 2023–24 wet season, rainfall was slightly above the long-term average, accounting for 83% of the region's rainfall during the reporting period.
- Following the conclusion of the 2023–24 wet season, the region experienced its eighteenth-driest May on record, although rainfall in June was close to average.
- More information on the 2023–24 northern wet season and Australia's climate and water during the 2023–24 reporting year can be found in Australia's 2023–24 Northern Wet Season and Financial year climate and water statement 2023–24.
Figure C2 Total monthly rainfall for the Fitzroy region during the 2023–24 year compared with the average and percentiles for the region
- Rainfall during the 2023–24 wet season was above average from November to January, and close to average in April. Only November exceeded the 90th percentile.
- Outside of the 2023–24 wet season, rainfall was above average in July and June, though both months ranked well short of the 90th percentile.
- August to October equal to or below the 10th percentile, while rainfall in May also ranked close to the 10th percentile.
Actual evapotranspiration
Figure C3 Annual and monthly actual evapotranspiration deciles for the Fitzroy region during the 2023–24 year
- Total area-averaged actual evapotranspiration was predominantly average in the Fitzroy region during 2023–24, with near-average rainfall maintaining water availability across the region.
- Unseasonable rainfall maintained near-average evapotranspiration across the region during July.
- Following the region's driest August-to-October period on record, water availability declined across the region, resulting in evapotranspiration dropping to below average levels in September and October, leading up to the 2023–24 northern wet season.
- On the back of the region's thirteenth-wettest November on record, evapotranspiration improved, but remained average to below average across most of the region.
- Evapotranspiration further improved in December, following late-November rainfall, and remained predominantly above average throughout summer.
- In response to below-average rainfall during February and March, evapotranspiration became average to below average in March, but rebounded in April, becoming average to above average, with above-average evapotranspiration prominent in the south.
- Throughout most of the 2023–24 wet season, evapotranspiration was average to above average, primarily due to above-average rainfall from November to January.
- After the conclusion of the 2023–24 wet season, with little rainfall observed across the region in May, evapotranspiration decreased again, becoming below average by the end of the reporting period.
Soil moisture
Figure C4 Annual and monthly soil moisture deciles for the Fitzroy region during the 2023–24 year
- Soil moisture in the root zone (0–1m depth) was average across most of the Fitzroy region during 2023–24, reflecting the near-average rainfall observed across the region.
- Despite unseasonable rainfall occurring in July, soil moisture was average to below average across most of the region.
- Following the region's driest August-to-October period on record, soil moisture decreased rapidly, becoming below average across most of the region, with the lowest soil moisture on record reaching its greatest extent in October.
- In response to the region's thirteenth-wettest November on record, soil moisture rebounded in November, becoming predominantly average to above average in December, and remained above average throughout summer, with above-average rainfall maintaining moisture in the region's soils.
- By the end of the 2023–24 wet season, soil moisture was above average across most of the southern half of the region, and average across the northern half.
- Although little rainfall was observed across the region in May, soil moisture remained predominantly average through to the end of June.
- More information on the soil moisture conditions across the Fitzroy region during the 2023–24 reporting year is available on the Australian Water Outlook.
Streamflow responses
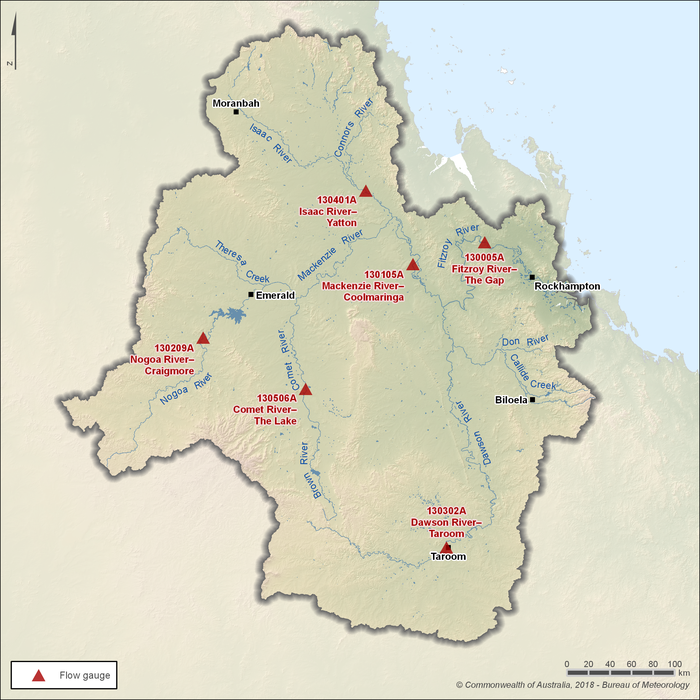
Figure C5 Key flow gauging stations along the main rivers within the Fitzroy region
- The Comet, Dawson, Isaac, Mackenzie, and Nogoa rivers are major tributaries of the Fitzroy River, which flows through Rockhampton, and drains into the World Heritage listed Great Barrier Reef Lagoon.
- These six river catchments correspond to the six sub-basins used for environmental water management (see Water management in 'Region description' for more information).
- Six gauging stations, one on each river system, are used to represent seasonal flow patterns in the region's rivers. Most of the rivers and creeks in the region can cease to flow between May and October.
- Releases from Fairbairn Dam regulate flows in the Nogoa River for water supply during the dry season. As a result, flows in the lower reaches of the Fitzroy River are generally perennial.
Figure C6 Total monthly flow for major rivers in the Fitzroy region during the 2023–24 year compared with the average and percentiles
- Total annual flows in the region's major rivers were below average at all sites, except for the Dawson River at Taroom (Station 130302A), where total annual flows were 443 GL, 6% above the long-term average of 419 GL.
- Streamflows in the Fitzroy River at The Gap (Station 130005A), the region's largest river, were 1,793 GL during the reporting period, 64% below the long-term average of 5,012 GL. Likewise, streamflows in the Mackenzie River at Coolmaringa (Station 130105B), the region's second largest river, were 72% below the long-term average of 4,356 GL. Combined, streamflows across the two river systems were 68% below the long-term annual average.
- Following the region's driest August-to-October period on record, streamflows decreased to low flows at all sites, and periodically ceased at some sites between August and November.
- Although rainfall was above average from November to January, streamflows remained below average at most sites, except for the Dawson River, where streamflows were above average during January and February.
- By the end of the 2023–24 wet season, streamflows returned to low flows, except for the Dawson River in April, where streamflows rose above the 90th percentile.
- With little rainfall observed during May, streamflows remained low through to the end of the reporting period, with the Nogoa River at Craigmore (Station 130209A) ceasing to flow during May and June.