


Fitzroy: Supporting information
For the water account period 1 July 2023 to 30 June 2024
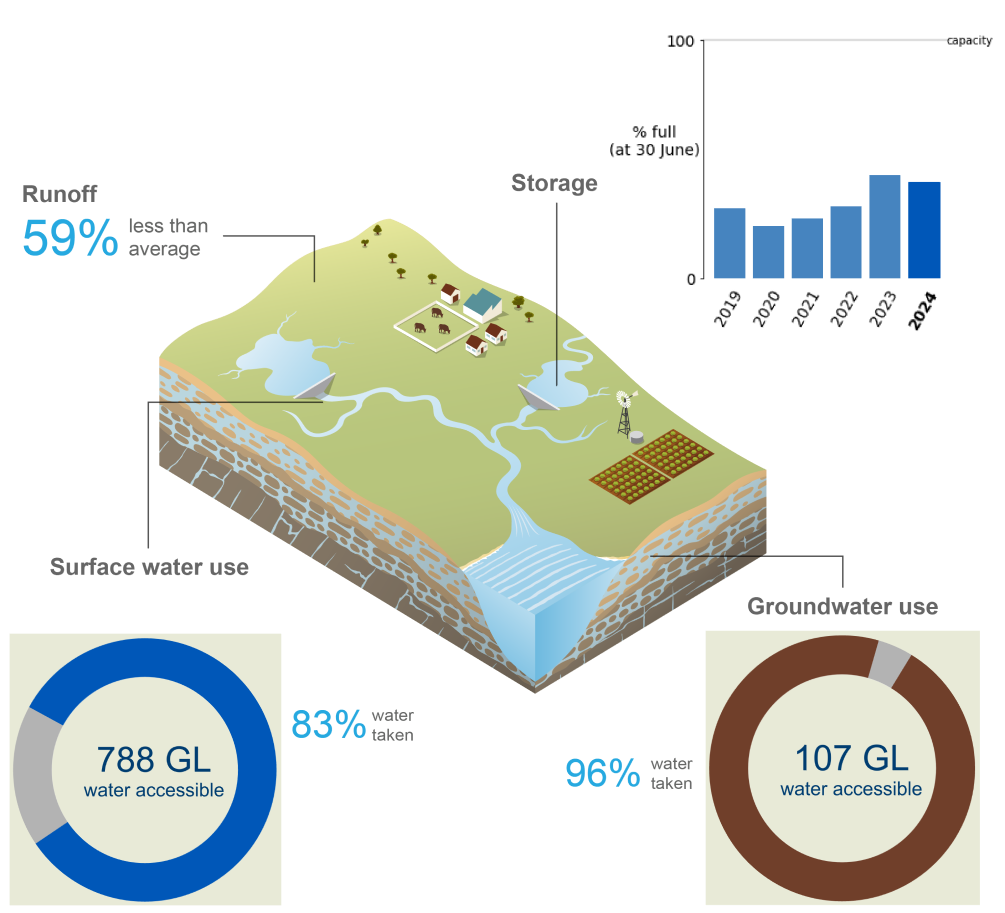
- Annual rainfall in the Fitzroy region during 2023–24 was close to average, with the driest August-to-October period on record contributing to below-average runoff and surface water inflows into the region's surface water storages.
- Total storage volume in the Fitzroy region decreased by 2.7% during the reporting year, finishing at 40.7% full on 30 June 2024.
- Approximately 84% of the surface water and groundwater resources in the Fitzroy region were taken, primarily for allocated and non-allocated surface water diversions to various users.
For further information on the regions water accounting statements scroll down this page or click on the links below:
Water assets
")
- The total volume of water assets in the Fitzroy region was 692 GL on 30 June 2024, with approximately 96% of the water assets held in surface water storages.
- Aquifers accounted for approximately 2% of the total water assets in the Fitzroy region, while the remaining volume of water assets was contained in rivers.
- A detailed breakdown of water assets in the Fitzroy region in available in the Statement of Water Assets and Water Liabilities.
| Surface water | 2024 | 2023 | 2022 | 2021 | 2020 | 2019 |
| Bedford Weir | 15,739 | 15,892 | 15,875 | 15,791 | 14,519 | 15,681 |
| Bingegang Weir | 5,222 | 4,797 | 6,764 | 3,964 | 3,260 | 6,000 |
| Callide | 21,091 | 27,093 | 31,107 | 28,450 | 39,719 | 64,154 |
| Fairbairn | 453,224 | 504,169 | 268,034 | 203,746 | 143,528 | 233,857 |
| Fitzroy Barrage | 58,552 | 56,999 | 59,844 | 56,502 | 58,389 | 59,865 |
| Glebe Weir | 17,478 | 17,065 | 17,495 | 17,471 | 17,456 | 17,278 |
| Gyranda Weir | 14,437 | 11,136 | 14,659 | 10,052 | 7,727 | 9,415 |
| Kroombit | 107 | 98 | 93 | 64 | 144 | 116 |
| Mount Morgan No.7 | 2,613 | 1,044 | 556 | 135 | 608 | 1,157 |
| Moura Offstream Storage | 2,572 | 2,347 | 2,674 | 2,527 | 2,416 | 1,113 |
| Moura Weir | 6,696 | 4,254 | 7,206 | 6,906 | 6,362 | 6,297 |
| Neville Hewett Weir | 9,722 | 8,443 | 10,307 | 9,056 | 8,722 | 8,570 |
| Tartrus Weir | 10,679 | 8,987 | 9,604 | 5,892 | 9,309 | 9,551 |
| Theodore Weir | 4,011 | 4,003 | 4,004 | 4,123 | 4,028 | 4,067 |
| Accessible total | 622,143 | 666,328 | 448,341 | 364,584 | 316,226 | 437,139 |
| Dead storage | 44,942 | 44,942 | 44,942 | 44,942 | 44,942 | 44,942 |
| Total storage | 667,085 | 711,270 | 493,283 | 409,526 | 361,168 | 482,081 |
| Total capacity | 1,640,139 | 1,640,139 | 1,640,139 | 1,640,139 | 1,640,139 | 1,640,139 |
| % Full | 40.7% | 43.4% | 30.1% | 25.0% | 22.0% | 29.4% |
- The total storage volume in the Fitzroy region decreased 2.7% during 2023–24, finishing at 40.7% full on 30 June 2024.
- Lake Maraboon, formed by Fairbairn Dam, accounts for 80% of the region's total surface water storages.
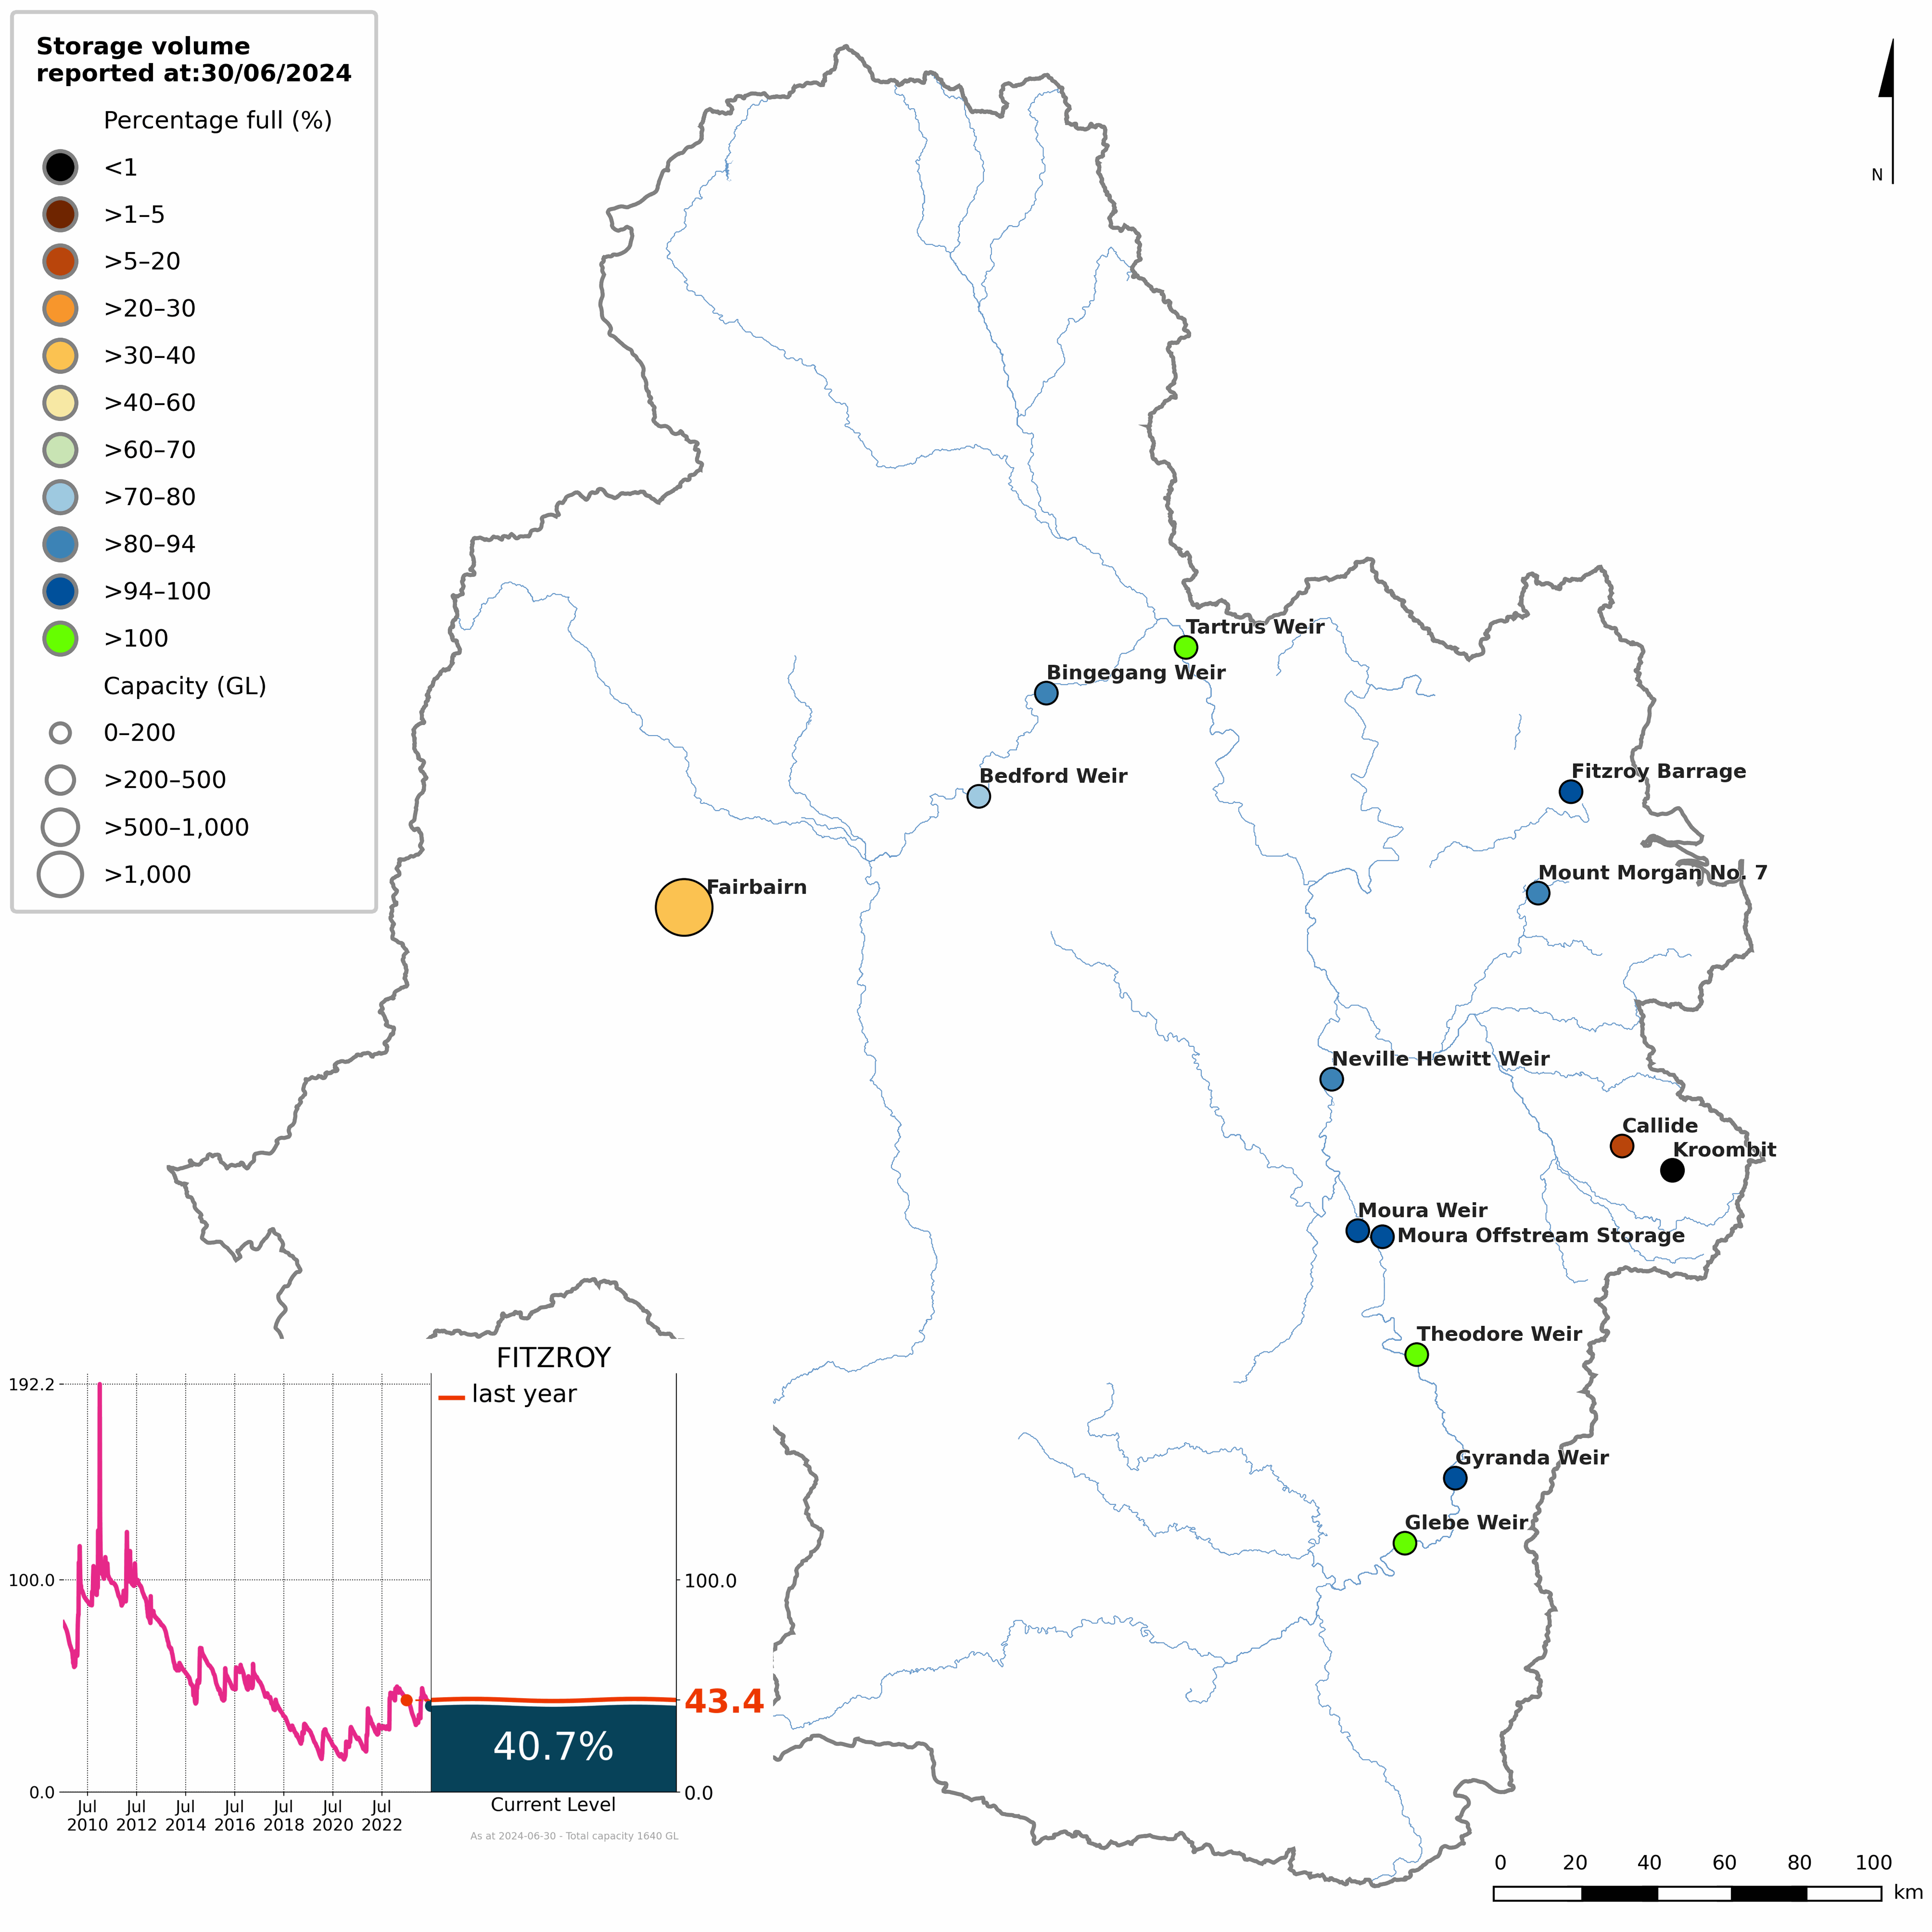
Figure S1 Percentage-full volume on 30 June 2024 for each storage and total storage volume from 2010 to 2024 (inset)
- The total storage volume in the Fitzroy region began the 2023–24 year at 43.4% full—the highest opening storage volume since 2016–17.
- Following the region's driest August-to-October period on record, storages across the Fitzroy region dropped to approximately 30% during December—the lowest storages have been since October 2022.
- In response to the remnants of ex-Tropical Cyclone Kirrily bringing widespread rainfall to the area during the last week of January, storages rebounded, increasing to approximately 50% in early February, before storages gradually declined through to the end of the 2023–24 reporting period.
- By 30 June 2024, the total storage volume in the Fitzroy region was 40.7% full—down 2.7% from the same time last year.
- Fairbairn Reservoir, the largest storage in the region, began the year at 39.7% full and ended at 35.8% full.
- More detailed information on individual storages in the Fitzroy region is available on the Bureau of Meteorology's Water Information Dashboard.
Water liabilities
")
- Water liabilities in the Fitzroy region refer to the volume of allocation remaining on licence entitlements at the end of the reporting period (30 June).
- Licences in the Fitzroy region do not have carryover provisions for unused allocations. As a result, any remaining allocation is forfeited at the end of the water year, and the closing balance is 0 ML for both surface water and groundwater licences.
- A more detailed description of water allocations in the Fitzroy region is provided in the Water use section.
| Description | 2024 | 2023 | 2022 | 2021 | 2020 | 2019 | |
| Opening balance at 01 July | 0 | 0 | 0 | 0 | 0 | 0 | |
| add | Allocation | 390,263 | 390,263 | 386,526 | 303,054 | 308,379 | 378,698 |
| less | Allocated diversion | 253,411 | 179,414 | 205,073 | 167,811 | 217,518 | 216,681 |
| less | Adjustment and forfeiture | 136,852 | 210,849 | 181,453 | 135,243 | 90,861 | 162,017 |
| Closing balance at 30 June | 0 | 0 | 0 | 0 | 0 | 0 | |
| Description | 2024 | 2023 | 2022 | 2021 | 2020 | 2019 | |
| Opening balance at 01 July | 0 | 0 | 0 | 0 | 0 | 0 | |
| add | Allocation | 14,500 | 14,500 | 14,500 | 15,009 | 15,294 | 15,383 |
| less | Allocated extraction | 9,904 | 7,152 | 7,211 | 10,268 | 11,545 | 12,847 |
| less | Adjustment and forfeiture | 4,596 | 7,3485 | 7,289 | 4,741 | 3,749 | 2,536 |
| Closing balance at 30 June | 0 | 0 | 0 | 0 | 0 | 0 | |
- Surface water allocations in the Fitzroy region were 390 GL for 2023–24, while groundwater allocations were 14.5 GL, both of which were similar to the previous few reporting periods.
- At the end of the 2023–24 reporting period, approximately 35% (137 GL) of surface water allocations and 32% (4.6 GL) of groundwater allocations were forfeited, with no unused allocations carried over into the 2024–25 water year.
Water flows
")
- Total water inflows into the Fitzroy region during 2023–24 were 4,001 GL, approximately 28% lower than the previous year.
- Surface water inflows contributed 74% (2,972 GL) of total water inflows, primarily from runoff, accounting for 91% of the total surface water inflows.
- Runoff into the region's surface water storages was 58% below the long-term average of 6,599 GL (based on area-averaged modelled data from 1971 to 2023).
- Groundwater inflows contributed 26% (1,029 GL) of total water inflows, all of which was recharge from surface water.
- Total water outflows from the Fitzroy region during 2023–24 were 4,362 GL, approximately 26% lower than the previous year.
- Surface water outflows contributed 98% (4,259 GL) of total water outflows, with outflow to sea and recharge to groundwater comprising for 70% of the total surface water outflows.
- Outflow to sea from the region's rivers was 67% below the long-term average of 5,954 GL (based on modelled data from 1971 to 2023).
- Groundwater outflows contributed 2% (102 GL) of the total water outflows, mostly from non-allocated extractions to various users, constituting for 90% of the total groundwater outflows.
- A detailed breakdown of inflows and outflows for the Fitzroy region is available in the Statement of Changes in Water Assets and Water Liabilities.
Water availability
| Surface water | 2024 | 2023 | 2022 | 2021 | 2020 | 2019 |
| Water availability | 3,554,540 | 4,782,191 | 3,622,260 | 1,447,465 | 3,470,073 | 3,004,517 |
| Water accessible | 787,725 | 698,439 | 789,303 | 640,078 | 631,342 | 480,052 |
| Water taken | 650,873 | 487,590 | 607,850 | 504,835 | 540,481 | 318,035 |
| % water accessible taken | 83% | 70% | 77% | 79% | 86% | 66% |
- Surface water availability in the Fitzroy region during 2023–24 was approximately half the long-term average of 7,148 GL, and 26% lower than the previous year, reflecting the decrease in runoff across the region.
- Changes in water availability across the Fitzroy region are heavily influenced by runoff. Generally, when runoff increases or decreases, water availability responds in a similar way.
- Despite the decrease in water availability, surface water accessible for take in the Fitzroy region was 13% higher than the previous reporting period, and 23% above the average of 639 GL, primarily due to increased (allocated and non-allocated) diversions to irrigation users.
- Likewise, water taken from surface water resources in the Fitzroy region were 33% higher than the previous year, and 33% above the average of 491 GL.
- The increase in water accessible for take and water taken during 2023–24 may reflect the increased demand for water, particularly during the record dry period between August and October.
- Overall, approximately 93% of the surface water accessible for take in the Fitzroy region was taken, primarily for diversions to irrigation and agricultural users.
Water use
")
Consumptive use
| Surface water | 2024 | 2023 | 2022 | 2021 | 2020 | 2019 |
| Individual users | - | - | - | 332,648 | 318,592 | 99,221 |
| Agriculture users | 123,031 | 116,566 | 170,992 | - | - | - |
| Industrial users | 44,988 | 43,433 | 50,004 | 55,234 | 56,438 | 58,205 |
| Inter-region supply | - | - | - | - | - | - |
| Irrigation users | 466,489 | 311,578 | 361,477 | 105,781 | 153,632 | 137,235 |
| Mining users | 1,800 | 1,800 | 9,300 | - | - | - |
| Other users | 2,961 | 3,018 | 4,462 | 490 | 505 | 14,635 |
| Stock and domestic | 244 | 242 | 242 | - | - | - |
| Urban users | 11,360 | 10,953 | 11,373 | 10,682 | 11,314 | 8,739 |
| Total | 650,873 | 487,590 | 607,850 | 504,835 | 540,481 | 318,035 |
| Groundwater | 2024 | 2023 | 2022 | 2021 | 2020 | 2019 |
| Individual users | - | - | - | 44,585 | 41,663 | 44,048 |
| Agriculture users | 5,661 | 5,379 | 9,395 | - | - | - |
| Industrial users | 26,641 | 27,176 | 26,673 | - | - | - |
| Irrigation users | 55,806 | 50,881 | 53,503 | 59,479 | 61,174 | 63,125 |
| Mining users | 5,617 | 5,617 | 6,992 | - | - | - |
| Other users | 5,116 | 5,081 | 5,624 | - | - | - |
| Stock and domestic | 1,356 | 1,359 | 1,383 | - | - | - |
| Urban users | 2,191 | 2,113 | 1,938 | 3,077 | 3,051 | 1,984 |
| Total | 102,388 | 97,606 | 105,508 | 107,141 | 105,888 | 109,157 |
- A total of 753 GL of water was taken from surface water and groundwater resources for consumptive use in the Fitzroy region during 2023–24, approximately 29% more than the previous year, primarily due to increased surface water (allocated and non-allocated) diversions to irrigation users.
- Surface water diversions across the Fitzroy region were 651 GL, around 33% higher than the previous year, and 32% above the average of 491 GL.
- Approximately 72% of the surface water diversions in the Fitzroy region were to irrigation users, while agricultural users accounted for 19% of the surface water diversions. The remaining volume of diversions were for industrial users (7%), urban users (2%), other users, mining users, and stock and domestic purposes.
- Non-allocated surface water diversions accounted for 61% of all surface water diversions, while the remaining volume of diversions were for allocated purposes.
- Groundwater extractions across the Fitzroy region were 102 GL, around 5% more than last year, and 11% above the average of 93 GL.
- Around 90% of the groundwater extractions were for non-allocated purposes (mainly non-allocated extractions to irrigation and industrial users), with the remaining volume of extractions made for allocated purposes (primarily allocated extractions to irrigation users).
Allocations and diversions
| Surface water | 2024 | 2023 | 2022 | 2021 | 2020 | 2019 |
| Individual users | ||||||
| Carryover | 0 | 0 | 0 | 0 | 0 | 0 |
| Allocated announcements | 390,263 | 390,263 | 386,526 | 303,054 | 308,379 | 378,698 |
| Allocated diversions | 253,411 | 179,414 | 205,073 | 167,811 | 217,518 | 216,681 |
| % used | 65% | 46% | 53% | 55% | 71% | 57% |
- Total surface water allocations in the Fitzroy region during 2023–24 were 390 GL, similar to the previous few years, and around 7% above the average of 364 GL.
- Approximately 65% of the surface water allocated in the Fitzroy region was used, primarily for allocated diversions to irrigation users.
- The portion of allocated surface water not abstracted by the end of the water year was forfeited, resulting in no carryover for the start of the next water year.
| Groundwater | 2024 | 2023 | 2022 | 2021 | 2020 | 2019 |
| Individual users | ||||||
| Carryover | 0 | 0 | 0 | 0 | 0 | 0 |
| Allocated announcements | 14,500 | 14,500 | 14,500 | 15,009 | 15,294 | 15,383 |
| Allocated extractions | 9,904 | 7,152 | 7,211 | 10,268 | 11,545 | 12,847 |
| % used | 68% | 49% | 50% | 68% | 75% | 84% |
- Total groundwater allocations in the Fitzroy region during 2023–24 were 14.5 GL, all for individual users. This was similar to the previous few years.
- Approximately 68% of the groundwater allocated in the Fitzroy region was extracted, primarily for allocated extractions to irrigation users.
- The portion of allocated groundwater not abstracted by the end of the water year is forfeited, resulting in no carryover for the start of the next water year.