


Perth: Climate and water
For the water account period 1 July 2023 to 30 June 2024
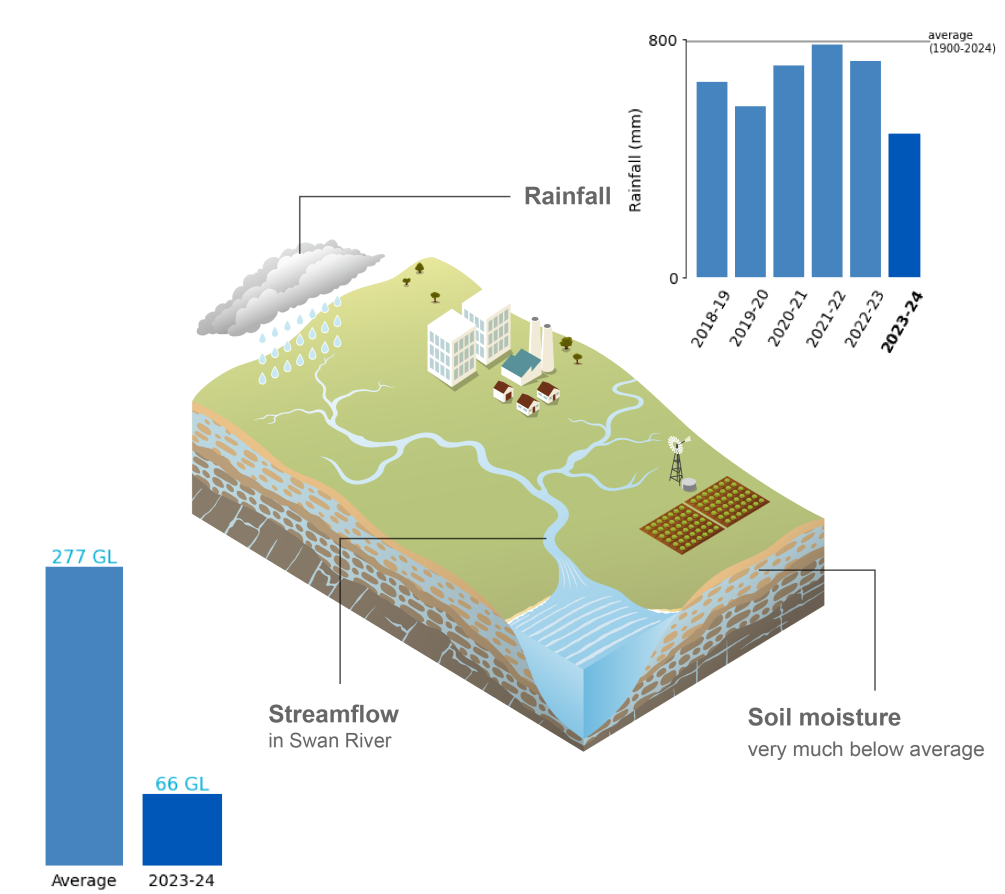
- Annual rainfall in the Perth region during 2023–24 was the lowest on record, which included the driest October-to-April period on record.
- Soil moisture in the root zone (0–1 m depth) was very much below average across most of the region throughout the reporting period, with areas around Perth and Northam recording their lowest soil moisture on record.
- Total annual flows were below average at all sites, with the Swan River recording just 24% of its long-term average, reflecting the persistently dry conditions throughout the year.
- Groundwater levels in the Gnangara Mound superficial aquifer decreased by approximately 0.5 m, while levels in the Jandakot Mound superficial aquifer increased by around 0.5 m.
For further information on the region's climate and water conditions during 2023–24 scroll down this page or click on the links below:
About the region
- The Perth region experiences a hot-summer Mediterranean climate, characterised by warm to hot dry summers and cool to mild wet winters.
- Approximately 80% of the Perth region’s annual rainfall occurs between May and October, primarily due to cold fronts and low-pressure troughs that sweep across the region. Rainfall from November to April is typically sparse, with the occasional rainless month.
- Streamflows in the Perth region’s rivers generally reflect the seasonal rainfall pattern, with most surface water storage inflows occurring between June and October. In contrast, streamflows can cease to flow between December and April.
Climate conditions
Rainfall
Figure C1 Annual and monthly rainfall deciles for the Perth region during 2023–24
- Total area-averaged rainfall in the Perth region during 2023–24 was 483 mm, 39% below the long-term average of 794 mm, making it the region's driest year on record, and the sixth consecutive year with below-average rainfall.
- Since 2000, annual rainfall has exceeded the long-term average on only four occasions, reflecting the ongoing drying trend in the Perth region’s climate.
- The Perth region experienced its seventeenth-driest winter on record, including its tenth-driest August, primarily due to the infrequent passage of cold fronts that typically deliver winter rainfall.
- From October to April, a significant lack of rain-bearing systems resulted in the Perth region receiving only 22% of its long-term average rainfall for this period, which contributed to the region's driest October-to-April period on record.
- In May, several cold fronts swept across the Perth region and brought much-needed rainfall, but despite this, monthly rainfall was still 17% below the long-term May average.
- Although additional rain-bearing systems produced further rainfall across the Perth region in June, rainfall remained 28% below the long-term June average, concluding what was officially the driest year on record for the region.
- More information on Australia's climate and water during the 2023-24 reporting period can be found in the Financial Year Climate and Water Statement 2023–24.
Figure C2 Total monthly rainfall for the Perth region during 2023–24 compared with the average and percentiles for the region
- No month in the Perth region recorded above-average rainfall during 2023–24, reflecting the persistently dry conditions across the reporting period.
- During the region’s driest October-to-April period on record, rainfall in October, November, December, and April ranked at or below the 10th percentile.
- Rainfall in August also ranked below the 10th percentile, further contributing to the region’s record-low annual total.
Actual evapotranspiration
Figure C3 Annual and monthly actual evapotranspiration deciles for the Perth region during 2023–24
- Total area-averaged actual evapotranspiration was very much below average across most of the Perth region during 2023–24, with isolated areas in the southern and northern fringes experiencing their lowest evapotranspiration on record. This was due to the region’s driest year on record, which significantly reduced water availability across the region.
- From July to September, despite below-average rainfall, the Perth region received enough moisture to support mostly average actual evapotranspiration, with areas of both above-average and below-average conditions scattered throughout the region.
- Following the Perth region’s fourth-driest October on record, actual evapotranspiration declined sharply, remaining below average during the region's driest October–to–April period on record.
- Areas with the lowest actual evapotranspiration began to emerge in October, becoming scattered but persistent across the region, reaching the greatest extent in April, when evapotranspiration was the lowest on record across almost the entire Perth region.
- Although rainfall in May and June remained below average, it was sufficient enough to slightly improve water availability across the Perth region. As a result, actual evapotranspiration increased slightly, but remained predominantly below average through to the end of the reporting period.
Soil moisture
Figure C4 Annual and monthly soil moisture deciles for the Perth region during 2023–24
- Soil moisture in the root zone (0–1 m depth) was predominantly very much below average across the Perth region during 2023–24, with areas around Perth and Northam recording their lowest soil moisture on record, reflecting the region’s driest reporting year on record.
- Throughout winter and early spring, soil moisture in the Perth region was generally average to below average, reflecting the below-average rainfall across the region.
- Following the region's fourth-driest October on record, soil moisture continued to decline, becoming very much below average across most of the Perth region, reaching its greatest extent in December, when the lowest soil moisture on record was observed in several areas.
- Despite minimal rainfall in January, soil moisture rebounded slightly, but remained average to below average across the Perth region. These conditions persisted through to March, even in the absence of significant rainfall.
- In response to the region's fifth-driest April on record, soil moisture declined sharply, with the lowest soil moisture on record developing in the southwestern part of the Perth region during April.
- Although rainfall in May and June remained below average, soil moisture improved to near-average conditions heading into winter.
- More information on the soil moisture conditions across the Perth region during the 2023–24 reporting year is available on the Australian Water Outlook.
Hydrological responses
Streamflow
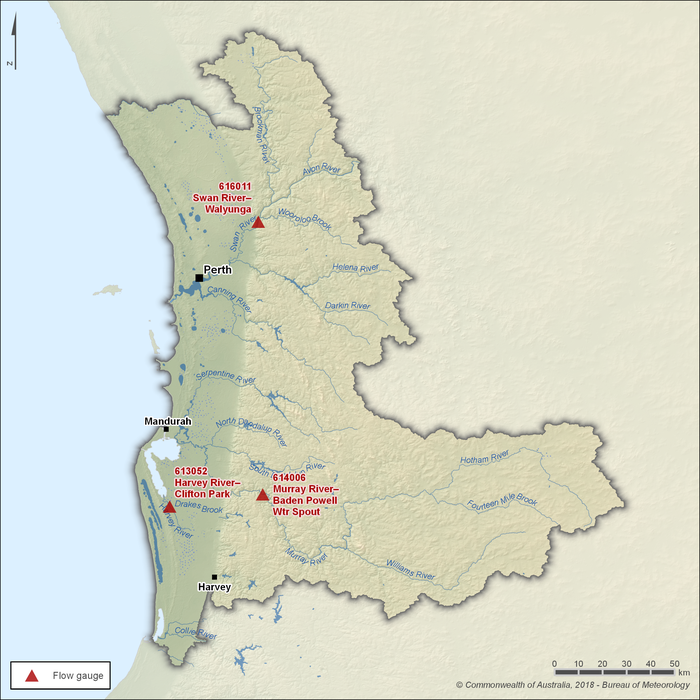
Figure C5 Key flow gauging stations along the main rivers within the Perth region
- Three gauging stations—Swan River at Walyunga (Station 616011), Harvey River at Clifton Park (Station 613052), and Murray River at Baden Powell Water Spout (Station 614006)—are used to represent the seasonal flow patterns in the Perth region.
- The Swan, Murray, and Harvey rivers are the largest rivers in the Perth region. The Swan River catchment extends eastward beyond the region, where it is known as the Avon River, while the Murray and Harvey River catchments lie entirely within the region.
- Flows in the Swan and Murray rivers are unregulated, whereas the Harvey River is regulated by Harvey Dam.
Figure C6 Total monthly flow for major rivers in the Perth region during 2023–24 compared with the average and percentiles
- Total annual flows in Perth region’s major rivers during 2023–24 were well below average, with a combined total of 232.7 GL recorded across the three key gauging stations, 64% below the long-term average of 652.4 GL, reflecting the region’s driest year on record.
- Flows in the Swan River at Walyunga (Statoin 616011) during 2023–24 were 24% of the annual average of 277 GL, while streamflows in the Harvey River at Forrest Highway (Station 613036) and Murray River at Baden Powell (Statoin 614006) were 42% and 62% below the respective long-term averages.
- Streamflows in the Perth region typically peak between June and October, but due to below-average winter rainfall, flows at all sites remained below average throughout winter and early spring.
- Although streamflows usually decline during spring, extremely dry conditions following October led to persistently low flows, reflecting the region’s driest October–to–April period on record.
- From December to May, flows in the Swan River ceased entirely, while the Harvey and Murray rivers remained near or below the 10th percentile, further reflecting the prolonged dry period.
- While cold fronts in May and June brought some relief to the Perth region, streamflows at all monitored sites remained below average, hovering near the 10th percentile through to the end of the reporting year.
Groundwater levels
- The Perth region includes a number of important aquifers such as the Superficial aquifers (Gnangara and Jandakot mounds), as well as the deeper confined aquifers located at Leederville and Yarragadee:
- The shallow Superficial aquifers are an important source of water for public and self-supply purposes. They also support numerous groundwater-dependent ecosystems in the Gnangara and Jandakot mounds.
- The deeper confined aquifers (e.g. Leederville and Yarragadee) are a major source of water for the urban water supply system.
Figure C7 Groundwater levels for key bores within the Perth region from 2010–2024
- Groundwater levels in the Gnangara Mound superficial aquifer decreased by approximately 0.5 m during 2023–24, ending the year slightly below the historical average. This decline was mainly due to below-average rainfall over the past six years (2018–2023) combined with increased groundwater extractions.
- In contrast, groundwater levels in the Jandakot Mound superficial aquifer increased by about 0.5 m during 2023–24, finishing the year slightly above the historical average.
- The Jandakot aquifer is smaller and shallower than the deeper Gnangara aquifer, making it more susceptible to sudden changes in groundwater levels.
- For the deeper confined aquifers—the Leederville and Yarragadee aquifers—groundwater level fluctuations are influenced more by urban water use than by climate, due to separation from the surface by low-permeability aquitards (shale and clay layers).
- Despite below-average winter rainfall, both the Gnangara and Jandakot superficial aquifers experienced slight rises in groundwater levels due to recharge from mid-August rainfall.
- The driest October–to-April period on record caused a significant decline in groundwater levels in both superficial aquifers, with the Jandakot aquifer falling by nearly 1.5 m over this period.
- On the back of the region's fifth-driest April on record, Gnangara groundwater levels continued to decline, before rising by 2.88 m at the end of June. In contrast, the Jandakot aquifer continued to decline during autumn, reaching its lowest level of 6.04 m by season’s end.
- Throughout May and June, several cold fronts delivered rainfall to the region, and although groundwater levels in the Gnangara aquifer remained steady, groundwater levels in the Jandakot aquifer rose by over one metre during May.
- More information on Perth's groundwater resources can be found in the Region description.
Note: groundwater data for the Leederville aquifer was only available up to March 2024.