


Perth: Supporting information
For the water account period 1 July 2023 to 30 June 2024
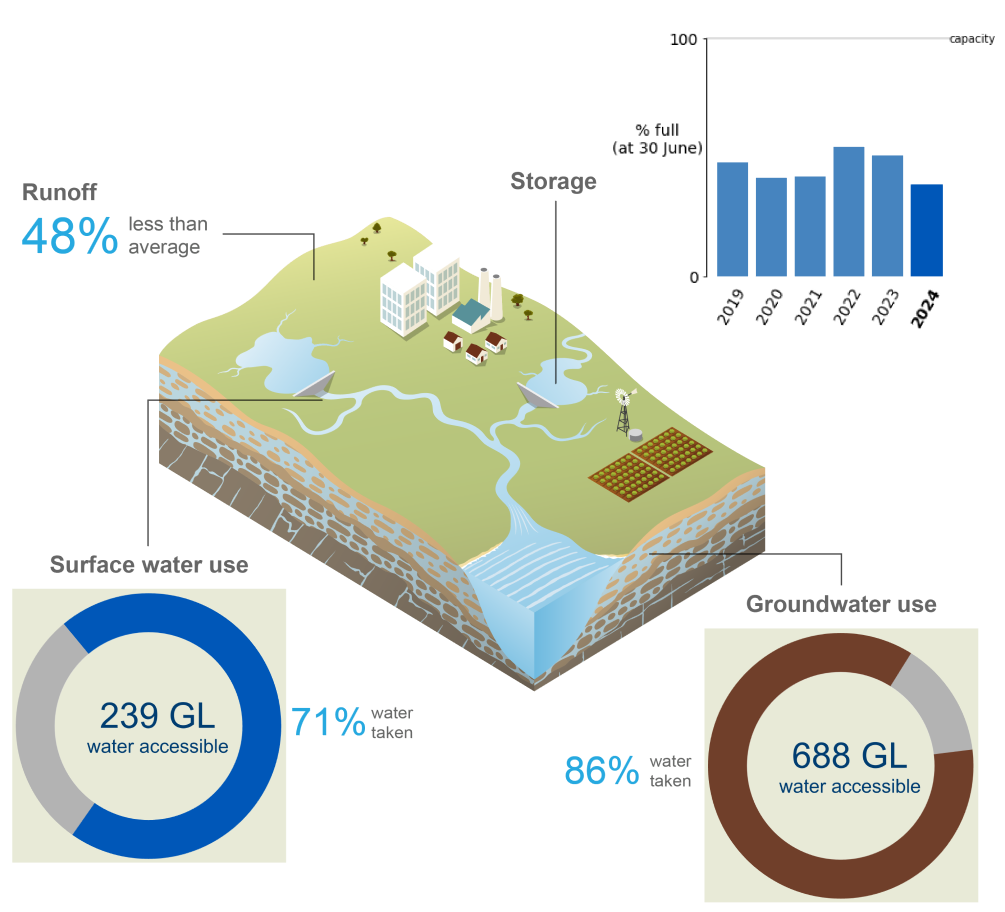
- Annual rainfall in the Perth region during 2023–24 was the lowest on record, contributing to reduced runoff and surface water inflows into the region's surface water storages.
- Total storage volume in the Perth region decreased by 12.2% during the reporting period, finishing at 38.7% full on 30 June 2024—the lowest end-of-year storage volume since 2016-17.
- Approximately 82% of the surface water and groundwater resources in the Perth region were estimated to have been taken, primarily for groundwater extractions to individual users and the urban system.
For further information on the regions water accounting statements scroll down this page or click on the links below:
Water assets
")
- The total volume of water assets in the Perth region was 359 GL on 30 June 2024, with approximately 93% of the water assets held in surface water storages.
- Around 6% of the region's water assets are entitlements under the Perth irrigation scheme, while the remaining volume of water assets were contained in rivers.
- A detailed breakdown of water assets in the Perth region is available in the Statement of Water Assets and Water Liabilities.
Surface water assets
- On 30 June 2024, surface water assets in the Perth region were 334 GL, accounting for approximately 93% of the region’s total water assets.
- More than 99% of these surface water assets were held in surface water storages, with the remaining volume part of the region’s river systems.
| 2024 | 2023 | 2022 | 2021 | 2020 | 2019 | |
| Canning | 49,432 | 50,209 | 51,579 | 48,332 | 54,325 | 52,925 |
| Churchman Brook | 660 | 739 | 714 | 1,197 | 687 | 892 |
| Drakes Brook | 1,614 | 1,782 | 2,012 | 1,892 | 1,870 | 2,013 |
| Harvey | 22,242 | 32,331 | 32,331 | 15,362 | 12,087 | 22,051 |
| Logue Brook | 10,949 | 13,400 | 14,561 | 12,349 | 13,064 | 14,717 |
| North Dandalup | 37,953 | 40,096 | 42,405 | 35,380 | 35,765 | 38,275 |
| Samon Brook | 2,535 | 4,052 | 3,937 | 3,635 | 2,938 | 2,417 |
| Serpentine | 43,972 | 66,463 | 72,841 | 64,334 | 63,172 | 62,477 |
| Serpentine Pipehead | 1,388 | 1,453 | 1,525 | 1,533 | 1,687 | 1,665 |
| South Dandalup | 10,492 | 18,958 | 15,155 | 6,991 | 9,822 | 15,411 |
| Stirling | 23,354 | 26,883 | 36,588 | 22,203 | 20,142 | 24,673 |
| Victoria | 4,162 | 3,935 | 4,830 | 5,500 | 4,263 | 2,849 |
| Waroona | 4,272 | 7,464 | 7,577 | 6,995 | 7,875 | 10,663 |
| Wellington | 61,385 | 102,466 | 121,420 | 70,636 | 66,536 | 101,143 |
| Wungong | 35,824 | 44,673 | 39,188 | 42,767 | 38,246 | 35,909 |
| Accessible total | 310,234 | 414,904 | 446,663 | 339,106 | 332,479 | 388,080 |
| Dead storage | 23,098 | 23,098 | 23,098 | 23,098 | 23,098 | 23,098 |
| Total storage | 333,332 | 438,002 | 469,761 | 362,204 | 355,577 | 411,178 |
| Total capacity | 860,840 | 860,840 | 860,840 | 860,840 | 860,840 | 860,840 |
| % full | 38.7% | 50.9% | 54.6% | 42.1% | 41.3% | 47.8% |
- The total storage volume in the Perth region decreased by 12.2% during 2023–24, finishing at 38.7% full on 30 June 2024—the lowest end-of-year storage volume since 2016-17.
- Approximately half of the Perth region's total surface water storage volume comes from three reservoirs— the Canning, Serpentine, and Wellington (which is located outside the Perth region).
- As the Mundaring Reservoir, located upstream on the Helena River, in the northern part of the region, supplies water to the Goldfields and Agricultural districts outside the Perth region, the storage is not considered a surface water asset in the account.
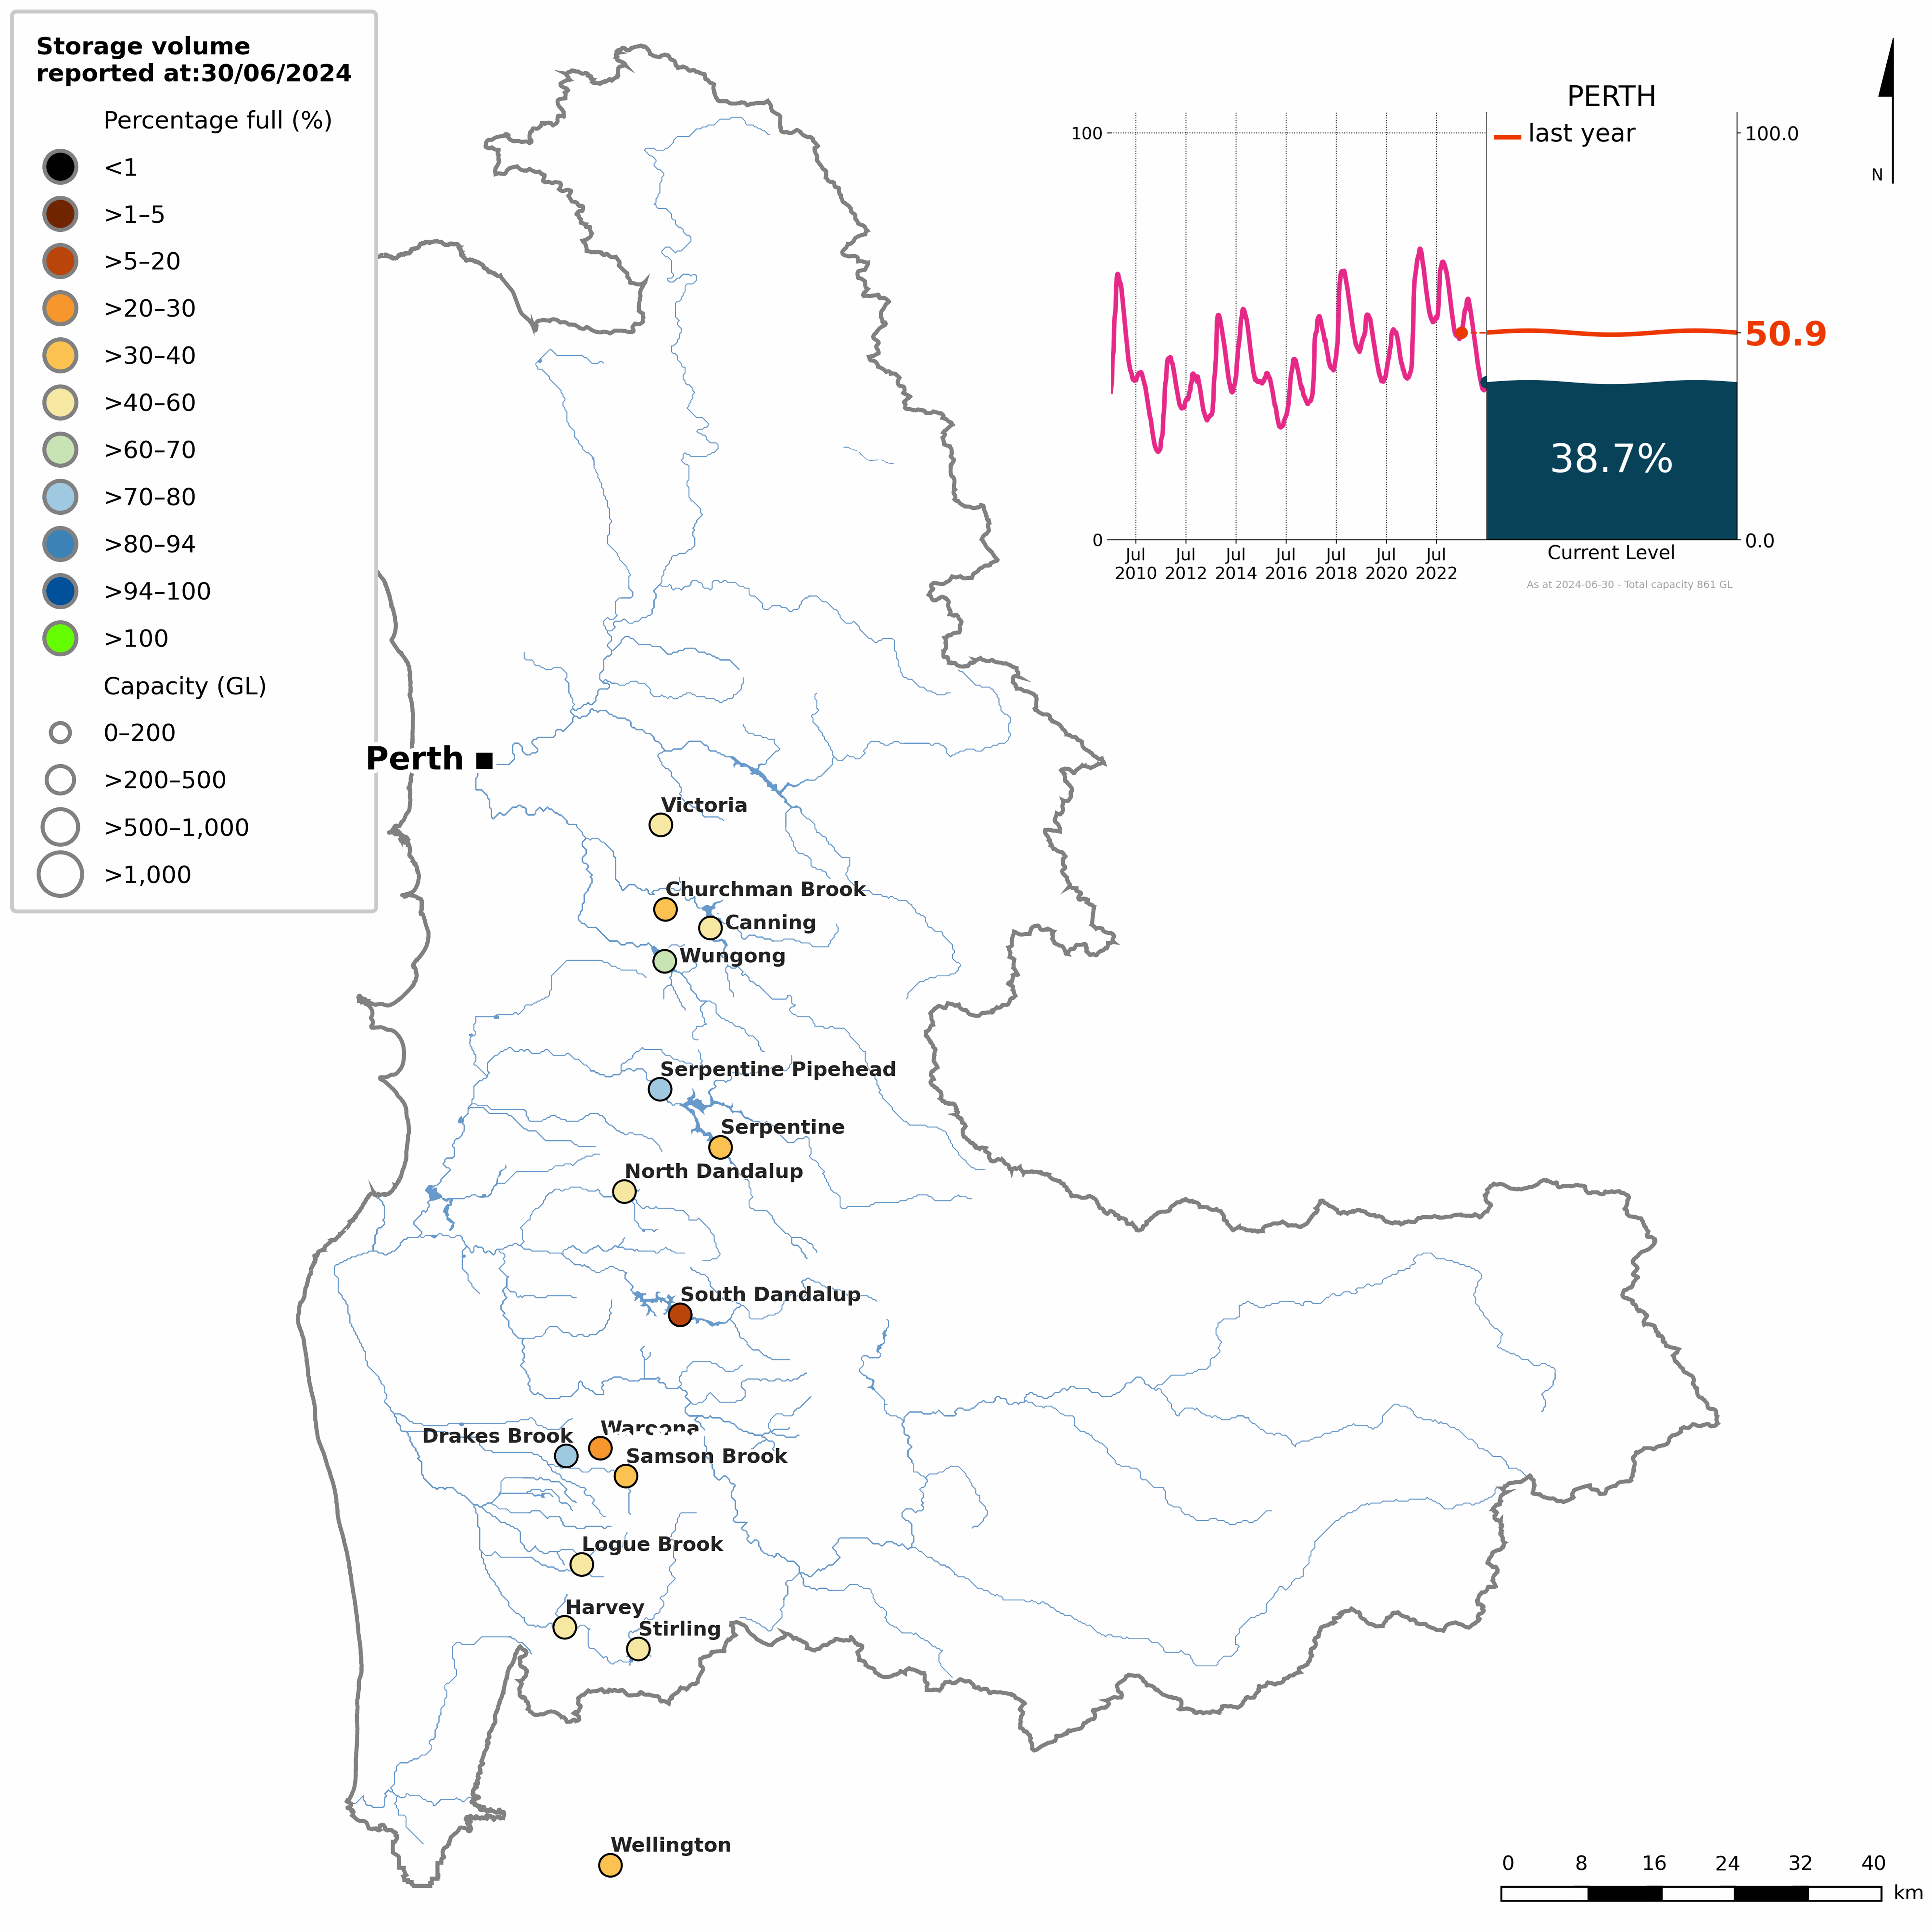
Figure S1 Percentage-full volume on 30 June 2024 for each storage and total daily storage volume from 2010–2024 (inset)
- The total storage volume in the Perth region began the 2023–24 year at 50.9% full—the fourth highest opening storage volume.
- Despite below-average rainfall across the Perth region during winter, storages rose to around 60% by late August.
- In response to the region’s driest reporting period on record—including the driest October-to-April period—storages across the Perth region declined to approximately 36% by April, reflecting the prolonged dry conditions that developed during the reporting year.
- Although rainfall was below average in the Perth region during May and June, it was enough to lift storages slightly, finishing at 38.7% full on 30 June 2024—the lowest end-of-year storage volume since 2016–17.
- More detailed information on individual storages in the Perth region is available on the Bureau of Meteorology's Water Information Dashboard.
Groundwater assets
- The volume of water stored in the Perth region’s aquifers cannot be quantified due to a lack of available data. However, the annual change in aquifer volume is reported.
| Groundwater | 2024 | 2023 | 2022 | 2021 | 2020 | 2019 |
| Change in aquifer volume | (305,806) | 241,702 | 196,871 | (70,695) | (191,841) | 50,556 |
- Aquifers in the Perth region decreased by 306 GL during 2023–24, primarily due to a decrease of total inflows compared to the previous reporting year, which were insufficient to offset total outflows from the region's aquifers.
- Total inflows into the Perth region’s aquifers during the reporting year were 1,185 GL, 28% lower than the previous year, largely driven by a decline in recharge from landscape.
- In comparison, total outflows from the Perth region's aquifers were 1,491 GL in 2023–24, 7% higher than the previous year, primarily due to higher groundwater extractions and discharge to landscape, which counterbalanced the reduction in discharge to surface water (also referred to as discharge from groundwater).
Water liabilities
")
- Water liabilities in the Perth region refer to the volume of allocation remaining on licence entitlements at the end of the reporting period (30 June).
- As many water supply licences in the Perth region do not align with the water year (ending 30 June), the remaining allocation represents the unused portion of the annual entitlement.
- A more detailed description of water allocations in the Perth region is provided in the Water use section.
| Description | 2024 | 2023 | 2022 | 2021 | 2020 | 2019 | |
| Opening balance at 01 July | 10,009 | 10,009 | 8,522 | 8,522 | 8,522 | 8,522 | |
| add | Allocation | 50,396 | 44,325 | 45,580 | 45,173 | 43,998 | 43,599 |
| less | Allocated diversion | 50,396 | 44,325 | 44,093 | 45,173 | 43,998 | 43,599 |
| less | Adjustment and forfeiture | 0 | 0 | 0 | 0 | 0 | 0 |
| Closing balance at 30 June | 10,009 | 10,009 | 10,009 | 8,522 | 8,522 | 8,522 | |
| Description | 2024 | 2023 | 2022 | 2021 | 2020 | 2019 | |
| Opening balance at 01 July | 28,373 | 29,864 | 31,798 | 31,831 | 40,634 | 38,141 | |
| add | Allocation | 99,500 | 99,500 | 98,468 | 79,366 | 102,164 | 113,333 |
| less | Allocated diversion | 67,866 | 65,991 | 66,112 | 49,701 | 73,827 | 74,809 |
| less | Adjustment and forfeiture | 35,000 | 35,000 | 34,290 | 29,698 | 37,140 | 36,031 |
| Closing balance at 30 June | 25,007 | 28,373 | 29,864 | 31,798 | 31,831 | 40,634 | |
| Description | 2024 | 2023 | 2022 | 2021 | 2020 | 2019 | |
| Opening balance at 01 July | 104,182 | 102,352 | 102,376 | 102,377 | 102,377 | 102,377 | |
| add | Allocation | 325,131 | 304,530 | 303,993 | 300,494 | 301,028 | 310,525 |
| less | Allocation extraction | 332,000 | 302,700 | 304,017 | 300,495 | 301,028 | 310,525 |
| less | Adjustment and forfeiture | 0 | 0 | 0 | 0 | 0 | 0 |
| Closing balance at 30 June | 97,313 | 104,182 | 102,352 | 102,376 | 102,377 | 102,377 | |
- Due to not receiving complete data for the 2023–24 reporting period, some of the figures presented in Tables S3 to S5 are estimates based on previous years' data and may not reflect current conditions.
- Surface water allocations in the Perth region for 2023–24 was estimated at 188 GL (60 GL allocated to individual users and 128 GL allocated to the irrigation scheme). This was similar to the previous year, and close to the average of 189 GL.
- Groundwater allocations in 2023–24 was estimated at 429 GL for the Perth region, approximately 6% higher than the previous reporting period, and slightly above the average of 419 GL.
- At the end of the 2023–24 reporting period, it was estimated that 10 GL of surface water allocations, 25 GL of allocations for the irrigation scheme, and 97 GL of groundwater allocations would be carried over into the 2024–25 water year.
Water flows
")
- Total water inflows into the Perth region during 2023–24 were 2,954 GL, approximately 29% lower than the previous reporting period, and 18% below the average of 3,621 GL.
- Surface water inflows contributed 38% (1,119 GL) of total water inflows, with runoff (656 GL) accounting for 59% of the total surface water inflows.
- Groundwater inflows contributed 41% (1,211 GL) of total water inflows, primarily from recharge from landscape (1,078 GL) making up 89% of the total groundwater inflows.
- Urban water inflows contributed 19% (556 GL) of total water inflows, in which extraction of groundwater (150 GL) and wastewater collected (148 GL) resulted in approximately 53% of the total urban water inflows.
- Irrigation scheme inflows contributed to less than 1% (68 GL) of total water inflows, entirely from allocated diversion from surface water.
- Total water outflows from the Perth region during 2023-24 were 3,119 GL, approximately 16% lower than the previous reporting period, and 7% below the average of 3,348 GL.
- Surface water outflows contributed 33% (1,018 GL) of total water outflows, mainly from outflow to sea which comprised for 64% of the total surface water outflows.
- Groundwater outflows contributed 52% (1,623 GL) of total water outflows, with approximately half of the total groundwater outflows coming from discharge to landscape and allocated extraction to individual users allocated extraction to individual users.
- Urban water outflows contributed 13% (401 GL) of total water outflows, in which supply of drinking water to residential customers composed for 52% of the total urban water outflows.
- Irrigation scheme outflows contributed to less than 1% (77 GL) of total water outflows, mostly from irrigation delivery, which constituted for 77% of the total irrigation scheme outflows.
- A detailed breakdown of inflows and outflows for the Perth region is available in the Statement of Changes in Water Assets and Water Liabilities.
Water availability
| Surface water | 2024 | 2023 | 2022 | 2021 | 2020 | 2019 |
| Water availability | 1,187,884 | 2,017,611 | 2,587,522 | 1,236,124 | 1,126,134 | 1,775,330 |
| Water accessible | 239,321 | 248,162 | 241,575 | 182,049 | 212,736 | 277,609 |
| Water taken | 169,305 | 174,780 | 167,412 | 112,031 | 135,243 | 192,422 |
| % water accessible taken | 71% | 70% | 69% | 62% | 64% | 69% |
- Surface water availability in the Perth region during 2023–24 was 41% lower than the previous reporting period, and 38% below the long-term average of 1,931 GL, reflecting the region’s driest year on record, which limited the replenishment of water resources.
- Changes in water availability across the Perth region are strongly influenced by runoff. Typically, when runoff increases or decreases, water availability responds in a similar way.
- Despite the sharp decline in water availability, surface water accessible for take was estimated to have decreased only slightly compared to the previous reporting period, and remained around 6% above the average of 226 GL.
- Likewise, the volume of water taken from surface water resources was estimated to have decreased slightly from the previous year, but remained 18% above the average of 144 GL, reflecting increased water demand during Perth's driest reporting year on record.
- Overall, an estimated 71% of the surface water accessible for take in the Perth region was taken in 2023–24, with usage spread relatively even across individual users, the irrigation scheme, and the urban supply system.
Water use
")
Consumptive use
| Surface water | 2024 | 2023 | 2022 | 2021 | 2020 | 2019 |
| Individual users | 50,396 | 44,325 | 44,093 | 45,173 | 43,998 | 43,599 |
| Irrigation scheme | 67,866 | 65,991 | 66,112 | 49,701 | 73,827 | 74,809 |
| Urban system | 51,043 | 64,464 | 57,207 | 17,157 | 17,418 | 74,014 |
| Total | 169,305 | 174,780 | 167,412 | 112,031 | 135,243 | 192,422 |
| Groundwater | 2024 | 2023 | 2022 | 2021 | 2020 | 2019 |
| Individual users | 440,507 | 388,842 | 388,797 | 384,985 | 385,059 | 393,406 |
| Urban system | 149,929 | 136,790 | 130,256 | 137,064 | 135,516 | 122,318 |
| Total | 590,436 | 525,632 | 519,053 | 522,049 | 520,575 | 515,724 |
- An estimated total of 759 GL of water was taken from surface water and groundwater resources for consumptive use in the Perth region during 2023–24, approximately 8% more than the previous year, primarily due to increased groundwater extractions by individual users.
- Surface water diversions across the Perth region in 2023–24 was 169 GL, slightly less than the previous reporting period, but 18% above the average of 144 GL.
- Approximately 40% of surface water diversions were for to the irrigation scheme (sourced mainly from storages in the Harvey and Collie River catchments), while around 30% of diversions were to the urban system (including sub-surface inflows and desalinated water ‘banked’ in surface water storages).
- The remaining 30% of surface water diversions in the Perth region were for individual users, including both allocated and non-allocated diversions.
- Groundwater extractions across the Perth region were estimated at 590 GL, an increase of 12% from the previous reporting period, and 16% above the average of 510 GL.
- Individual users, including both allocated and non-allocated extractions, accounted for 75% of total groundwater extractions, with the remainder of groundwater extractions made by the urban system.
Allocations and diversions
| Surface water | 2024 | 2023 | 2022 | 2021 | 2020 | 2019 |
| Individual users | ||||||
| Carryover | 10,009 | 10,009 | 8,522 | 8,522 | 8,522 | 8,522 |
| Allocated announcements | 50,396 | 44,325 | 45,580 | 45,173 | 43,998 | 43,599 |
| Allocated diversions | 50,396 | 44,325 | 44,093 | 45,173 | 43,998 | 43,599 |
| % used | 83% | 82% | 81% | 84% | 84% | 84% |
| Irrigation scheme | ||||||
| Carryover | 28,373 | 29,864 | 31,798 | 31,831 | 40,634 | 38,141 |
| Allocated announcements | 99,500 | 99,500 | 98,468 | 79,366 | 102,164 | 113,333 |
| Allocated diversions | 67,866 | 65,991 | 66,112 | 49,701 | 73,827 | 74,809 |
| % used | 53% | 51% | 51% | 45% | 52% | 49% |
| Total | ||||||
| Carryover | 38,382 | 39,873 | 40,320 | 40,353 | 49,156 | 46,663 |
| Allocated announcements | 149,896 | 143,825 | 144,048 | 124,539 | 146,162 | 156,932 |
| Allocated diversions | 118,262 | 110,316 | 110,205 | 94,874 | 117,825 | 118,408 |
| % used | 63% | 60% | 60% | 58% | 60% | 58% |
- Total surface water allocations in the Perth region during 2023–24 was estimated at 188 GL, comprising 60 GL for individual users and 128 GL for the irrigation scheme.
- An estimated 83% of the surface water allocations for individual users in the Perth region were taken, while 53% of allocations to the irrigation scheme were used.
- Overall, approximately 63% of the total surface water allocations in the Perth region were taken during the reporting period, 7% higher than the previous year, and 11% above the average volume taken of 107 GL.
- A portion of these surface water diversions include sub-surface water flows and desalinated water transferred to the Perth region’s surface water storages (see Urban system supply section).
| Groundwater | 2024 | 2023 | 2022 | 2021 | 2020 | 2019 |
| Individual users | ||||||
| Carryover | 104,182 | 102,352 | 102,376 | 102,377 | 102,377 | 102,377 |
| Allocated announcements | 325,131 | 304,530 | 303,993 | 300,494 | 301,028 | 310,525 |
| Allocated extractions | 332,000 | 302,700 | 304,017 | 300,495 | 301,028 | 310,525 |
| % used | 77% | 74% | 75% | 75% | 75% | 75% |
- Ttotal groundwater allocations in the Perth region during 2023–24 were estimated at 429 GL, all for private and commercial use. This was approximately 6% higher than the previous reporting period, and slightly above the average of 419 GL.
- An estimated 77% of the allocated groundwater in the Perth region was extracted, 10% more than the previous reporting period, and 13% above the average volume extracted of 294 GL.
- Groundwater extractions have remained above average in recent years, partly due to increased ‘banking’ of groundwater in surface water storages in response to low surface water inflows.
Urban supply system
| Water sources | 2024 | 2023 | 2022 | 2021 | 2020 | 2019 |
| Surface water | 51,043 | 64,464 | 57,207 | 17,157 | 17,418 | 74,014 |
| Groundwater | 149,929 | 136,790 | 130,256 | 137,064 | 135,516 | 122,318 |
| Desalinated water | 119,547 | 94,474 | 116,198 | 143,641 | 140,047 | 89,295 |
| Inter-region delivery | 2,261 | 1,980 | 1,996 | 2,006 | 1,938 | 1,906 |
| Total urban water supplied | 322,780 | 297,708 | 305,657 | 299,868 | 294,919 | 287,533 |
- A total of 323 GL of water was sourced for the urban supply system in the Perth region during 2023–24, 8% more than the previous reporting period, and 11% above the average of 290 GL.
- Approximately 46% of the total urban supply in the Perth region came from groundwater extractions, while 16% of the urban supply was sourced from surface water storages.
- Desalinated water accounted for roughly 37% of the urban supply in the Perth region, with the remaining volume supplied to the urban system via inter-region delivery.
- In response to decreased inflows to surface water storages during the reporting period, Perth Water Corporation increased the use of desalinated water to help meet demand across the region.
- During periods of low demand, the supply strategy includes the ‘banking’ of groundwater and desalinated water in Perth's surface water storages to buffer peak supply requirements.
- For more information on the use of desalinated water in the Perth region, please visit Perth Water Corporation's Desalinated website.
Water restrictions
")
- A permanent daytime sprinkler ban and 2-day a week sprinkler roster have been in place for urban water users since 2001, in addition to 3-day a week sprinkler roster for domestic garden bores since 2007.
- In 2010, a permanent winter sprinkler ban was introduced to assist in the 'banking' of water resources across the region.
- For more information on water restrictions across the Perth region, refer to the Bureau of Meteorology's Water restrictions website.