


South East Queensland: Climate and water
For the water account period 1 July 2023 to 30 June 2024
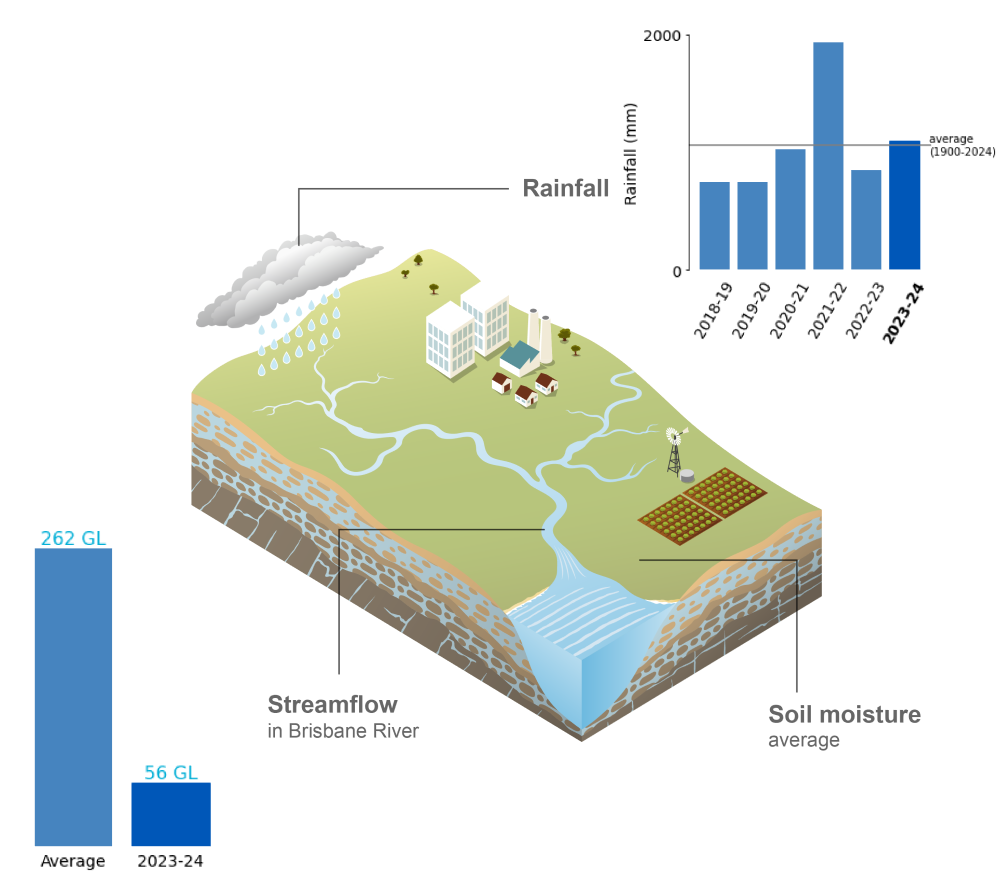
- Annual rainfall in South East Queensland during 2023–24 was slightly above average, primarily due to above-average rainfall between November and April.
- Soil moisture in the root zone (0–1 m depth) remained predominantly average across South East Queensland, reflecting the overall near-average rainfall conditions during the year.
- Total annual flows varied across South East Queensland's rivers, with the Brisbane River recording just 21% of its long-term average, while the Logan River recorded slightly above-average flows.
For further information on the region's climate and water conditions during the 2023-24 year scroll down this page or click on the links below:
About the region
- The South East Queensland region experiences a subtropical climate, characterised by hot, humid summers and mild to cool winters.
- Although rainfall can occur throughout the year, higher rainfall totals are more common across the South East Queensland region during the northern wet season between October and April.
- Streamflows across the South East Queensland region generally reflect the distribution of rainfall during the year, with higher flows and storage inflows occurring during the wet season, while some streamflows can cease to flow during the drier period from May to September.
Climate conditions
Rainfall
Figure C1 Annual and monthly rainfall deciles for the South East Queensland region during the 2023-24 year
- Total area-averaged rainfall across South East Queensland in 2023–24 was 1,098 mm, 3% above the long-term average of 1,061 mm. Since 2000, annual rainfall has exceeded the long-term average on eight occasions.
- Rainfall from July to October was 60% below the long-term average for this period, primarily due to a lack of rain-bearing systems impacting the region during what is typically South East Queensland's driest period during the year.
- In late September, both a positive Indian Ocean Dipole (IOD) and an El Niño event in the tropical Pacific Ocean were declared underway (as stated in this Climate Driver Update). While the IOD has only marginal influence on South East Queensland’s climate, concurrent positive IOD and El Niño events historically increase the likelihood of below-average rainfall, particularly during winter and spring.
- The combined effects of the positive IOD and El Niño event likely contributed to South East Queensland recording its third-driest October on record, receiving only 12% of the long-term monthly average.
- Despite the ongoing influence of the positive IOD and El Niño event peaking during summer, rainfall from November to January was 65% above the long-term average for this period, which included South East Queensland's ninth-wettest January on record, with widespread rain and thunderstorms delivering weekly totals of up to 200 mm.
- By late January, the positive IOD returned to neutral, and the El Niño event began to weaken, but despite the gradual decline of the El Niño event throughout autumn, rainfall between February and April remained close to average, contributing to South East Queensland’s eighteenth-wettest November-to-April period on record, with rainfall being 33% above the long-term average for that period.
- At the end of autumn, the El Niño–Southern Oscillation returned to neutral, but despite its waning influence on South East Queensland's climate, rainfall was 59% below the long-term May-June average.
- More information on Australia's climate and water during the 2023–24 reporting period can be found in the Financial Year Climate and Water Statement 2023–24.
Figure C2 Total monthly rainfall for the South East Queensland region during the 2023–24 year compared with the average and percentiles for the region
- January was the wettest month of 2023–24 in South East Queensland, with rainfall exceeding the 90th percentile.
- All months from November to April, except February, recorded above-average rainfall, but remained below the 90th percentile.
- October was the only month with rainfall below the 10th percentile, while July to October and May to June all experienced well below-average rainfall.
Actual evapotranspiration
Figure C3 Annual and monthly actual evapotranspiration deciles for the South East Queensland region during the 2023-24 year
- Total area-averaged actual evapotranspiration was average to below average across South East Queensland during 2023-24, with the lowest anamolies occurring in the northern areas due to reduced water availability throughout the year.
- Below-average rainfall from July to October reduced water availability across South East Queensland, resulting in predominantly below-average evapotranspiration, particularly in October, where the lowest evapotranspiration on record reached its greatest extent, following the region's third-driest October on record.
- Despite rainfall being above average in November, actual evapotranspiration remained below average across most of South East Queensland. However, following widespread rainfall in December and January, evapotranspiration became average to above average, and remained above average during Feburary in response to the region's ninth-wettest January on record.
- Evapotranspiration decreased in March due to below-average rainfall in February, but returned to predominantly above-average levels in April, particularly in western areas, after above-average rainfall improved water availability across South East Queensland in March and April.
- Toward the end of the reporting period, evapotranspiration decreased again in South East Queensland, becoming average to below average following below-average rainfall in May and June.
Soil moisture
Figure C4 Annual and monthly soil moisture deciles for the South East Queensland region during the 2023-24 year
- Soil moisture in the root zone (0–1 m depth) was predominantly average across South East Queensland during 2023–24, with pockets of above-average and below-average conditions spread throughout the region, reflecting the region’s near-average annual rainfall.
- Between July and November, soil moisture was very much below average in many areas, with October recording the greatest extent of the lowest soil moisture on record due to the continued absence of rain-bearing systems.
- Following above-average rainfall between November and January, soil moisture recovered to predominantly above-average levels by January, and remained above average through to May, coinciding with South East Queensland’s eighteenth-wettest November-to-April period on record.
- Although rainfall was below average in May and June, soil moisture conditions remained average across most of the region by the end of the reporting year.
- More information on the soil moisture conditions across the South East Queensland region during the 2023–24 reporting year is available on the Australian Water Outlook.
Streamflow responses
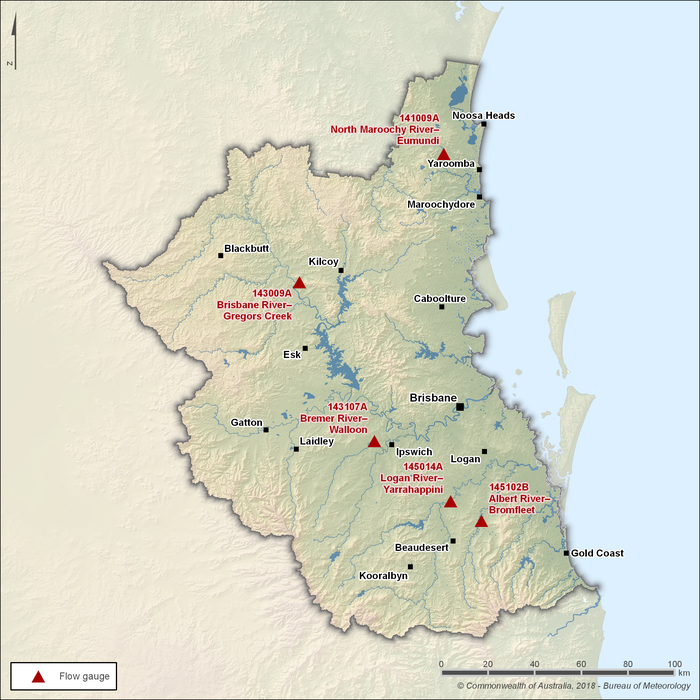
Figure C5 Key flow gauging stations along the main rivers within the South East Queensland region
- There are five main river systems within the South East Queensland region, including the Albert, Bremer, Brisbane, Logan, and Maroochy rivers. Among these, the Brisbane and Logan rivers are the primary contributors to streamflow across the region.
- The Brisbane River, regulated by Wivenhoe Dam, flows through the city of Brisbane and is highly susceptible to major flooding during extreme rainfall events, including the significant flooding events of 1974, 2011, and 2022.
- Seasonal streamflow patterns in South East Queensland are represented by five key flow gauging stations. The Albert, Brisbane, Logan, and Maroochy rivers generally exhibit perennial flows, while the Bremer River may intermittently cease to flow.
Figure C6 Total monthly flow for major rivers in the South East Queensland region during the 2023-24 year compared with the average and percentiles
- Total annual flows across South East Queensland’s major rivers varied during 2023–24. Flows in the Maroochy, Bremer, and Logan rivers were above average, while the Albert River recorded close-to-average flows. In contrast, flows in the Brisbane River were significantly below average.
- The Brisbane River at Gregors Creek (Station 143009A), upstream of Wivenhoe Dam, recorded 56 GL, 79% below the long-term average of 262 GL. By comparison, the Logan River at Yarrahappini (Station 145014A), the region’s largest river by total volume, recorded flows 11% above its long-term average of 338 GL. The Bremer River at Walloon (Station 143107A) recorded double its long-term annual average, primarily due to high flows in January and April.
- Although streamflows are typically at their lowest during winter and early spring, between July and October, a continued absence of rain-bearing systems led to exceptionally low flows across all monitored sites. The Bremer River ceased flowing in both September and October, while the Brisbane River (upstream of Wivenhoe Dam) also ceased to flow in October.
- Heavy rainfall in early January caused streamflows in the Bremer, Logan, and Albert rivers to exceed the 90th percentile. However, as most of the rainfall was concentrated in the southern half of the region, the Brisbane and Maroochy rivers did not experience similar peaks.
- In March and April, streamflows in the Bremer and Maroochy rivers again peaked above the 90th percentile. Notably, the Bremer River recorded its second-highest April flows on record.
- Following below-average rainfall in May and June, streamflows dropped to below-average levels across all sites heading into winter.