


South East Queensland: Supporting information
For the water account period 1 July 2023 to 30 June 2024
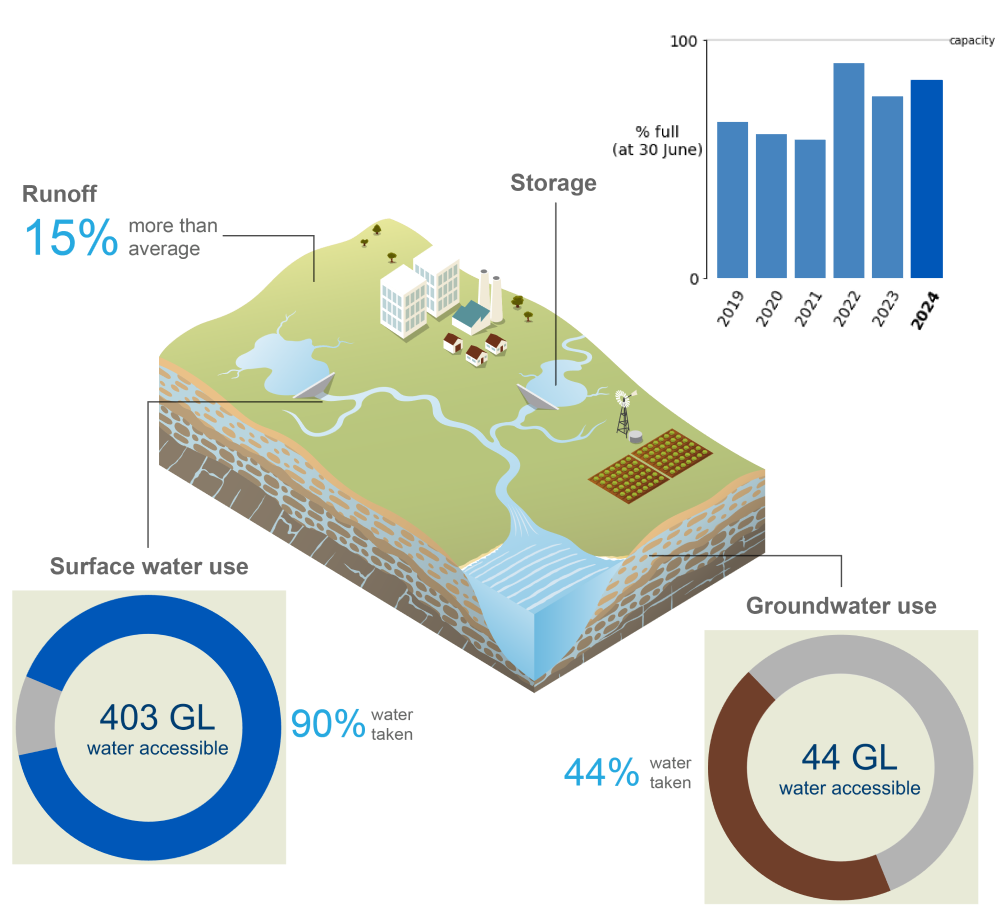
- Annual rainfall in South East Queensland during 2023–24 was slightly above average, contributing to increased runoff, although surface water inflows into the region's surface water storages was close to average.
- Total storage volume in South East Queensland increased by 7.3% during the reporting year, finishing at 83.4% full on 30 June 2024.
- Approximately 86% of total surface water and groundwater resources in the South East Queensland region were taken during 2023–24, primarily for diversions to the urban system.
For further information on the region's water accounting statements scroll down this page or click on the links below:
Water assets
")
- Total water assets in the South East Queensland region were 2,147 GL on 30 June 2024, with around 99% held in surface water storages.
- Groundwater aquifers accounted for approximately 1% of total water assets in the South East Queensland region, while the remaining volume was contained within rivers.
- A detailed breakdown of water assets in the South East Queensland region is available in the Statement of Water Assets and Water Liabilities.
| Surface water | 2024 | 2023 | 2022 | 2021 | 2020 | 2019 |
| Atkinson | 24,178 | 22,527 | 30,428 | 1,357 | 1,637 | 1,637 |
| Baroon Pocket | 59,682 | 45,847 | 60,653 | 57,718 | 55,902 | 61,536 |
| Bill Gunn | 6,796 | 5,212 | 6,939 | 320 | 200 | 199 |
| Cedar Pocket | 734 | 513 | 740 | 700 | 616 | 742 |
| Clarendon | 15,552 | 20,237 | 23,993 | 60 | 60 | 60 |
| Cooloolabin | 7,841 | 5,747 | 8,270 | 5,737 | 6,498 | 8,227 |
| Cressbrook Creek | 65,420 | 72,468 | 79,096 | 28,429 | 28,443 | 30,171 |
| Engoggera | 4,197 | 4,109 | 4,306 | 4,257 | 4,138 | 4,175 |
| Ewen Maddock | 16,278 | 12,955 | 16,281 | 15,144 | 13,454 | 17,106 |
| Gold Creek | 761 | 671 | 829 | 805 | 714 | 635 |
| Hinze | 306,562 | 276,617 | 311,810 | 304,377 | 292,946 | 289,608 |
| Lake Kurwongbah | 14,052 | 12,785 | 14,215 | 14,148 | 13,514 | 9,344 |
| Lake MacDonald | 8,075 | 6,808 | 8,088 | 8,122 | 8,042 | 8,309 |
| Lake Manchester | 26,034 | 25,530 | 25,963 | 25,908 | 25,509 | 24,916 |
| Leslie Harrison | 12,790 | 11,190 | 13,048 | 12,892 | 11,798 | 10,008 |
| Little Nerang | 6,326 | 6,088 | 6,303 | 5,382 | 5,402 | 5,554 |
| Maroon | 44,217 | 43,265 | 44,414 | 44,006 | 25,169 | 33,286 |
| Moogerah | 80,892 | 74,507 | 84,308 | 34,798 | 23,736 | 48,428 |
| North Pine | 138,484 | 115,665 | 145,412 | 141,383 | 131,323 | 148,363 |
| Perseverance | 25,673 | 25,298 | 26,944 | 7,474 | 7,474 | 7,285 |
| Poona | 518 | 475 | 487 | 554 | 658 | 544 |
| Somerset | 302,269 | 299,818 | 311,569 | 270,546 | 296,486 | 291,699 |
| Wappa | 4,712 | 4,684 | 4,714 | 4,710 | 4,699 | 4,734 |
| Wivenhoe | 937,372 | 831,680 | 1,048,125 | 484,462 | 564,817 | 647,289 |
| Accessible total | 2,109,415 | 1,924,696 | 2,276,935 | 1,473,289 | 1,523,235 | 1,653,855 |
| Dead storage | 6,464 | 6,464 | 6,464 | 6,464 | 6,464 | 6,464 |
| Total storage | 2,115,879 | 1,931,160 | 2,283,399 | 1,479,753 | 1,529,699 | 1,660,319 |
| Total capacity | 2,537,064 | 2,537,064 | 2,537,064 | 2,537,064 | 2,537,064 | 2,537,064 |
| % full | 83.4% | 76.1% | 90.0% | 58.3% | 60.3% | 65.4% |
- The total storage volume in South East Queensland increased by 7.3% during 2023–24, finishing the year at 83.4% full on 30 June 2024.
- This was the tenth highest end-of-year storage volume in South East Queensland, and contributed to the region’s eighth-highest three-year average total storage volume.
- Wivenhoe Reservoir, located on the Brisbane River, holds 46% of South East Queensland’s total surface water storage. Together with the Hinze, North Pine, and Somerset reservoirs, these four storages account for approximately 82% of the region’s storage capacity.
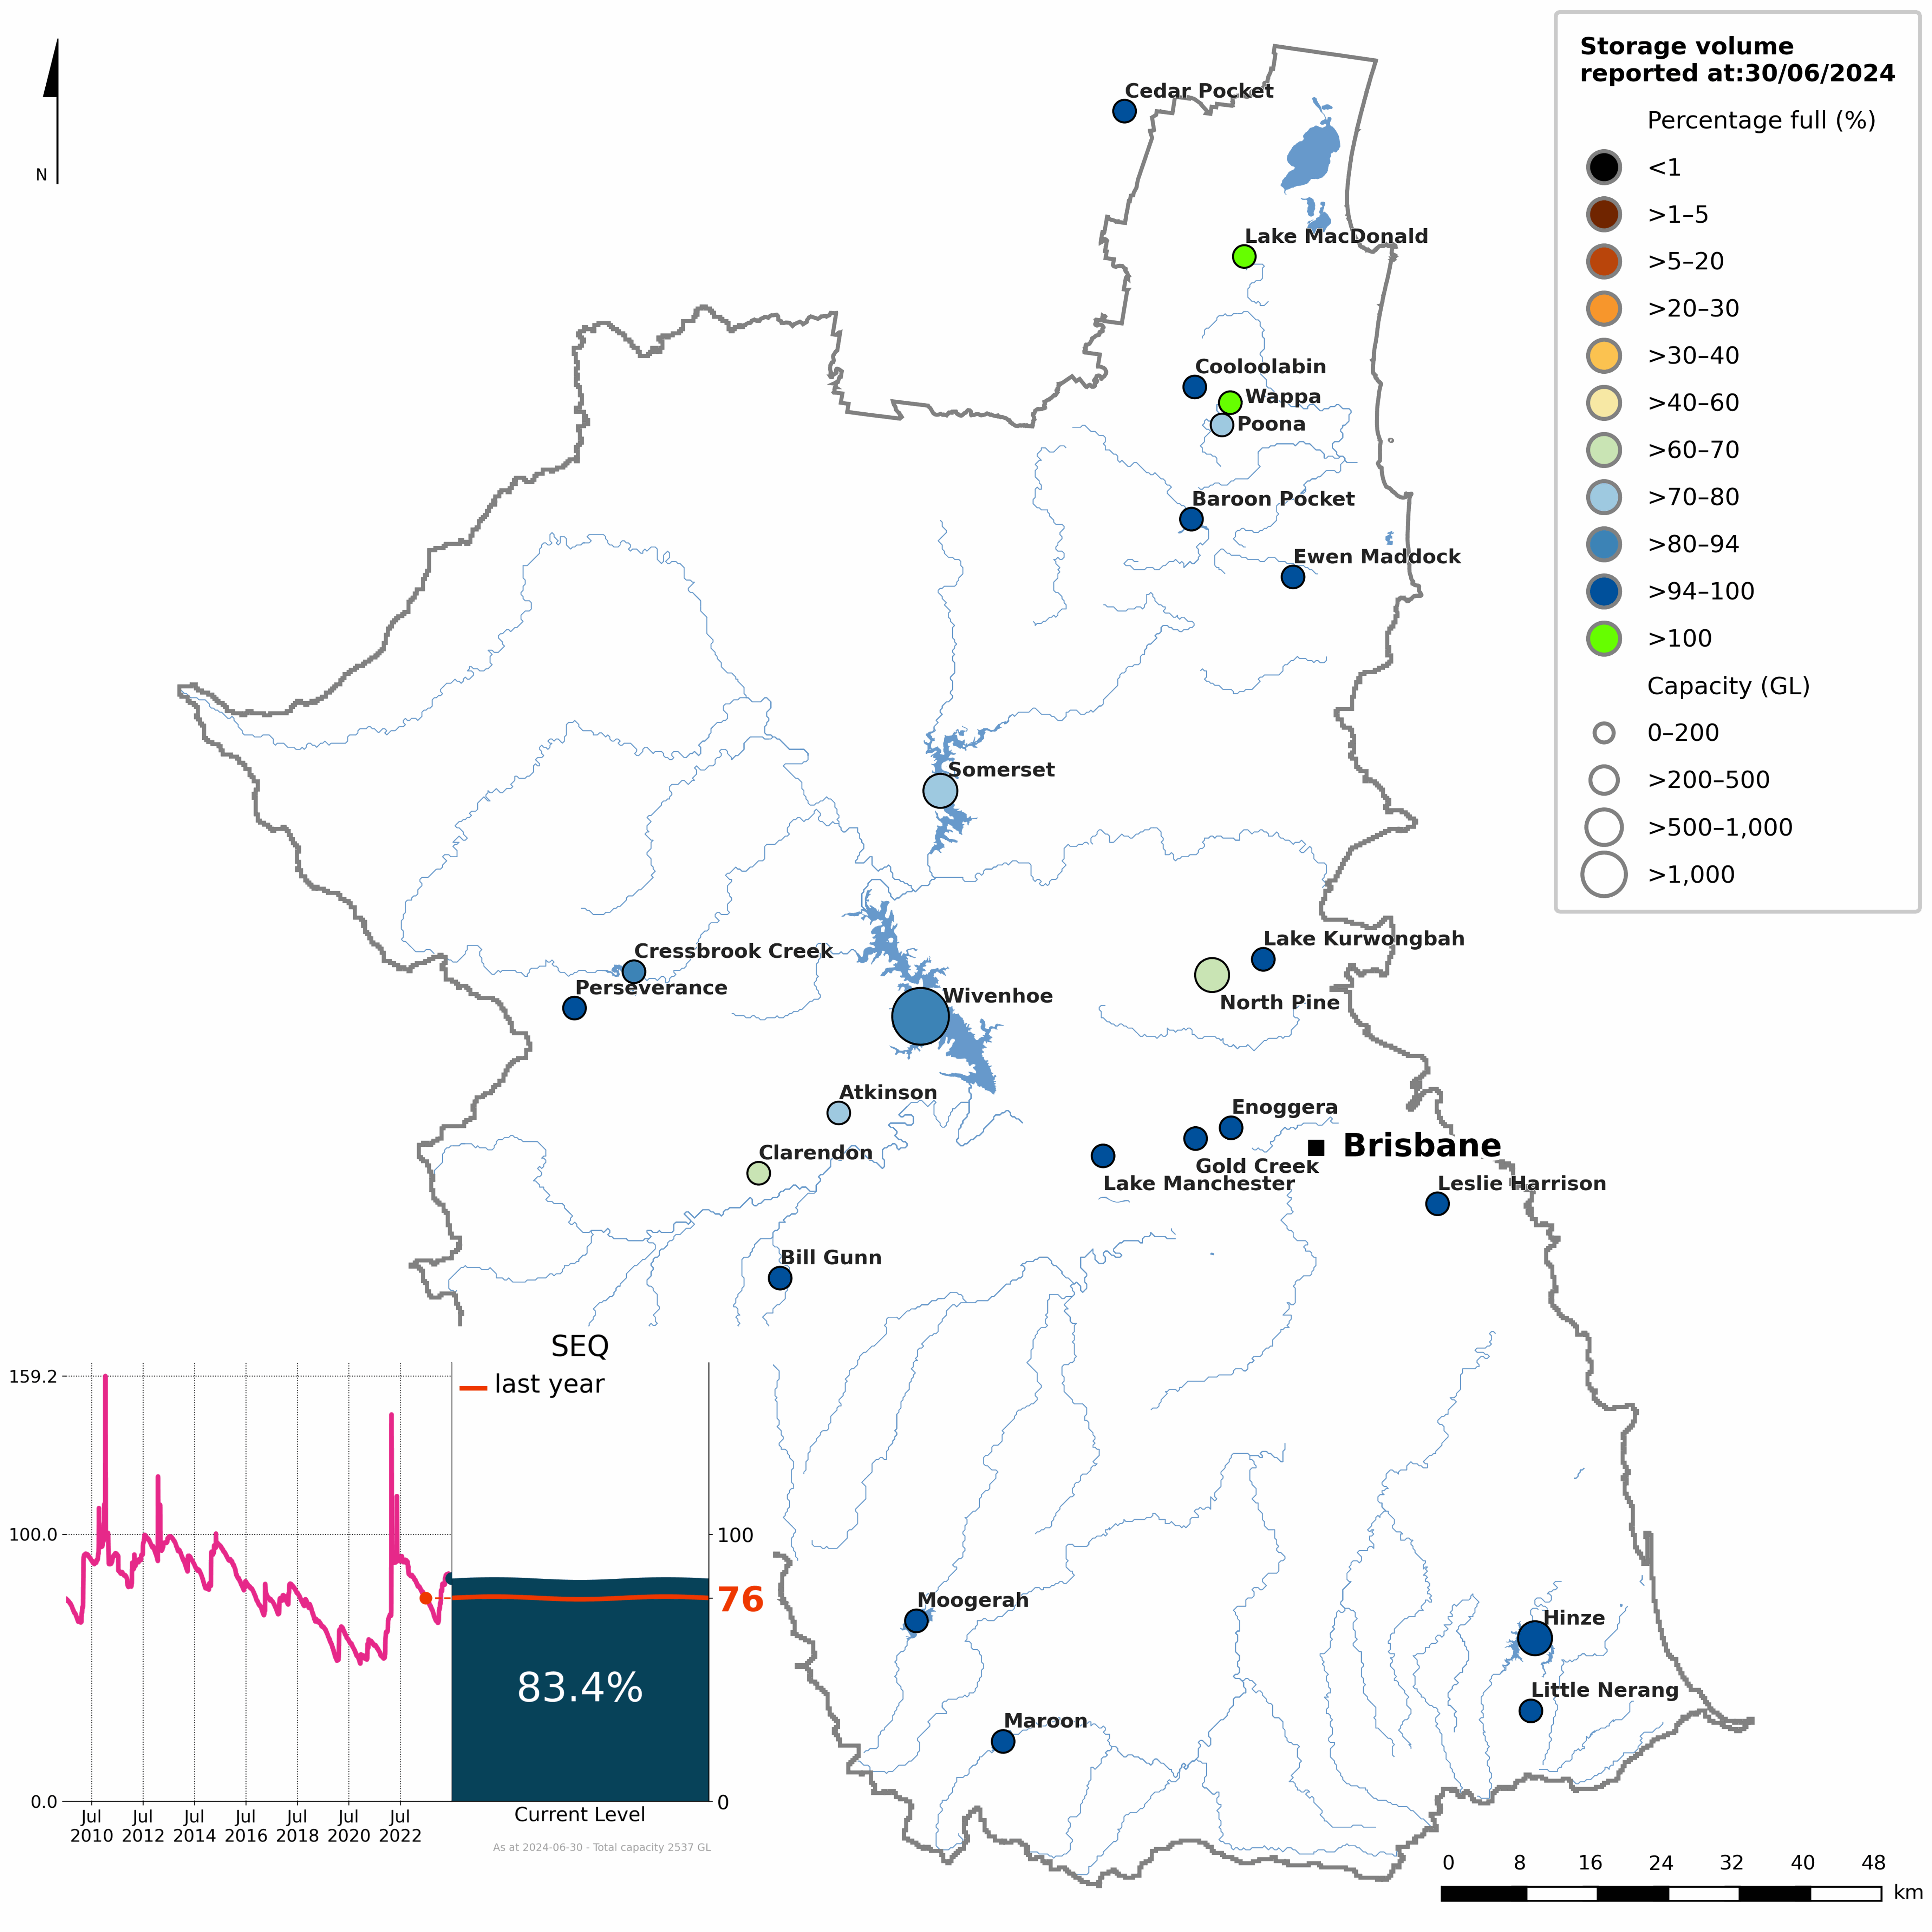
Figure S1 Percentage-full volume on 30 June 2023 for each storage and total storage volume from 2009–2024 (inset)
- The total storage volume in South East Queensland began the 2023–24 year at 76.1% full.
- In response to below-average rainfall from July to October, storages across South East Queensland declined to around 66% in October, reflecting the typical seasonal pattern of reduced inflows during winter and spring.
- After the region’s eighteenth-wettest November–to–April period on record, storages rose to 86% in April 2024, before gradually declining due to below-average rainfall in May and June.
- By 30 June 2024, the total storage volume across South East Queensland was 83.4% full—up7.3% from this time last year.
- More detailed information on individual storages in South East Queensland is available on the Bureau of Meteorology's Water Information Dashboard.
Water liabilities
")
- Water liabilities in the South East Queensland region refer to the volume of allocation remaining on licence entitlements at the end of the reporting period (30 June).
- As there are no carryover provisions for water supply licences in the South East Queensland region, any unused portion of allocation is forfeited at the end of the reporting year. Consequently, the closing balance for both surface water and groundwater licences is 0 ML.
- A more detailed description of water allocations in the South East Queensland region is provided in the Water use section.
| Description | 2024 | 2023 | 2022 | 2021 | 2020 | 2019 | |
| Opening balance at 01 July | 0 | 0 | 0 | 0 | 0 | 0 | |
| add | Allocation | 58,975 | 145,933 | 90,573 | 90,573 | 90,913 | 62,549 |
| less | Allocated diversion | 20,016 | 21,835 | 12,782 | 25,431 | 48,273 | 30,103 |
| less | Adjustment and forfeiture | 38,959 | 124,098 | 77,791 | 65,142 | 42,640 | 32,446 |
| Closing balance at 30 June | 0 | 0 | 0 | 0 | 0 | 0 | |
| Description | 2024 | 2023 | 2022 | 2021 | 2020 | 2019 | |
| Opening balance at 01 July | 0 | 0 | 0 | 0 | 0 | 0 | |
| add | Allocation | 30,170 | 28,395 | 28,395 | 28,395 | 28,395 | 11,115 |
| less | Allocated extraction | 5,596 | 5,648 | 3,631 | 7,510 | 11,222 | 10,905 |
| less | Adjustment and forfeiture | 24,574 | 22,747 | 24,764 | 20,885 | 17,173 | 210 |
| Closing balance at 30 June | 0 | 0 | 0 | 0 | 0 | 0 | |
- Surface water allocations in South East Queensland during 2023–24 were 59 GL, less than half the volume allocated in the previous reporting year, while groundwater allocations remained steady at 30 GL, slightly above the past few years.
- At the end of the reporting year, approximately 66% (39 GL) of surface water allocations and 81% (25 GL) of groundwater allocations in South East Queensland were forfeited, with no volume carried over into the 2024–25 water year.
Water flows
")
- Total water inflows into the South East Queensland region during 2023-24 were 6,170 GL, approximately 120% more than the previous reporting period.
- Surface water inflows contributed 81% (5,018 GL) of total water inflows, with runoff accounting for 91% of the total surface water inflows.
- Groundwater inflows contributed 8% (493 GL) of total water inflows, primarily from recharge from surface water making up 95% of the total groundwater inflows.
- Urban water inflows contributed 11% (659 GL) of total water inflows, in which diversion of surface water and wastewater collected resulted in 98% of the total urban water inflows.
- Total water outflows from the South East Queensland region during 2023-24 were 5,531 GL, approximately 52% more than the previous reporting period.
- Surface water outflows contributed 89% (4,901 GL) of total water outflows, mainly from outflow which comprised for 64% of the total surface water outflows.
- Groundwater outflows contributed less than 1% (19 GL) of total water outflows, all from extractions to individual users (comprising allocated and non-allocated extractions) and extractions to the urban system.
- Urban water outflows contributed 11% (610 GL) of total water outflows, largely from discharge to sea and supply of drinking water to residential customers, constituting for 72% of the total urban water outflows.
- A detailed breakdown of inflows and outflows for the South East Queensland region is available in the Statement of Changes in Water Assets and Water Liabilities.
Water availability
| Surface water | 2024 | 2023 | 2022 | 2021 | 2020 | 2019 |
| Water availability | 6,751,791 | 3,919,721 | 17,021,459 | 5,448,191 | 4,899,604 | 3,194,723 |
| Water accessible | 402,924 | 474,589 | 390,715 | 406,667 | 447,789 | 373,567 |
| Water taken | 363,965 | 350,491 | 312,924 | 341,525 | 405,149 | 341,121 |
| % water accessible taken | 90% | 74% | 80% | 84% | 90% | 91% |
- Surface water availability in the South East Queensland region during 2023–24 was 6,752 GL, 25% above the long-term average of 5,414 GL, and 72% higher than the previous reporting year.
- Changes in water availability across the South East Queensland are heavily influenced by runoff. Generally, when runoff increases or decreases, water availability responds in a similar way.
- Despite the increase in water availability, surface water accessible for take in South East Queensland was 403 GL in 2023–24, 15% lower than the previous year, but still 9% above the long-term average of 369 GL.
- In contrast, water taken from surface water resources in South East Queensland increased slightly to 364 GL, up from 350 GL in 2022–23, and 17% above the long-term average of 312 GL, primarily due to increased diversions to the urban system.
- The decrease in accessible surface water may reflect the broader downward trend in availability since 2021–22, while the increase in water taken suggests a growing demand to meet the expanding urban and system requirements.
- Overall, approximately 90% of the accessible surface water for take in South East Queensland was taken during 2023–24, primarily for diversions to the urban system.
Water use
")
Consumptive use
| Surface water | 2024 | 2023 | 2022 | 2021 | 2020 | 2019 |
| Individual users | 21,258 | 23,389 | 14,342 | 26,726 | 49,555 | 31,415 |
| Inter-region | 3,992 | 3,930 | 3,992 | 3,992 | 3,806 | 3,810 |
| Urban system | 338,715 | 323,172 | 294,590 | 310,807 | 351,788 | 305,896 |
| Total | 363,965 | 340,826 | 312,924 | 341,525 | 405,149 | 341,121 |
| Groundwater | 2024 | 2023 | 2022 | 2021 | 2020 | 2019 |
| Individual users | 13,456 | 10,024 | 5,176 | 11,966 | 18,350 | 17,106 |
| Urban system | 5,777 | 6,155 | 3,632 | 7,180 | 7,881 | 6,688 |
| Total | 19,233 | 16,179 | 8,808 | 19,146 | 26,231 | 23,794 |
- A total of 383 GL of water was taken from surface water and groundwater resources for consumptive use in the South East Queensland region during 2023–24, approximately 5% more than the previous year, primarily due to increased surface water diversions to the urban system.
- Surface water diversions across South East Queensland were 364 GL, representing a 4% increase from 2022–23, and 17% above the average of 312 GL.
- Of the surface water diverted in South East Queensland, 93% was supplied to the urban system, entirely to Seqwater—Queensland’s bulk water supply authority. Individual users (including both allocated and non-allocated diversions) accounted for 6% of diversions, while the remaining volume was diverted by inter-region users with statutory rights.
- Groundwater extractions across South East Queensland were 19 GL, up 19% from the previous year. Around 70% of this volume was extracted by individual users (including both allocated and non-allocated extractions), with the remainder used for the urban system.
Allocations and diversions
| Surface water | 2024 | 2023 | 2022 | 2021 | 2020 | 2019 |
| Individual users | ||||||
| Carryover | 0 | 0 | 0 | 0 | 0 | 0 |
| Allocated announcements | 58,975 | 145,933 | 90,573 | 90,573 | 90,913 | 62,549 |
| Allocated diversions | 20,016 | 21,835 | 12,782 | 25,431 | 48,273 | 30,103 |
| % used | 34% | 15% | 14% | 28% | 53% | 48% |
- Total surface water allocations in the South East Queensland region during 2023–24 were 59 GL, all allocated to individual users. This was less than half the volume allocated in the previous reporting year.
- Approximately 34% of the allocated surface water was taken in 2023–24, slightly higher than the previous year, and around 9% below the average of 22 GL.
| Groundwater | 2024 | 2023 | 2022 | 2021 | 2020 | 2019 |
| Individual users | ||||||
| Carryover | 0 | 0 | 0 | 0 | 0 | 0 |
| Allocated announcements | 30,170 | 28,395 | 28,395 | 28,395 | 28,395 | 11,115 |
| Allocated extractions | 5,596 | 5,648 | 3,631 | 7,510 | 11,222 | 10,905 |
| % used | 19% | 20% | 13% | 26% | 40% | 98% |
- Total groundwater allocations in the South East Queensland region during 2023–24 were 30 GL, all allocated for private and commercial use. This was 6% higher than the previous reporting year.
- Approximately 19% of the allocated groundwater was extracted, slightly lower than the previous year, and around 9% above the average of 5 GL.
Urban supply system
| Water sources | 2024 | 2023 | 2022 | 2021 | 2020 | 2019 |
| Surface water | 338,715 | 323,172 | 294,590 | 310,807 | 351,788 | 305,896 |
| Groundwater | 5,777 | 6,155 | 3,632 | 7,180 | 7,881 | 6,688 |
| Desalinated water | 9,627 | 7,240 | 12,714 | 19,486 | 13,805 | 6,483 |
| Inter-region inflow | 0 | 0 | 0 | 7 | 14 | 14 |
| Total urban water supplied | 354,119 | 336,568 | 310,836 | 337,480 | 373,488 | 319,036 |
- A total of 354 GL of water was sourced for the urban supply system in South East Queensland during 2023–24, approximately 5% more than the previous year, and 17% above the average of 301 GL.
- Around 96% of the total urban supply was sourced from surface water storages, 5% more than 2022–23, and 20% above the average of 283 GL.
- Groundwater accounted for just under 2% of the urban supply in South East Queensland, while the remaining volume was sourced from desalinated water. No inter-region inflows were recorded during the reporting year.
- The contribution of desalinated water increased by 33% compared to 2022–23, and was 42% above its average contribution of 6.8 GL since 2011.
- For more information on the use of desalinated water in the South East Queensland region, visit Seqwater's Water Treatment website.