South East Queensland: Climate and water
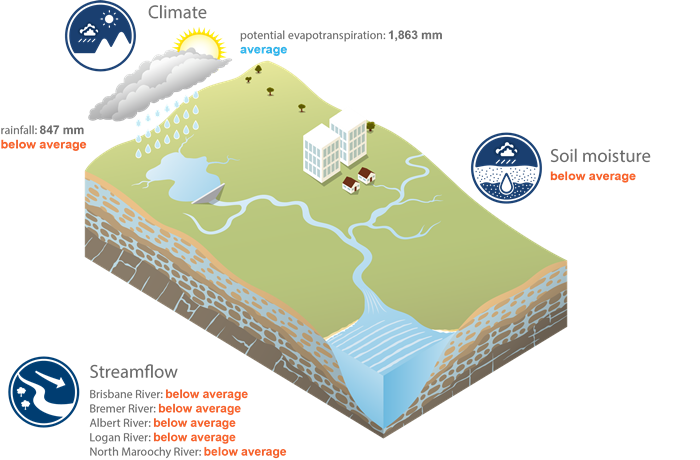
Annual rainfall in the region was below average. The combination of relatively poor rainfall and soil moisture conditions, particularly during December–May, contributed to well below-average streamflows in the river systems. These dry conditions meant that heavy rainfall associated with an east coast low event in June had little impact on streamflows and storage inflows across the region.
Introduction
The South East Queensland region has a subtropical climate. Rainfall occurs throughout the year with most rainfall falling during the summer and autumn months. Higher streamflows typically occur during these months.
See Water resources in 'Region description' for more information.
Climate conditions
Rainfall
Throughout most of the 12-month period, rainfall was very much below average across much of eastern Australia. For most of this period, up until late March 2016, Australia's climate was largely influenced by one of the strongest El Niño events since 1950. El Niño is usually associated with below average rainfall for eastern Australia. Following the breakdown of the El Niño, a strong negative phase of the Indian Ocean Dipole developed, contributing to a very wet month for June 2016.
The total area-averaged rainfall over the South East Queensland region during the 2015–16 year was 847 mm, which is below the long-term area-averaged rainfall of 1,063 mm (based on the 1900–2016 period). Annual rainfall ranged from more than 1,200 mm along the north and south coastal areas to less than 600 mm in the central part of the region (Figure C1).

Figure C1 Total annual rainfall for the South East Queensland region during the 2015–16 year
Rainfall across most of the region was generally below average for the 2015–16 year; rainfall over areas in the south and west of the region was average (Figure C2).
Figure C2 Annual and monthly rainfall deciles for the South East Queensland region during the 2015–16 year
For most of the 2015–16 year, the South East Queensland region experienced below-average rainfall, including a 6-month period from December 2015–May 2016 (figures C2–C3).
The well above-average rainfall in June 2016 is largely attributed to an east coast low event that occurred over 4–5 June 2016. The higher rainfall totals during this event occurred in the southeastern part of the region. At some locations in this part, more than 280 mm of rainfall was observed in a 24-hour period, equivalent to a greater than 1-in-10-year rainfall event.
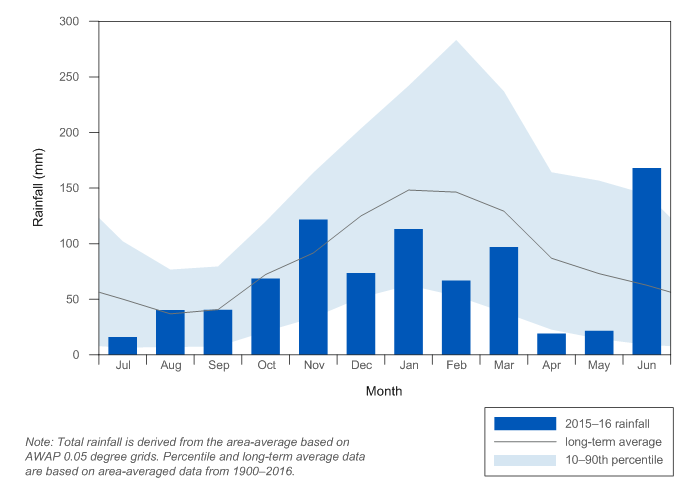
Figure C3 Total monthly rainfall for the South East Queensland region during the 2015–16 year compared with the long-term average and percentiles for the region
Evapotranspiration
The total area-averaged potential evapotranspiration over the South East Queensland region during the 2015–16 year was 1,863 mm, which is similar to the long-term area-averaged potential evapotranspiration of 1,858 mm (based on the 1911–2016 period). Potential evapotranspiration was relatively uniform across the region but marginally lower along the coast and southern parts (Figure C4).
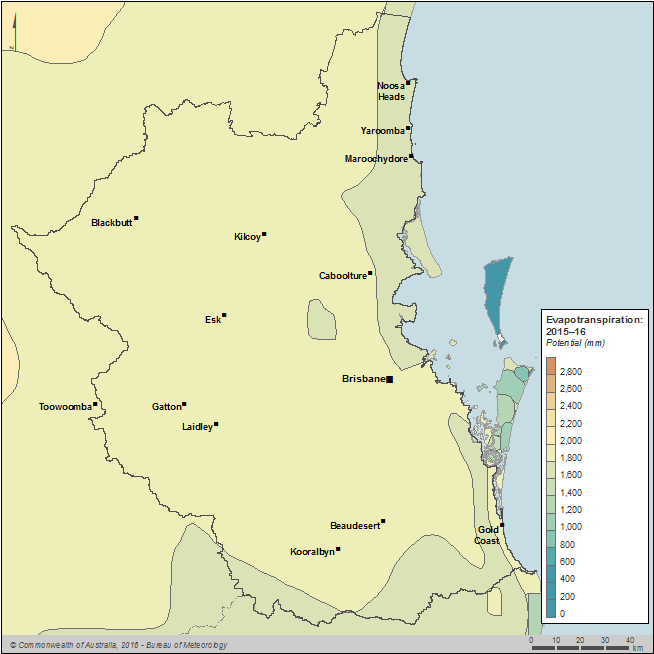
Figure C4 Total annual evapotranspiration for the South East Queensland region during the 2015–16 year
Potential evapotranspiration was generally average across most of the region during the 2015–16 year (Figure C5).
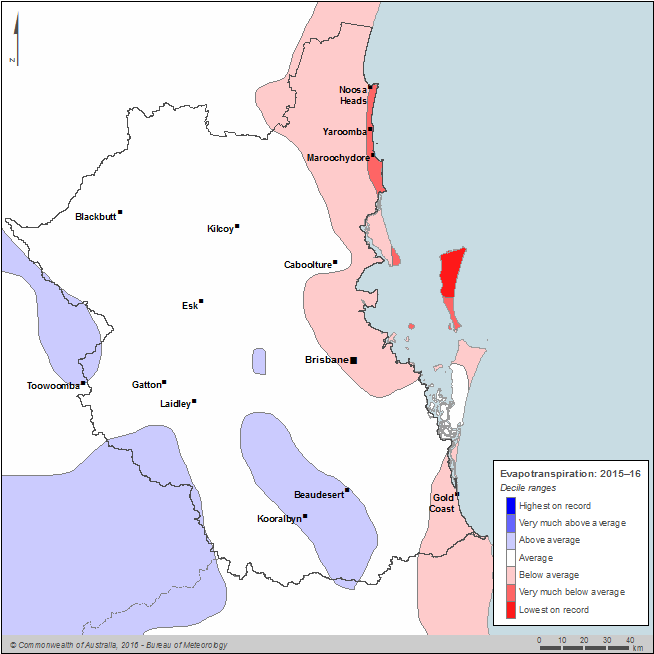
Figure C5 Annual potential evapotranspiration deciles for the South East Queensland region during the 2015–16 year
Soil moisture
Soil moisture in the root zone (0–1 m depth) for the 2015–16 year was below average across most of the South East Queensland region, compared with the 1911–2016 period (Figure C6).
Figure C6 Annual and monthly soil moisture deciles in the root zone (0–1 m depth) for the South East Queensland region during the 2015–16 year
Rainfall and soil moisture deciles are typically closely aligned. For example, above-average soil moisture during November 2015 (Figure C6) reflects the above-average rainfall that occurred across the region during this period (Figure C2). An exception occurred in June 2016 when soil moisture was close to average despite well above-average rainfall observed during that month (Figure C3). This indicates soil water stores were still low following the relatively poor rainfall that occurred during the preceding six months (December–May).
More information on soil moisture distribution across the South East Queensland region is available in the Australian Landscape Water Balance.
Streamflow responses
Streamflow
There are five main river systems within the South East Queensland region:
- Albert
- Bremer
- Brisbane
- Logan
- Mary.
The location of key gauging stations at Albert River at Bromfleet (Station 145102B), Bremer River at Walloon (Station 143107A), Brisbane River at Gregors Creek (Station 143009A), Logan River at Yarrahappini (Station 145014A) and North Maroochy River at Eumundi (Station 141009A) on these river systems is provided in Figure R6 in 'Geographical information'.
In all five rivers, total annual streamflows were well below average. Monthly flows were well below average for almost the entire 2015–16 year, particularly during the summer–autumn period (December–May) when most of the total annual flow usually occurs in these rivers (figures C7–C11). The combination of relatively poor rainfall and soil moisture conditions experienced during these months resulted in the well below-average streamflows during this 6-month period.
Interestingly, total flows during June 2016 (figures C7–C11) were less than expected given the total rainfall during this month was well above average (Figure C3). Most of the rainfall during this month was associated with an east coast low event (see Rainfall). The event primarily affected the southeastern part of the region while much less rainfall was observed over the upper reaches of the region's primary rivers. In addition, soil moisture conditions in the upper catchment areas of these rivers were relatively low following the very dry summer–autumn period (Figure C6).
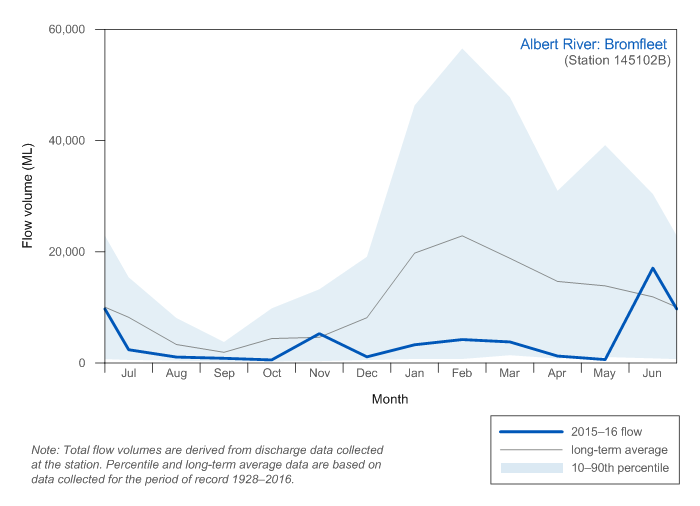
Figure C7 Total monthly flow for Albert River at Bromfleet during the 2015–16 year compared with long-term average and percentiles for the river
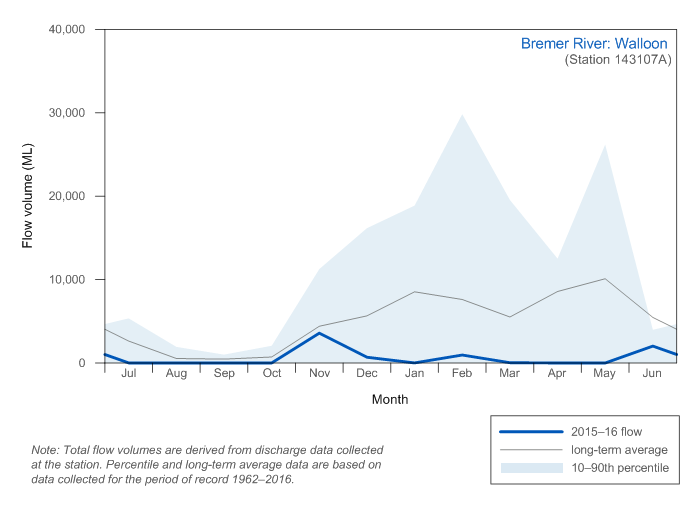
Figure C8 Total monthly flow for Bremer River at Walloon during the 2015–16 year compared with long-term average and percentiles for the river

Figure C9 Total monthly flow for Brisbane River at Gregors Creek during the 2015–16 year compared with long-term average and percentiles for the river
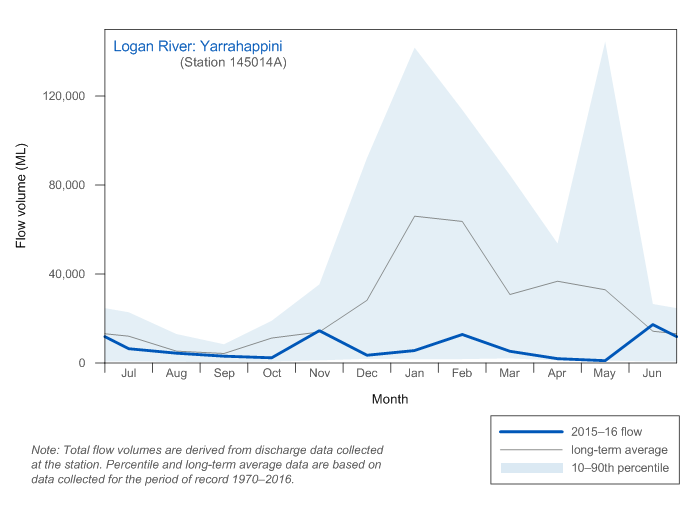
Figure C10 Total annual monthly flow for Logan River at Yarrahappini during the 2015–16 year compared with long-term average and percentiles for the river
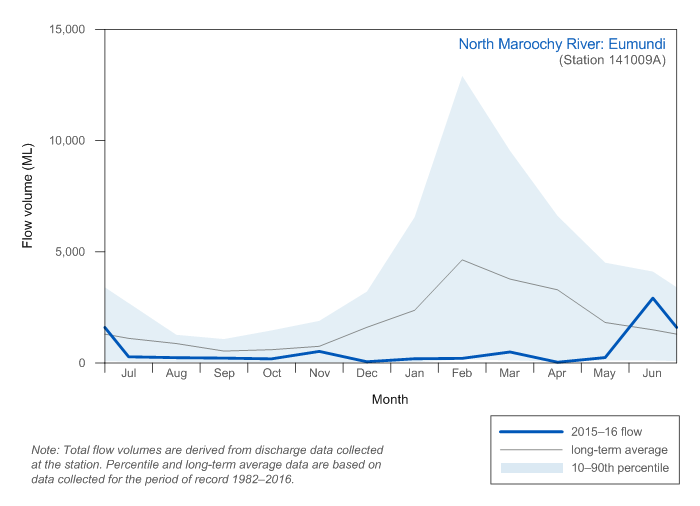
Figure C11 Total annual monthly flow for North Maroochy River at Eumundi during the 2015–16 year compared with long-term average and percentiles for the river
Major water reforms
Amendments have been proposed to the Moreton Water Resource Plan and the Moreton Resource Operations Plan relating to water allocation and management in the Central Lockyer Valley Water Supply Scheme. These changes, which will be implemented in 2017, seek to:
- convert supplemented surface water and groundwater authorisations to volumetric water allocations
- improve infrastructure operation and water-sharing rules to ensure a more equitable share of the water resource across all water users in the scheme
- establish water-trading arrangements for both surface water and groundwater users in the scheme.
The proposed amendments to establish volumetric water allocations will support recommendations of the Queensland Competition Authority's Seqwater Irrigation Price Review. Converting water entitlements to tradeable water allocations will create a more secure and flexible water management framework to support sustainable agricultural development in the Central Lockyer Valley.
Seqwater completed upgrades to the Landers Shute and Mudgeeraba water treatment plants during the 2015–16 year. Planning for upgrades to Lake Macdonald, Ewen Maddock, Wappa, Leslie Harrison, Lake Kurwongbah and Somerset dams also commenced.


