


Adelaide: Statement of Changes in Water Assets and Water Liabilities
For the water account period 1 July 2023 to 30 June 2024
- The volume of water in Adelaide's storages decreased by 49 GL during 2023–24.
- This decrease represents the change in water volume in the region's surface water storages.
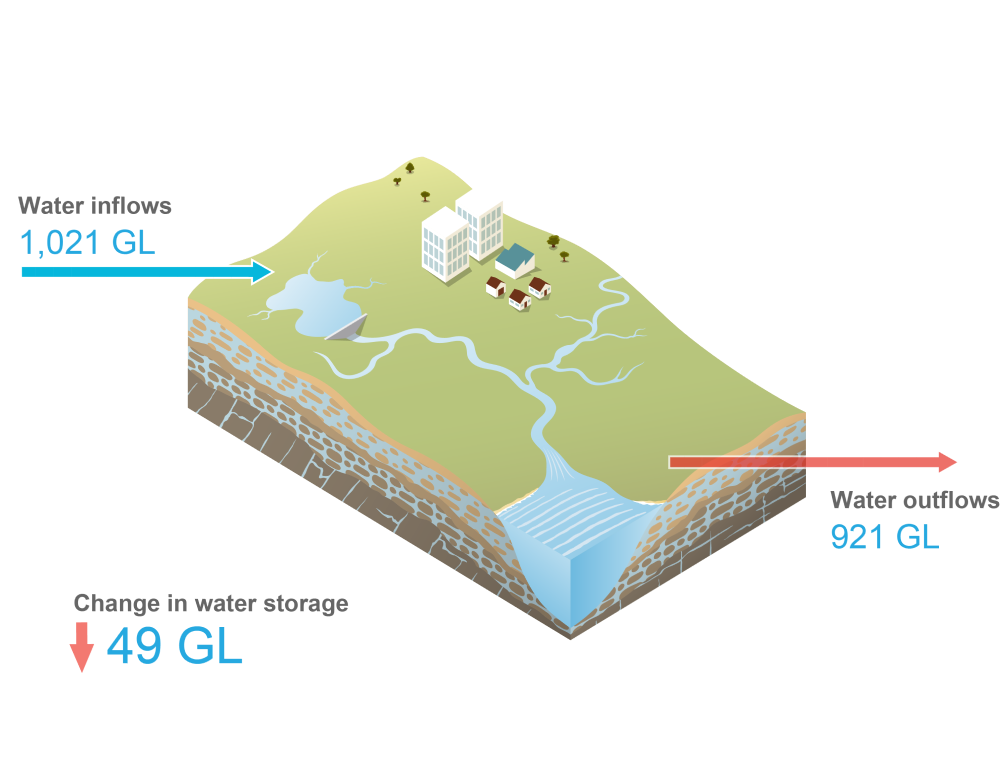
The Statement of Changes in Water Assets and Water Liabilities is provided in the table below.
The statement presents the actual water flows associated with the region's water stores, as well as the changes in water assets and water liabilities that occurred during the year.
Select comparative year
| 2024 (ML) | 2023 (ML) | 2022 (ML) | 2021 (ML) | 2020 (ML) | 2019 (ML) | ||
|---|---|---|---|---|---|---|---|
| Water inflows | |||||||
| Surface water inflows | 338,205 | 536,679 | 462,667 | 359,398 | 367,650 | 378,462 | |
| Precipitation on storages | 6,683 | 12,493 | 9,520 | 7,805 | 7,212 | 7,215 | |
| Precipitation on rivers | 3,126 | 7,610 | 5,329 | 2,484 | 2,291 | 2,040 | |
| Flood return | 8,178 | 11,375 | 42,202 | 16,615 | 21,877 | 26,257 | |
| Runoff | 111,297 | 296,280 | 197,303 | 123,711 | 145,085 | 109,907 | |
| Discharge of groundwater* | 73,921 | 73,921 | 73,921 | 73,921 | 73,921 | 73,921 | |
| Urban water return* | - | - | 258 | 3,456 | 3,880 | 1,150 | |
| Delivery of inter-region agreement to surface water | 135,000 | 135,000 | 134,134 | 131,406 | 113,384 | 157,612 | |
| Groundwater inflows | 353,032 | 454,377 | 355,558 | 336,785 | 285,665 | 244,763 | |
| Recharge from landscape | 278,183 | 342,435 | 260,807 | 269,519 | 222,816 | 196,767 | |
| Recharge from surface water* | 57,022 | 94,996 | 70,306 | 52,077 | 47,031 | 42,384 | |
| Inflow from outside region | 706 | 617 | 44 | 68 | 66 | 228 | |
| Inflow from the sea | 1,067 | 1,031 | 900 | 987 | 1,397 | 1,485 | |
| Leakage from urban water system* | 13,051 | 12,689 | 20,548 | 10,839 | 10,908 | 2,162 | |
| Managed aquifer recharge by urban system* | 503 | 109 | 492 | 527 | 318 | 250 | |
| Managed aquifer recharge by individual users | 2,500 | 2,500 | 2,461 | 2,768 | 3,129 | 1,487 | |
| Urban water system inflows | 297,684 | 270,658 | 277,172 | 285,794 | 283,964 | 284,793 | |
| Delivery of desalinated water | 4,827 | 4,804 | 5,323 | 5,139 | 40,001 | 4,901 | |
| Diversion of surface water* | 171,334 | 155,506 | 161,965 | 163,007 | 127,928 | 167,500 | |
| Wastewater collected | 121,523 | 110,348 | 109,884 | 117,648 | 116,035 | 112,392 | |
| Irrigation scheme inflows | 32,348 | 29,845 | 32,497 | 30,261 | 31,841 | 37,262 | |
| Delivery of inter-region agreement to irrigation scheme | 11,000 | 11,000 | 10,949 | 11,032 | 10,765 | 11,051 | |
| Non-allocated extraction of groundwater* | 230 | 230 | 229 | 207 | 279 | 200 | |
| Recycled water received from other water system | 700 | 700 | 718 | 718 | 414 | 622 | |
| Recycled water received from urban water system* | 20,418 | 17,915 | 20,601 | 18,304 | 20,383 | 25,389 | |
| Total water inflows | 1,021,269 | 1,291,559 | 1,127,894 | 1,012,238 | 969,120 | 945,280 | |
| Water outflows | |||||||
| Surface water outflows | 495,624 | 784,270 | 721,781 | 392,370 | 359,786 | 375,313 | |
| Evaporation from storages | 17,087 | 17,657 | 16,736 | 16,054 | 13,970 | 17,488 | |
| Evaporation from rivers | 4,989 | 9,252 | 7,890 | 5,712 | 2,519 | 2,522 | |
| Outflow to sea | 174,071 | 361,961 | 317,951 | 101,141 | 127,245 | 106,434 | |
| Overbank flow | 68,148 | 141,925 | 143,966 | 51,019 | 38,081 | 35,255 | |
| Recharge to groundwater* | 57,022 | 94,996 | 70,306 | 52,077 | 47,031 | 42,384 | |
| Allocated diversion to individual users | 2,973 | 2,973 | 2,967 | 3,360 | 3,012 | 3,730 | |
| Diversion to the urban system* | 171,334 | 155,506 | 161,965 | 163,007 | 127,928 | 167,500 | |
| Groundwater outflows | 121,691 | 121,852 | 122,334 | 120,361 | 121,657 | 112,062 | |
| Discharge to surface water* | 73,921 | 73,921 | 73,921 | 73,921 | 73,921 | 73,921 | |
| Outflow to outside region | 1,258 | 1,333 | 208 | 221 | 293 | 252 | |
| Outflow to sea | 2,167 | 2,253 | 4,437 | 1,246 | 1,772 | 3,321 | |
| Allocated extraction to individual users | 44,115 | 44,115 | 43,539 | 44,766 | 45,392 | 34,368 | |
| Non-allocated extraction to irrigation scheme* | 230 | 230 | 229 | 207 | 279 | 200 | |
| Urban water system outflows | 269,833 | 246,712 | 272,065 | 238,906 | 245,626 | 251,453 | |
| Discharge to sea | 75,238 | 81,979 | 69,347 | 64,282 | 62,726 | 56,602 | |
| Leakage to groundwater* | 13,051 | 12,689 | 20,548 | 10,839 | 10,908 | 2,162 | |
| Managed aquifer recharge* | 503 | 109 | 492 | 527 | 318 | 250 | |
| Other losses | 7,420 | 2,288 | 3,543 | 2,216 | 2,286 | 11,902 | |
| Other wastewater losses | 6,897 | - | 6,957 | 2,507 | 1,633 | 8,155 | |
| Return to surface water* | - | - | 258 | 3,456 | 3,880 | 1,510 | |
| Supply of drinking water to commerical and industrial customers | 27,848 | 25,876 | 27,126 | 17,786 | 31,467 | 28,758 | |
| Supply of drinking water to residential customers | 112,583 | 102,680 | 111,164 | 111,195 | 109,263 | 109,610 | |
| Supply of recycled water for own use | 2,713 | 492 | 526 | 4,714 | - | 3,574 | |
| Supply of recycled water to agriculture and irrigation customers* | 14,600 | 12,904 | 195 | 13,797 | 20,383 | 184 | |
| Supply of recycled water to commercial and industrial customers | 2,785 | 1,822 | 11,005 | 2,575 | 2,389 | 1.878 | |
| Supply of recycled water to irrigation water schemes* | 5,818 | 5,011 | 20,406 | 4,507 | - | 25,205 | |
| Supply of recycled water to other customers | - | 229 | - | - | - | - | |
| Supply of recycled water to residential customers | 377 | 633 | 498 | 505 | 373 | 398 | |
| Treated wastewater discharge to landscape | - | - | - | - | - | 1,265 | |
| Irrigation scheme outflows | 34,200 | 34,200 | 34,238 | 32,988 | 34,776 | 35,628 | |
| Irrigation delivery | 34,200 | 34,200 | 34,238 | 32,988 | 34,776 | 35,628 | |
| Total water outflows | 921,348 | 1,187,034 | 1,150,418 | 784,625 | 761,845 | 774,456 | |
| Unaccounted-for difference | (149,415) | (67,147) | 26,937 | (225,559) | (201,713) | (170,141) | |
| Change in water storage | |||||||
| Change in surface water storage | (49,494) | 37,378 | 4,413 | 2,054 | 5,562 | 683 | |
| Change in groundwater storage | 0 | 0 | 0 | 0 | 0 | 0 | |
| Change in urban storages | 0 | 0 | 0 | 0 | 0 | 0 | |
| Total change in water storage | (49,494) | 37,378 | 4,413 | 2,054 | 5,562 | 683 | |
| Closing water storage | 179,489 | 228,983 | 191,605 | 187,192 | 185,138 | 179,576 | |
| Change in water liability | |||||||
| Surface water liability | 0 | (133) | 16 | (290) | 315 | (123) | |
| Allocation remaining: individual users | 0 | (133) | 16 | (290) | 315 | (123) | |
| Groundwater liability | 0 | 12,485 | 11,989 | (1,501) | 888 | 31,484 | |
| Allocation remaining: individual users | 0 | 12,485 | 11,989 | (1,501) | 888 | 31,484 | |
| Total change in water liability | 0 | 12,352 | 12,005 | (1,791) | 1,203 | 31,361 | |
| Net change in water assets | (49,494) | 25,026 | (7,592) | 3,845 | 4,359 | (30,678) | |
* between-store flows
Note: quantification approaches used to derive each item volume are provided in the Methods.