


Adelaide: Supporting information
For the water account period 1 July 2023 to 30 June 2024
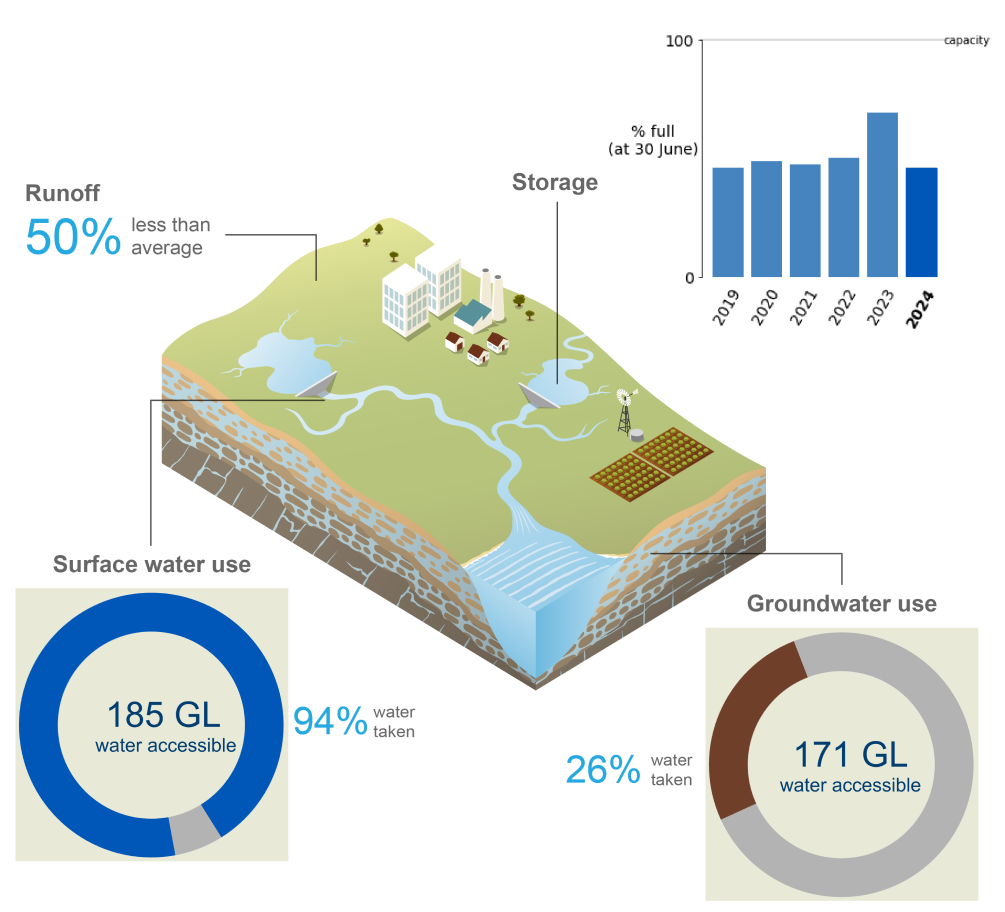
- Annual rainfall in the Adelaide region during 2023–24 was the lowest on record, contributing to lower runoff and surface water inflows into the region's surface water storages.
- Total storage volume in the Adelaide region decreased by 23.4% during the reporting year, finishing at 46.0% full on 30 June 2024—the lowest end-of-year storage volume since 2012–13.
- Approximately 61% of surface water and groundwater resources in the Adelaide region were estimated to have been taken, primarily for diversions to the urban system.
For further information on the region's water accounting statements scroll down this page or click on the links below:
Water assets
")
- The total volume of water assets in the Adelaide region was 179 GL on 30 June 2024, with approximately 51% of the water assets held in surface water storages.
- Aquifers accounted for approximately 48% of the total water assets in the Adelaide region, while the remaining volume of water assets was contained in rivers.
- A detailed breakdown of water assets in the Adelaide region is available in the Statement of Water Assets and Water Liabilities.
| Surface water | 2024 | 2023 | 2022 | 2021 | 2020 | 2019 |
| Barossa | 3,994 | 4,096 | 4,041 | 4,062 | 3,818 | 3,962 |
| Happy Valley | 6,905 | 6,900 | 8,347 | 6,912 | 6,101 | 7,086 |
| Hope Valley | 1,085 | 902 | 1,279 | 1,362 | 1,155 | 1,083 |
| Kangaroo Creek | 4,938 | 12,312 | 4,907 | 4,067 | 6,127 | 3,682 |
| Little Para | 7,940 | 13,778 | 6,200 | 5,557 | 9,723 | 7,977 |
| Millbrook | 6,742 | 9,093 | 8,850 | 7,292 | 7,763 | 7,326 |
| Mount Bold | 13,013 | 27,865 | 11,253 | 12,403 | 12,296 | 13,852 |
| Myponga | 17,933 | 24,121 | 23,494 | 22,970 | 22,037 | 19,816 |
| South Para | 19,954 | 31,697 | 20,252 | 19,040 | 16,541 | 15,534 |
| Warren | 2,583 | 752 | 4,786 | 4,776 | 4,844 | 4,806 |
| Accessible total | 85,087 | 131,516 | 93,409 | 88,441 | 90,405 | 85,124 |
| Dead storage | 6,234 | 6,234 | 6,234 | 6,234 | 6,234 | 6,234 |
| Total storage | 91,321 | 137,750 | 99,643 | 94,675 | 96,639 | 91,358 |
| Total capacity | 198,729 | 198,729 | 198,729 | 198,729 | 198,729 | 198,729 |
| % full | 46.0% | 69.3% | 50.1% | 47.6% | 48.6% | 46.0% |
- The total storage volume in the Adelaide region decreased by 23.4% during 2023–24, finishing at 46.0% full on 30 June 2024.
- This was the lowest end-of-year storage volume in the Adelaide region since 2012–13.
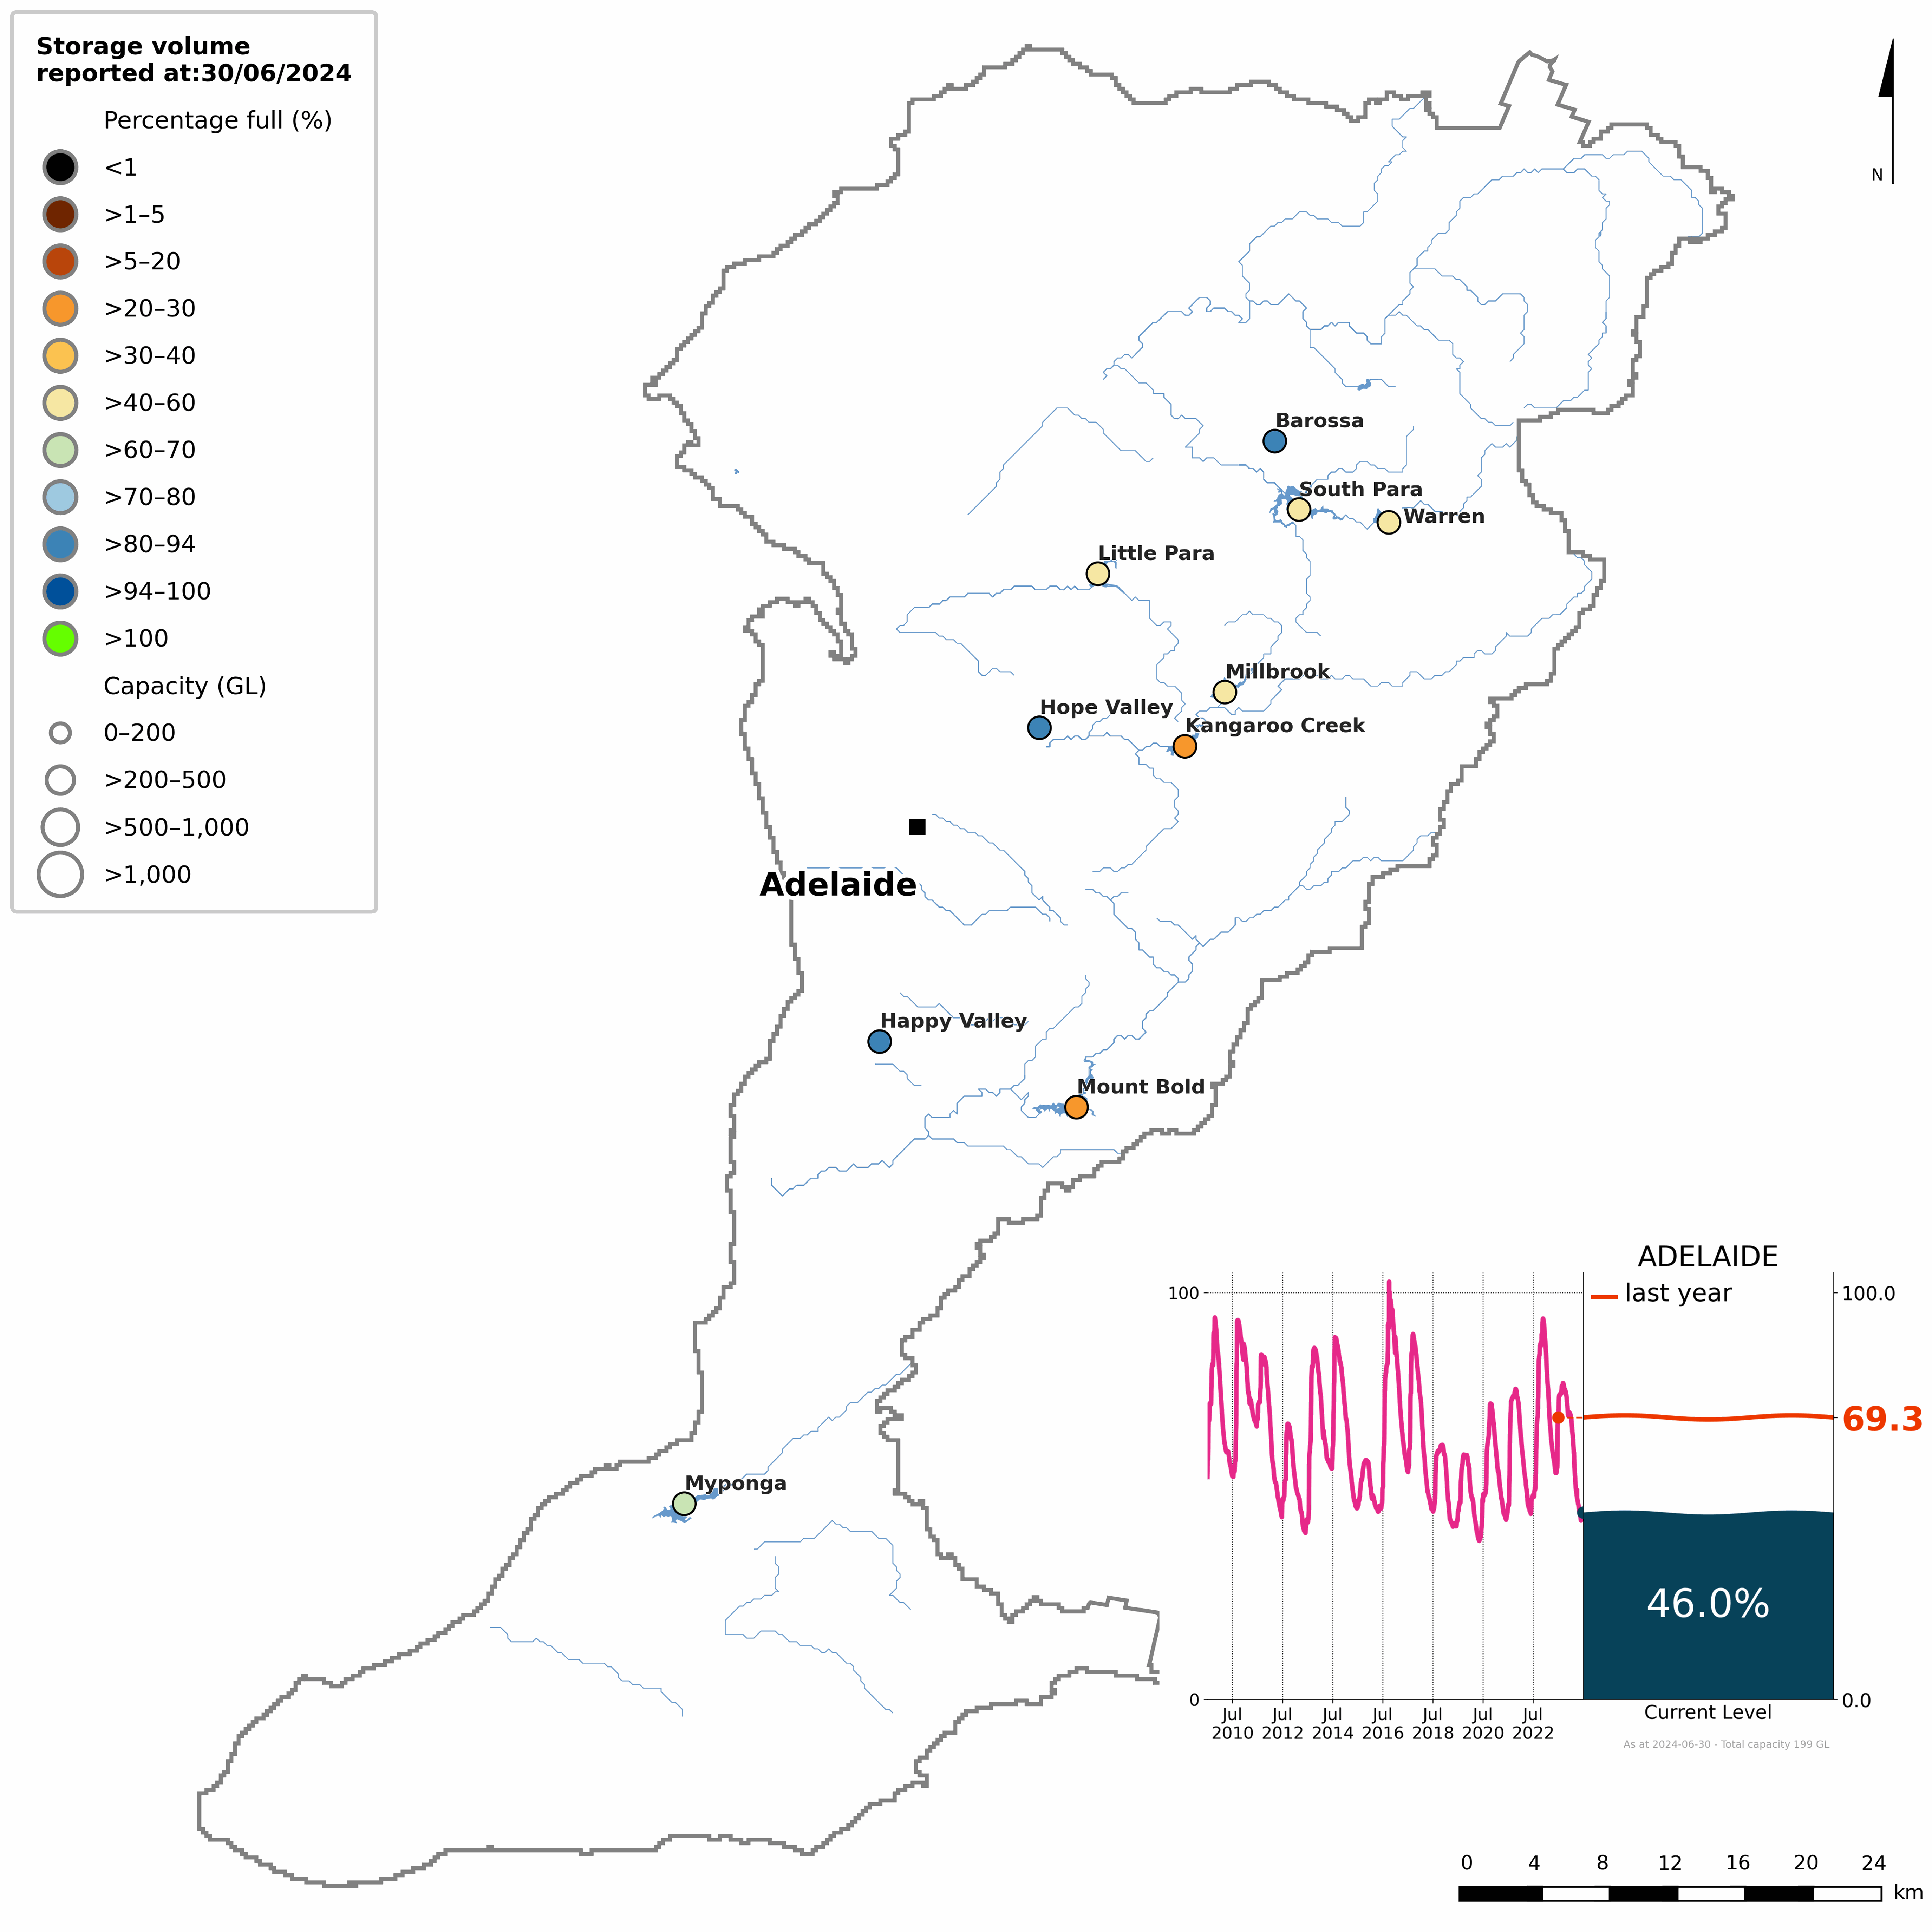
Figure S1 Percentage-full volume on 30 June 2024 for each storage and total storage volume from 2010–2024 (inset)
- The total storage volume in the Adelaide region began the 2023–24 year at 69.3% full—the highest opening storage volume on record.
- Despite a lack of rain-bearing systems from late winter to early spring, storages rose to approximately 78% by September.
- Although rainfall across the Adelaide region was above average between November and January, storages dropped to around 70% during December, but remained steady through to the end of summer.
- In response to the region's second driest autumn on record, storages across the Adelaide region declined rapidly, falling below 50% in late March for the first time since June 2022, dropping to 43% during April.
- By 30 June 2024, following near-average rainfall across the region in June, the total storage volume in the Adelaide region was 46.0% full—down 23.4% from this time last year.
- More detailed information on individual storages in the Adelaide region is available on the Bureau of Meteorology's Water Information Dashboard.
Water liabilities
")
- Water liabilities in the Adelaide region refer to the volume of allocation remaining on licence entitlements at the end of the reporting period (30 June).
- In the Adelaide region, licences in the Barossa prescribed Resources Area for the North Para River contain carryover provisions, which allow any unused portion of the allocation to be carried over to the next reporting period. For all other areas in the region, any unused allocations are forfeited at the end of the reporting year.
- A more detailed description of water allocations in the Adelaide region is provided in the Water use section.
| Description | 2024 | 2023 | 2022 | 2021 | 2020 | 2019 | |
| Opening balance at 01 July | 215 | 348 | 332 | 622 | 307 | 430 | |
| add | Allocation | 13,840 | 13,840 | 13,746 | 14,768 | 14,768 | 13,168 |
| less | Allocated diversion | 2,973 | 2,973 | 2,967 | 3,360 | 3,012 | 3,730 |
| less | Adjustment and forfeiture | 10,867 | 11,000 | 10,763 | 11,698 | 11,441 | 9,561 |
| Closing balance at 30 June | 215 | 215 | 348 | 332 | 622 | 307 | |
| Description | 2024 | 2023 | 2022 | 2021 | 2020 | 2019 | |
| Opening balance at 01 July | 59,919 | 47,434 | 35,445 | 36,946 | 36,058 | 4,574 | |
| add | Allocation | 110,600 | 110,600 | 109,110 | 109,110 | 109,114 | 97,918 |
| less | Allocated extraction | 44,115 | 44,115 | 43,539 | 44,766 | 45,392 | 34,368 |
| less | Adjustment and forfeiture | 66,485 | 54,000 | 53,582 | 65,845 | 62,834 | 32,066 |
| Closing balance at 30 June | 59,919 | 59,919 | 47,434 | 35,445 | 36,946 | 36,058 | |
- As no data was received for the 2023–24 reporting period, the figures represented in Tables S2 and S3 are carried forward from previous estimates and may not accurately reflect current conditions.
- Surface water allocations in the Adelaide region were estimated to be 14 GL for 2023–24, while groundwater allocations were estimated to be 171 GL.
- At the end of the 2023–24 reporting period, it was estimated that 60 GL of groundwater allocations would be carried over to the 2024–25 water year.
Water flows
")
- Total water inflows into the Adelaide region during 2023–24 were 1,021 GL, approximately 21% lower than the previous year.
- Surface water inflows contributed 33% (338 GL) of total water inflows, with delivery of inter-region agreement to surface water and runoff accounting for 73% of total surface water inflows.
- Groundwater inflows contributed 35% (353 GL) of total water inflows, primarily from recharge from landscape making up 79% of total groundwater inflows.
- Urban water inflows contributed 29% (298 GL) of total water inflows, in which diversion of surface water and wastewater collected resulted in 98% of total urban water inflows.
- Irrigation scheme inflows contributed 3% (32 GL) of total water inflows, mostly by recycled water received from urban water system and delivery of inter-region agreement to irrigation scheme constituting for 97% of total irrigation scheme inflows.
- Total water outflows from the Adelaide region during 2023–24 were 921 GL, approximately 22% lower than the previous year.
- Surface water outflows contributed 54% (496 GL) of total water outflows, mostly from outflow to sea and diversion to the urban system comprising 70% of total surface water outflows.
- Groundwater outflows contributed 13% (122 GL) of total water outflows, largely from discharge to surface water and allocated extraction to individual users composing for 97% of total groundwater outflows.
- Urban water outflows contributed 29% (270 GL) of total water outflows, proportionally from supply of drinking water to residential customers and discharge to sea accounting for 70% of total urban water outflows.
- Irrigation scheme outflows contributed 4% (34 GL) of total water outflows, entirely from irrigation delivery.
- A detailed breakdown of inflows and outflows for the Adelaide region is available in the Statement of Changes in Water Assets and Water Liabilities.
Water availability
| Surface water | 2024 | 2023 | 2022 | 2021 | 2020 | 2019 |
| Water availability | 252,622 | 409,792 | 300,593 | 224,405 | 239,712 | 205,125 |
| Water accessible | 185,389 | 169,694 | 176,043 | 178,397 | 143,003 | 181,098 |
| Water taken | 174,307 | 158,479 | 164,932 | 166,367 | 130,940 | 171,230 |
| % water accessible taken | 94% | 93% | 94% | 93% | 92% | 95% |
- Surface water availability in the Adelaide region during 2023–24 was slightly below the long-term average of 261 GL, and 38% lower than the previous year, reflecting the region's second driest year on record failing to replenish water resources.
- Changes in water availabilty across the Adelaide region are heavily influenced by runoff. Generally, when runoff increases or decreases, water availability responds in a similar way.
- Despite the decrease in water availability, surface water accessible for take in the Adelaide region was estimated to be the highest on record, 19% above the average of 155 GL, primarily due to increased diversions to the urban system.
- Likewise, water taken from surface water resources in the Adelaide region were estimated to be the highest on record, 18% above the average of 148 GL.
- This estimated increase in surface water accessible for take and water taken, despite lower water availability, may reflect the increased demand for water across the Adelaide region during the second driest year on record.
- Overall, approximately 94% of the estimated surface water accessible for take in the Adelaide region was taken, primarily for diversions to the urban system.
Water use
")
Consumptive use
| Surface Water | 2024 | 2023 | 2022 | 2021 | 2020 | 2019 |
| Barossa Valley PWRA | ||||||
| Individual users | 1,921 | 1,921 | 1,919 | 2,221 | 1,905 | 1,567 |
| Urban system | - | - | - | - | - | - |
| Sub-total | 1,921 | 1,921 | 1,919 | 2,221 | 1,905 | 1,567 |
| Western Mount Lofty Ranges PWRA | ||||||
| Individual users | 1,050 | 1,050 | 1,046 | 1,137 | 1,105 | 2,161 |
| Urban systems | 60,016 | 54,622 | 57,002 | 57,950 | 55,869 | 61,769 |
| Sub-total | 61,066 | 55,672 | 58,048 | 59,087 | 56,974 | 63,930 |
| Others | ||||||
| Individual users | 2 | 2 | 2 | 2 | 2 | 2 |
| Urban system | 111,318 | 100,884 | 104,963 | 105,057 | 72,059 | 105,731 |
| Sub-total | 111,320 | 100,886 | 104,965 | 105,059 | 72,061 | 105,733 |
| Total | 174,307 | 158,479 | 164,932 | 166,367 | 130,940 | 171,230 |
| Groundwater | 2024 | 2023 | 2022 | 2021 | 2020 | 2019 |
| Barossa Valley PWRA | ||||||
| Individual users | 4,950 | 4,950 | 4,886 | 6,179 | 5,975 | 4,440 |
| Western Mount Lofty Ranges PWRA | ||||||
| Individual users | 20,205 | 20,205 | 19,997 | 20,698 | 20,746 | 16,823 |
| McClaren Vale PWA | ||||||
| Individual users | 5,010 | 5,010 | 4,902 | 5,054 | 5,494 | 8 |
| Northern Adelaide Plains PWA | ||||||
| Individual users | 13,950 | 13,950 | 13,754 | 12,835 | 13,177 | 13,097 |
| Others | ||||||
| Irrigation scheme | 230 | 230 | 229 | 207 | 279 | 200 |
| Total | 44,345 | 44,345 | 43,768 | 44,973 | 45,671 | 34,568 |
- An estimated total of 219 GL of water was taken from surface water and groundwater resources for consumptive use in the Adelaide region during 2023–24, approximately 8% more than the previous year, primarily due to increased surface water diversions to the urban system.
- Surface water diversions across the Adelaide region were estimated at 174 GL, around 10% more than the previous year, and 19% above the average of 147 GL.
- Approximately 98% of surface water diversions in the Adelaide region were to the urban system (comprising both allocated and non-allocated diversions), while the remaining diversions were taken by individual users.
- Non-allocated surface water diversions to the urban system comprises of water imported from the River Murray and stored within the region’s storages. Most of these diversions were from the Happy Valley and Hope Valley reservoirs, located outside the region’s prescribed water resource areas.
- Groundwater extractions across the Adelaide region were estimated at 44 GL, similar to the previous few years, and 16% above the average of 38 GL.
- More than 99% of groundwater extractions were estimated to have been made by individual users, with the remainder used for the irrigation scheme.
Allocations and diversions
| Surface water | 2024 | 2023 | 2022 | 2021 | 2020 | 2019 |
| Barossa Valley PWRA | ||||||
| Allocated announcements | 2,700 | 2,700 | 2,664 | 2,870 | 2,870 | 2,870 |
| Allocated diversions | 1,921 | 1,921 | 1,919 | 2,221 | 1,905 | 1,567 |
| % used | 71% | 71% | 72% | 77% | 66% | 55% |
| Western Mount Lofty Ranges PWRA | ||||||
| Allocated announcements | 10,500 | 10,500 | 10,444 | 11,260 | 11,260 | 9,660 |
| Allocated diversions | 1,050 | 1,050 | 1,046 | 1,137 | 1,105 | 2,161 |
| % used | 10% | 10% | 10% | 10% | 10% | 22% |
| Little Para | ||||||
| Allocated announcements | 640 | 640 | 638 | 638 | 638 | 638 |
| Allocated diversions | 2 | 2 | 2 | 2 | 2 | 2 |
| % used | <1% | <1% | <1% | <1% | <1% | <1% |
| Total | ||||||
| Allocated announcements | 13,840 | 13,840 | 13,746 | 14,768 | 14,768 | 13,168 |
| Allocated diversions | 2,973 | 2,973 | 2,967 | 3,360 | 3,012 | 3,730 |
| % used | 21% | 21% | 22% | 23% | 20% | 28% |
- Total surface water allocations in the Adelaide region during 2023–24 were estimated at 14 GL, entirely for individual users.
- Approximately 21% of the surface water allocated to individual users in the Adelaide region was estimated to have been taken, similar to the previous few years, and 39% above the average of 10 GL.
| Groundwater | 2024 | 2023 | 2022 | 2021 | 2020 | 2019 |
| Barossa Valley PWRA | ||||||
| Allocated announcements | 7,800 | 7,800 | 7,863 | 7,863 | 7,863 | 7,862 |
| Allocated extractions | 4,950 | 4,950 | 4,886 | 6,176 | 5,975 | 4,440 |
| % used | 63% | 63% | 62% | 79% | 76% | 56% |
| Western Mount Lofty Ranges PWRA | ||||||
| Allocated announcements | 56,400 | 56,400 | 55,590 | 55,590 | 55,581 | 55,582 |
| Allocated extraction | 20,205 | 20,205 | 19,997 | 20,698 | 20,746 | 16,823 |
| % used | 36% | 36% | 36% | 37% | 37% | 30% |
| McClaren Vale PWA | ||||||
| Allocated announcements | 6,500 | 6,500 | 6,508 | 6,508 | 6,508 | 6,507 |
| Allocated extractions | 5,010 | 5,010 | 4,902 | 5,054 | 5,494 | 8 |
| % used | 77% | 77% | 75% | 78% | 84% | 0% |
| Northern Adelaide Plains PWA | ||||||
| Allocated announcements | 39,900 | 39,900 | 39,149 | 39,149 | 39,162 | 27,967 |
| Allocated extractions | 13,950 | 13,950 | 13,754 | 12,835 | 13,177 | 13,097 |
| % used | 35% | 35% | 35% | 33% | 34% | 47% |
| Total | ||||||
| Allocated announcements | 110,600 | 110,600 | 109,110 | 109,110 | 109,114 | 97,918 |
| Allocated extractions | 44,115 | 44,115 | 43,539 | 44,766 | 45,392 | 34,368 |
| % used | 40% | 40% | 40% | 41% | 42% | 35% |
- Total groundwater allocations in the Adelaide region during 2023–24 were estimated at 111 GL, entirely for individual users. This was similar to the previous few years, and 29% above the average of 86 GL.
- Approximately 40% of the allocated groundwater in the Adelaide region was estimated to have been extracted, similar to the previous few years, and 16% above the average of 16 GL.
Urban system supply
| Water sources | 2024 | 2023 | 2022 | 2021 | 2020 | 2019 |
| Surface water | 70,000 | 70,000 | 74,379 | 50,323 | 33,745 | 31,781 |
| Desalination water | 4,827 | 4,804 | 5,323 | 5,139 | 40,001 | 4,901 |
| Inter-region inflow | 101,334 | 85,506 | 87,586 | 112,684 | 94,183 | 135,719 |
| Total urban water supplied | 176,161 | 160,310 | 167,288 | 168,146 | 167,929 | 172,401 |
- An estimated total of 176 GL of water was sourced for the urban supply system in the Adelaide region during 2023–24, around 10% more than the previous year, and approximately 11% above the average of 159 GL.
- Approximately 57% of the total urban supply in the Adelaide region was sourced from inter-region inflow from the River Murray, while an estimated 40% came from surface water storages.
- The remaining volume of water supplied to Adelaide's urban system was sourced from the Adelaide Desalination Plant, similar to the previous few years.
- For more information on the use of desalinated water in the Adelaide region, visit SA Water's Seawater website.