


Melbourne: Climate and water
For the water account period 1 July 2023 to 30 June 2024
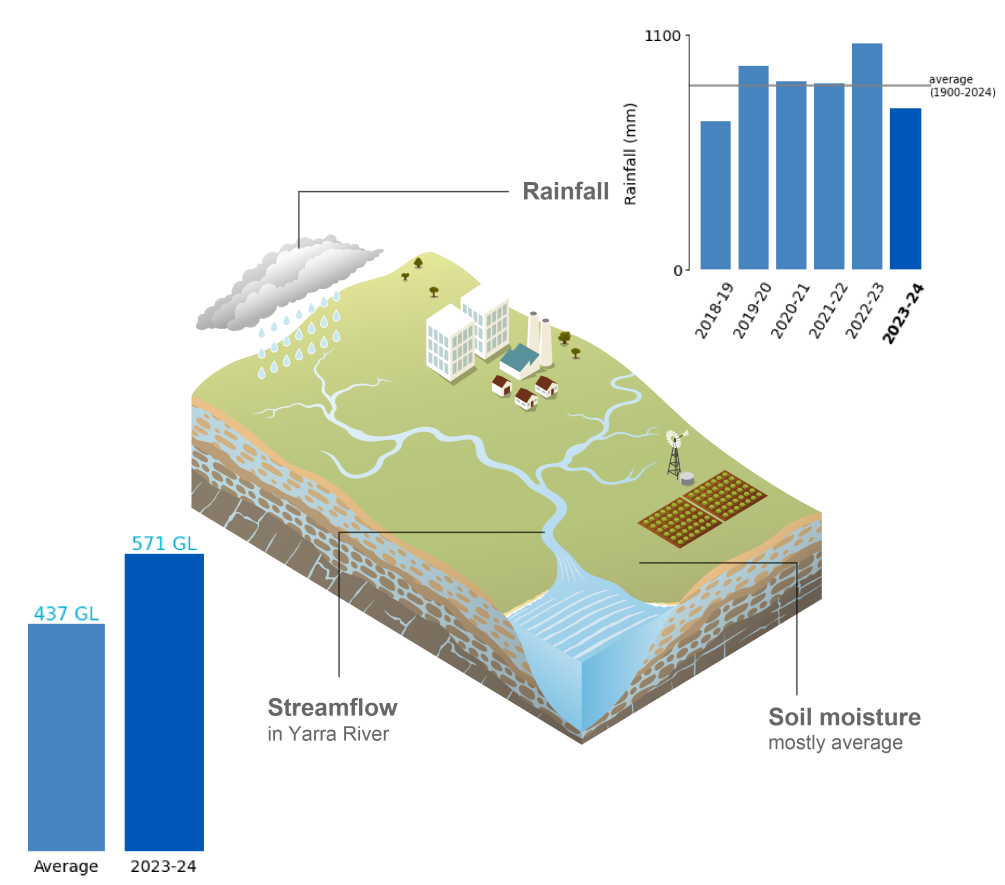
- Annual rainfall in the Melbourne region during 2023–24 was below average for the first time since 2018–19, primarily due to a lack of rain-bearing systems between July and September.
- Soil moisture in the root zone (0–1 m depth) was predominantly average to below average throughout much of the reporting period, with below-average conditions more prominent in the western half of the region.
- Total annual flows in the region's major rivers were above average, with all sites recording their highest January flows on record after the region's fourth-wettest January.
For further information on the region's climate and water conditions during the 2023-24 year scroll down this page or click on the links below:
About the region
- The Melbourne region experiences a temperate oceanic climate, characterised by four distinctive seasons, with mild to cold winters and warm to hot summers.
- Rainfall is generally consistent throughout the year, though higher totals are more common between June and November.
- Streamflows in the region's rivers typically reflect the distribution of rainfall throughout the year. Higher streamflows and storage inflows tend to occur between June and August, while lower streamflows are more prominent from January to April.
Climate conditions
Rainfall
Figure C1 Annual and monthly rainfall deciles for the Melbourne region during the 2023-24 year
- Total area-averaged rainfall in the Melbourne region during 2023–24 was 756 mm, 12% below the long-term average of 862 mm. This marked the first time since 2018–19 where rainfall was below average across the region.
- Rainfall from July to September was 49% below the long-term average for this period, due to a lack of rain-bearing systems, resulting in the region's seventh-driest July and sixth-driest September on record.
- In late September, a positive Indian Ocean Dipole (IOD) and El Niño event in the tropical Pacific Ocean were declared underway (as stated in this Climate Driver Update). Historically, concurrent positive IOD and El Niño events increase the likelihood of below-average rainfall, particularly during winter and spring, and likely contributed to the below-average July-to-September rainfall.
- A strong cold front and low-pressure system delivered up to 150 mm of rainfall to parts of the region during October, with several sites recording their highest October daily rainfall total on record (since records began in 1900). Overall, rainfall across the region in October was 36% above the long-term average.
- During the first week of January, multiple sites registered their highest January daily rainfall total on record, after troughs and associated upper-level systems generated heavy rainfall across the region. This resulted in the region's fourth-wettest January on record, with rainfall being 132% above the long-term average.
- By late January, the positive IOD returned to neutral, while the El Niño event began weakening, but despite their gradual decay, the region experienced its driest period of the reporting year, receiving only 19% of the February-March rainfall average. March was particularly dry, ranking as the third-driest March on record.
- This dry spell was broken in April when a low-pressure trough and associated cold front brought up to 100 mm of rainfall to parts of the region, resulting in the region's thirteenth-wettest April on record.
- At the end of autumn, the El Niño-Southern Oscillation returned to neutral, but despite its waning influence on the region's climate, rainfall during May and June was roughly half of the long-term average for this period.
- More information on Australia's climate and water during the 2023–24 reporting period can be found in the Financial Year Climate and Water Statement 2023–24.
Figure C2 Total monthly rainfall for the Melbourne region during the 2023-24 year compared with the average and percentiles for the region
- Rainfall was above average in October, December, January, and April, with January the only month to peak above the 90th percentile. April ranked just under the 90th percentile.
- Of the eight months that recorded below-average rainfall, July, September, March, and June ranked below the 10th percentile, while August, February, and May were just above the 10th percentile.
Actual evapotranspiration
Figure C3 Annual and monthly actual evapotranspiration deciles for the Melbourne region during the 2023-24 year
- Total area-averaged actual evapotranspiration was average to below average across much of the Melbourne region during 2023–24, with periods of low rainfall—particularly during winter, late summer, and autumn—reducing water availability.
- Evapotranspiration was average to very much below average across much of the region from July to November, as low rainfall limited water availability despite high rainfall in October providing little respite.
- Above-average rainfall in December, followed by the region's fourth-wettest January on record, boosted water availability across the region. This led to very much above average evapotranspiration, particularly during January.
- On the back of very low rainfall in February and March, evapotranspiration returned to predominantly below-average levels by the start of autumn.
- Following the region's thirteenth-wettest April on record, evapotranspiration rebounded across the region, but decreased again in response to low rainfall in May, and remained predominantly below average through to the end of the reporting year.
Soil moisture
Figure C4 Annual and monthly soil moisture deciles for the Melbourne region during the 2023-24 year
- Soil moisture in the root zone (0–1 m depth) was predominantly average to below average across the Melbourne region during 2023–24, with below-average conditions more prominent in the west, reflecting the distribution of rainfall throughout the reporting year.
- From July to November, soil moisture was below average across much of the region, following a lack of rain-bearing systems, particularly during late winter and early spring. Soil moisture in much of the west became very dry during this period, with high rainfall in October confined to the eastern third of the region.
- On the back of above-average rainfall in December, combined with the region's fourth-wettest January on record, soil moisture became very much above average across most of the region during January. However, following low rainfall in February and March, soil moisture declined rapidly, returning to predominantly below-average conditions by March.
- In response to the region's thirteenth-wettest April on record, soil moisture rebounded across most of the region in April, but decreased again during May after below-average rainfall, remaining below average through to the end of June.
- More information on the soil moisture conditions across the Melbourne region during the 2023–24 reporting year is available on the Australian Water Outlook.
Streamflow responses
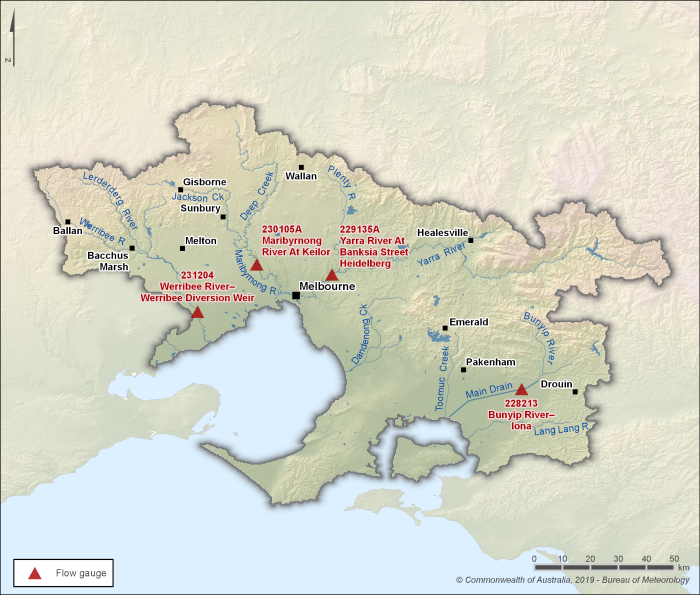
Figure C5 Key flow gauging stations along the main rivers within the Melbourne region
- There are four main river systems within the Melbourne region: the Bunyip River catchment area, the Maribyrnong River catchment area, the Werribee River catchment area, and the Yarra River catchment area.
- Of these, streamflows in the Maribyrnong, Werribee, and Yarra rivers are influenced by diversions for consumptive use, dam operations, and dam spills. The Bunyip River is less influenced by these factors.
- Four gauging stations (shown in Figure C5) are used to represent seasonal flow patterns in the rivers.
Figure C6 Total monthly flow for major rivers in the Melbourne region during the 2023-24 year compared with the average and percentiles
- Total annual flows in the region's major rivers were above average during 2023–24, despite below-average annual rainfall, reflecting the periods of high rainfall in October, the first half of summer, and April. The exception was the Maribyrnong River at Keilor (Station 230105A), where annual flows were 36 GL, roughly half the long-term annual average of 74 GL.
- Flows in the Yarra River at Banksia Street Heidelberg (Station 229135A), the region's largest river by volume, were the ninth highest on record, recording 576 GL during the reporting year, 31% above the long-term average of 438 GL. Similarly, flows in the Werribee River at Wyndham Vale (Station 231204A) ranked the sixth highest on record.
- In response to above-average rainfall in October, flows in the Yarra and Bunyip rivers rose sharply, but remained below the 90th percentile. However, as most of the rainfall was confined to the east of Melbourne, flows in the Maribyrnong and Werribee rivers stayed well below the long-term average from July through to November.
- All gauging stations recorded their highest January flows on record, following the region's fourth-wettest January. However, with low rainfall in February and March, streamflows dropped to near or below average by the start of autumn.
- Streamflows remained at or below average through to the end of June, except for the Werribee River at Wyndham Vale, where flows hovered around the 90th percentile, though flows during autumn are historically the lowest throughout the reporting year.