


Melbourne: Supporting information
For the water account period 1 July 2023 to 30 June 2024
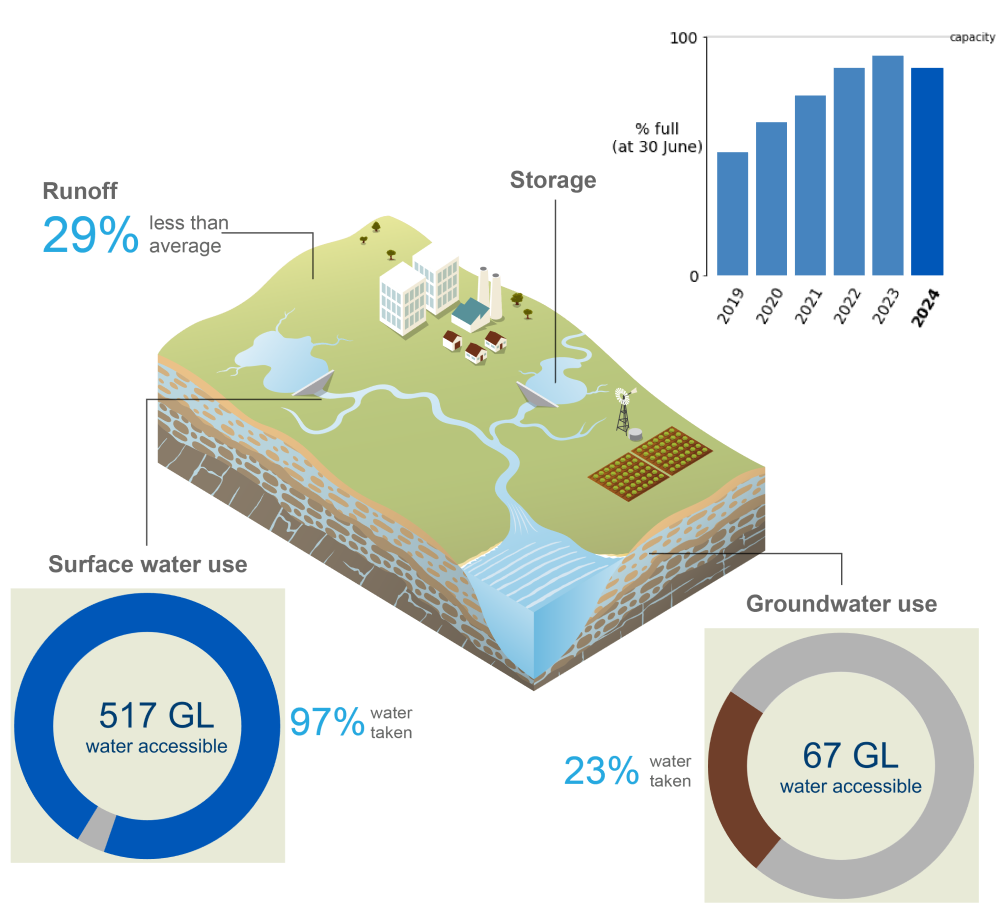
- Annual rainfall in the Melbourne region during 2023–24 was below average for the first time since 2018–19, contributing to lower runoff and surface water inflows into the region's surface water storages.
- Total storage volume in the Melbourne region decreased by 5.2% during the reporting year, finishing at 86.7% full on 30 June 2024, with storages recording the highest three-year average on record.
- Approximately 88% of total surface water and groundwater resources in the Melbourne region were taken, primarily for diversions to the urban system.
For further information on the region's water accounting statements scroll down this page or click on the links below:
Water assets
")
- Total water assets in the Melbourne region were 1,789 GL on 30 June 2024, with approximately 96% of the water assets held in surface water storages.
- Aquifers accounted for around 2% of total assets in the Melbourne region, while slightly less than 2% were part of the urban water supply system. The remaining volume of water assets was contained within rivers.
- A detailed breakdown of water assets in the Melbourne region is available in the Statement of Water Assets and Water Liabilities.
| Surface water | 2024 | 2023 | 2022 | 2021 | 2020 | 2019 |
| Cardinia | 243,742 | 247,580 | 235,252 | 207,773 | 208,122 | 171,106 |
| Greenvale | 19,815 | 23,585 | 25,433 | 22,564 | 21,716 | 19,476 |
| Maroondah | 6,144 | 22,470 | 12,950 | 21,251 | 22,177 | 8,234 |
| Melton | 7,590 | 11,036 | 12,146 | 14,376 | 10,030 | 5,265 |
| Merrimu | 27,913 | 28,742 | 23,693 | 14,921 | 10,245 | 10,264 |
| O'Shannassy | 2,310 | 3,250 | 3,180 | 3,117 | 2,594 | 309 |
| Pykes Creek | 17,330 | 19,666 | 17,322 | 20,371 | 16,344 | 16,368 |
| Rosslynne | 20,936 | 23,886 | 16,019 | 10,043 | 5,492 | 4,627 |
| Silvan | 34,941 | 35,525 | 34,980 | 36,656 | 35,551 | 34,200 |
| Sugarloaf | 84,212 | 93,545 | 93,011 | 83,417 | 90,115 | 43,672 |
| Tarago | 37,755 | 37,918 | 37,836 | 37,924 | 31,536 | 23,717 |
| Thomson | 990,778 | 1,032,372 | 962,548 | 789,695 | 638,910 | 492,042 |
| Upper Yarra | 119,600 | 135,057 | 138,972 | 128,308 | 79,116 | 95,544 |
| Yan Yean | 28,306 | 29,151 | 29,257 | 27,006 | 26,030 | 21,771 |
| Accessible total | 1,641,372 | 1,743,783 | 1,642,599 | 1,417,422 | 1,197,978 | 946,595 |
| Dead storage | 76,623 | 76,623 | 76,623 | 76,623 | 76,623 | 76,623 |
| Total storage | 1,717,995 | 1,820,406 | 1,719,222 | 1,494,045 | 1,274,601 | 1,023,218 |
| Total capacity | 1,980,744 | 1,980,744 | 1,980,744 | 1,980,744 | 1,980,744 | 1,980,744 |
| % full | 86.7% | 91.9% | 86.8% | 75.4% | 64.3% | 51.7% |
- Total storage volume in the Melbourne region decreased by 5.2% during 2023–24, finishing at 86.7% full on 30 June 2024.
- This was the third-highest end-of-year storage volume for the Melbourne region, contributing to the highest three-year average total storage volume on record.
- Although the Thomson Reservoir is located outside the Melbourne region, it holds approximately 55% of the Melbourne region's total surface water storage. Water is transferred from the Thomson Reservoir to the Upper Yarra Reservoir via the Thomson–Yarra pipeline for distribution to the urban water supply system within the Melbourne region.
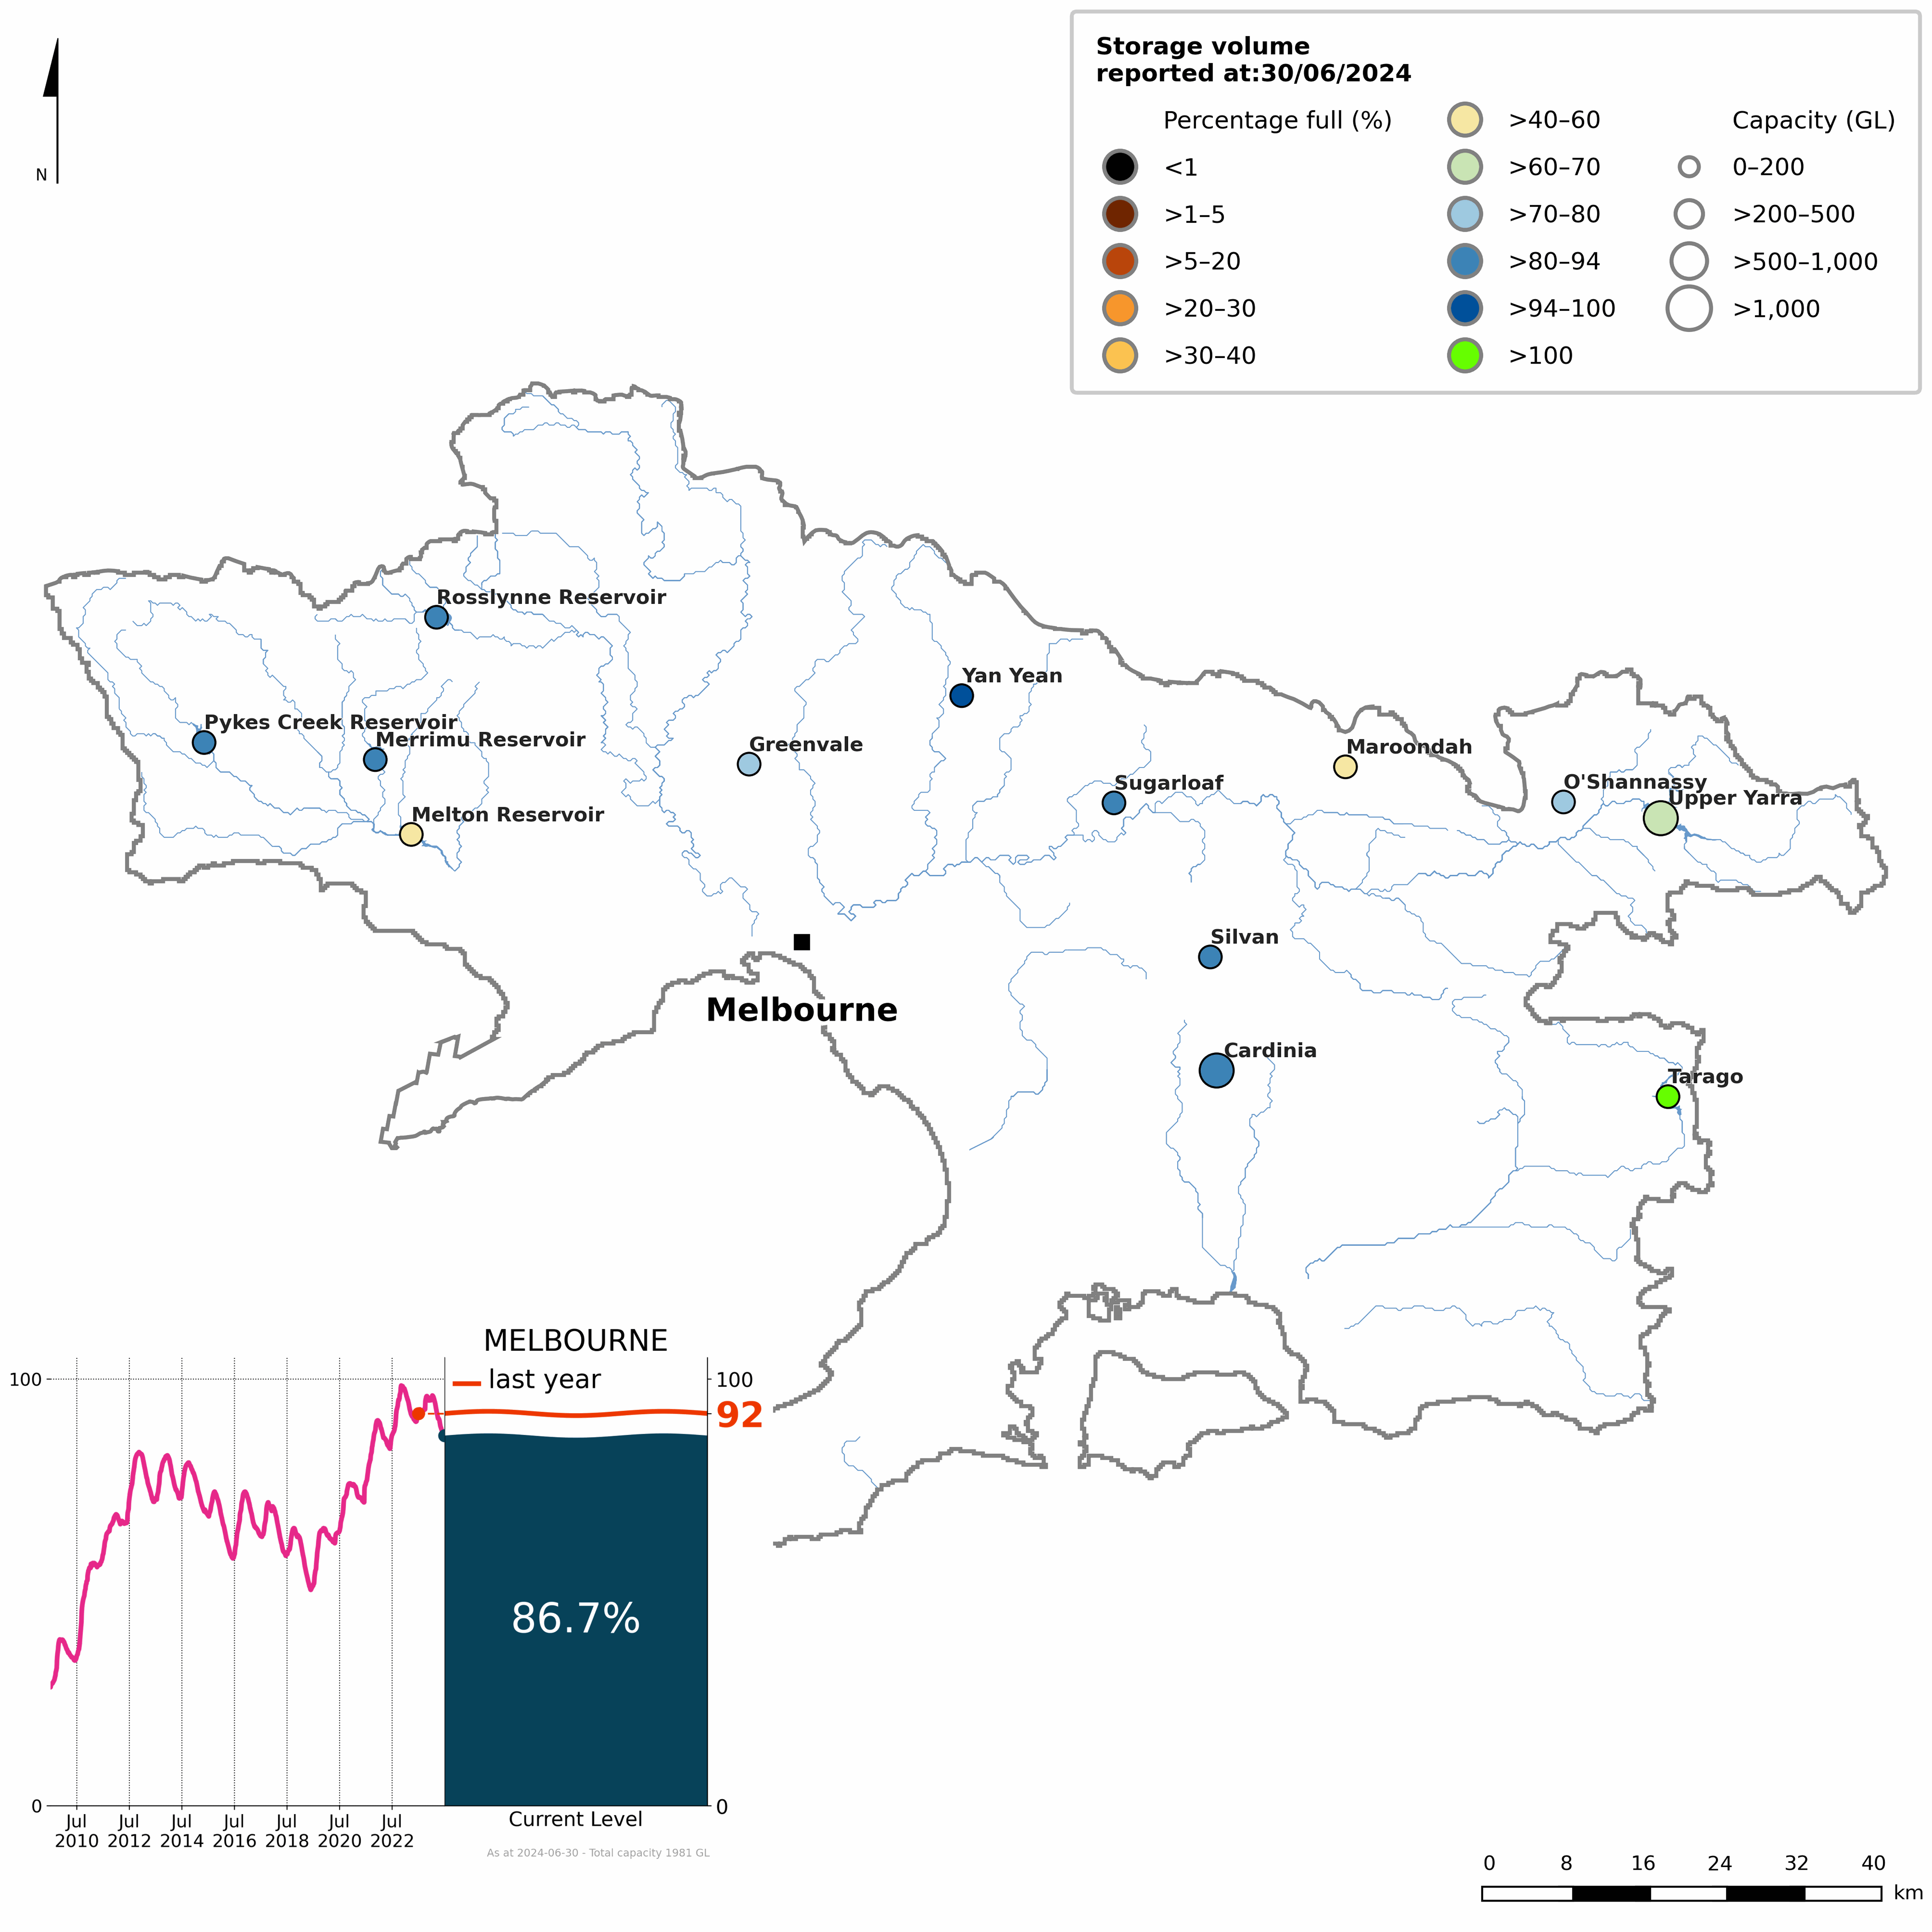
Figure S1 Percentage-full volume on 30 June 2024 for each storage and total storage volume from 2009–2024 (inset)
- Storages in the Melbourne region began the 2023–24 year at 91.9% full—the highest opening storage volume on record.
- Despite a lack of rain-bearing systems affecting the region from late winter to early spring, storages rose to approximately 96% by September.
- On the back of above-average rainfall from October to January, storages remained steady at 96% throughout late spring and early summer, peaking at 97% in mid-January, the highest volume for 2023–24, following the Melbourne region's fourth-wettest January on record.
- In response to exceptionally low rainfall during February and March, storages dropped below 90% in March for the first time since May 2023, reflecting the influence or prolonged wet conditions across Melbourne region.
- Despite the Melbourne region recording its thirteenth-wettest April on record, storages continued to decline through to the end of the reporting period.
- By 30 June 2024, total surface water storage volume in the Melbourne region was 86.7% full—down 5.2% from this time last year, but the third-highest end-of-year storage volume.
- More detailed information on individual storages in the Melbourne region is available on the Bureau of Meteorology's Water Information Dashboard.
Water liabilities
")
- Water liabilities in the Melbourne region refer to the volume of allocation remaining on licence entitlements at the end of the reporting period (30 June).
- As there are no carryover provisions for groundwater supply licences or inter-region commitments in the Melbourne region, any unused portion of allocation is forfeited at the end of the reporting year. Consequently, the closing balance for both groundwater and inter-region commitments is 0 ML in the Melbourne region.
- A more detailed description of water allocations in the Melbourne region is provided in the Water use section.
| Description | 2024 | 2023 | 2022 | 2021 | 2020 | 2019 | |
| Opening balance at 01 July | 27,363 | 19,922 | 11,451 | 11,229 | 5,958 | 8,408 | |
| add | Allocation | 22,873 | 22,939 | 22,954 | 22,726 | 16,787 | 6,978 |
| less | Allocated diversion | 8,518 | 8,311 | 8,311 | 8,664 | 8,651 | 7,618 |
| less | Adjustment and forfeiture | 14,000 | 7,186 | 6,172 | 13,840 | 2,865 | 1,810 |
| Closing balance at 30 June | 27,718 | 27,363 | 19,922 | 11,451 | 11,229 | 5,958 | |
| Description | 2024 | 2023 | 2022 | 2021 | 2020 | 2019 | |
| Opening balance at 01 July | 0 | 0 | 0 | 0 | 0 | 0 | |
| add | Allocation | 66,618 | 66,628 | 66,634 | 67,985 | 65,463 | 64,626 |
| less | Allocated extraction | 15,572 | 16,321 | 16,781 | 17,558 | 18,278 | 20,958 |
| less | Adjustment and forfeiture | 51,045 | 50,307 | 49,854 | 50,427 | 47,185 | 43,668 |
| Closing balance at 30 June | 0 | 0 | 0 | 0 | 0 | 0 | |
| Description | 2024 | 2023 | 2022 | 2021 | 2020 | 2019 | |
| Opening balance at 01 July | 0 | 0 | 0 | 0 | 0 | 0 | |
| add | Allocation | 8,155 | 5,625 | 5,225 | 5,225 | 5,225 | 5,425 |
| less | Allocated diversion | 4,503 | 4,178 | 3,337 | 3,647 | 4,263 | 4,171 |
| less | Adjustment and forfeiture | 3,652 | 1,447 | 1,888 | 1,578 | 962 | 1,254 |
| Closing balance at 30 June | 0 | 0 | 0 | 0 | 0 | 0 | |
- Surface water and groundwater allocations in the Melbourne region were similar to the previous few years, although total surface water allocated (which includes carryover plus allocation) increased slightly due to the gradual rise in carryover over recent years.
- In total, surface water allocations in the Melbourne region were 50 GL, while groundwater allocations were 67 GL.
- Allocations for inter-region commitments increased in the Melbourne region due to Gippsland Water obtaining a 3.33 gigalitre bulk water entitlement from the Tarago Reservoir. This, in addition to their existing 4.825 gigalitre bulk water entitlement from the Tarago River, means Gippsland Water now hold a combined bulk water entitlement of 8.155 gigalitres. More information is available in Gippsland Water's 2023-24 Annual Report.
- At the end of the reporting period, it was determined that 28 GL of surface water allocations in the Melbourne region would be carried over into the 2024–25 water year.
Water flows
")
- Total water inflows into the Melbourne region during 2023-24 were 2,970 GL, approximately 35% lower than the previous year.
- Surface water inflows contributed 48% (1,422 GL) of total water inflows, primarily from runoff, accounted for 71% of total surface water inflows.
- Groundwater inflows contributed 22% (654 GL) of total water inflows, with recharge from landscape and recharge from surface water making up 90% of total groundwater inflows.
- Urban water inflows contributed 30% (893 GL) of total water inflows, in which diversion of surface water and wastewater collected resulted in more than 99% of total urban water inflows.
- Total water outflows from the Melbourne region during 2023-24 were 3,038 GL, approximately 35% lower than the previous year.
- Surface water outflows contributed 66% (2,002 GL) of total water outflows, mostly from outflow and diversion to the urban system comprising 76% of total surface water outflows.
- Groundwater outflows contributed 5% (147 GL) of total water outflows, mainly from inter-region coastal outflows constituting for 90% of total groundwater outflows.
- Urban water outflows contributed 29% (888 GL) of total water outflows, largely from discharge to sea and supply of drinking water to residential customers to residential customers composing for 72% of total urban water outflows.
- A detailed breakdown of inflows and outflows for the Melbourne region is available in the Statement of Changes in Water Assets and Water Liabilities.
Water availability
| Surface water | 2024 | 2023 | 2022 | 2021 | 2020 | 2019 |
| Water availability | 2,837,518 | 4,104,346 | 2,957,139 | 2,693,921 | 2,915,566 | 1,913,566 |
| Water accessible | 517,481 | 495,455 | 485,047 | 478,915 | 488,382 | 492,325 |
| Water taken | 499,474 | 479,380 | 468,516 | 463,275 | 479,284 | 491,711 |
| % water accessible taken | 97% | 97% | 97% | 97% | 98% | 100% |
- Surface water availability in the Melbourne region during 2023–24 was above average for the fifth consecutive year—15% above the long-term average—but 31% lower than the previous year.
- Changes in water availability across the Melbourne region are heavily influenced by runoff. Generally, when runoff increases or decreases, water availability responds in a similar way.
- Despite the decrease in water availability, surface water accessible for take was the highest on record in the Melbourne region, 12% above the average of 463 GL, primarily due to increased diversions to the urban system.
- Likewise, water taken from surface water resources in the Melbourne region were the highest on record, 10% above the average of 454 GL.
- This increase in water accessible for take and water taken, despite the decrease in water availability, may reflect the prolonged period of high water availability in recent years easing pressure on water use in the Melbourne region.
- Overall, approximately 97% of surface water accessible for take in the Melbourne region was taken, primarily for diversions to the urban system.
Water use
")
Consumptive use
| Surface water | 2024 | 2023 | 2022 | 2021 | 2020 | 2019 |
| Individual users | 8,518 | 8,311 | 8,311 | 8,664 | 8,651 | 7,618 |
| Inter-region | 4,503 | 4,178 | 3,337 | 3,647 | 4,263 | 4,171 |
| Urban system | 477,338 | 455,286 | 445,263 | 440,125 | 456,047 | 466,270 |
| Total | 490,359 | 467,775 | 456,911 | 452,436 | 468,961 | 478,059 |
| Groundwater | 2024 | 2023 | 2022 | 2021 | 2020 | 2019 |
| Individual users | 15,572 | 16,321 | 16,781 | 17,558 | 18,278 | 20,958 |
| Urban system | 51 | 81 | 61 | 76 | 72 | 73 |
| Total | 15,623 | 16,402 | 16,842 | 17,634 | 18,350 | 21,031 |
- A total of 506 GL was taken from surface water and groundwater resources for consumptive use in the Melbourne region during 2023–24, around 5% more than the previous year, primarily due to increased surface water diversions to the urban system.
- Surface water diversions across the Melbourne region were 490 GL, around 5% higher than the previous year.
- Approximately 97% of surface water diversions in the Melbourne region were to the urban system, almost entirely to Melbourne Water. Individual users (comprising of allocated and non-allocated diversions) accounted for just under 2% of diversions, while the remaining surface water diversions were taken by inter-region users with statutory rights.
- Groundwater extractions across the Melbourne region were 16 GL, a decrease of nearly 5% compared to the previous year, with more than 99% of extractions made by individual users. The remaining groundwater extractions were for the urban system.
Allocations and diversions
| Surface water | 2024 | 2023 | 2022 | 2021 | 2020 | 2019 |
| Individual users | ||||||
| Carryover | 27,363 | 19,922 | 11,451 | 11,229 | 5,958 | 8,408 |
| Allocated announcements | 22,873 | 22,939 | 22,954 | 22,726 | 16,787 | 6,978 |
| Allocated diversions | 8,518 | 8,311 | 8,311 | 8,664 | 8,651 | 7,618 |
| % used | 17% | 19% | 24% | 26% | 38% | 50% |
| Inter-region | ||||||
| Carryover | 0 | 0 | 0 | 0 | 0 | 0 |
| Allocated announcements | 8,155 | 5,625 | 5,225 | 5,225 | 5,225 | 5,425 |
| Allocated diversions | 4,503 | 4,178 | 3,337 | 3,647 | 4,263 | 4,171 |
| % used | 55% | 74% | 64% | 70% | 82% | 77% |
| Total | ||||||
| Carryover | 27,363 | 19,922 | 11,451 | 11,229 | 5,958 | 8,408 |
| Allocated announcements | 31,028 | 28,564 | 28,179 | 27,951 | 22,012 | 12,403 |
| Allocated diversions | 13,021 | 12,489 | 11,648 | 12,311 | 12,914 | 11,789 |
| % used | 22% | 26% | 29% | 31% | 46% | 57% |
- Total surface water allocations in the Melbourne region during 2023–24 were 58 GL (50 GL for individual users and 8 GL for inter-region users).
- Of the surface water allocated to individual users in the Melbourne region, only 17% was taken, while 55% of the bulk water entitlements to inter-region users with statutory rights in the Gippsland Water district were used.
- Overall, approximately 22% of the allocated surface water in the Melbourne region was taken, similar to last year, and slightly higher than the average of 12 GL.
| Groundwater | 2024 | 2023 | 2022 | 2021 | 2020 | 2019 |
| Individual users | ||||||
| Carryover | 0 | 0 | 0 | 0 | 0 | 0 |
| Allocated announcements | 66,618 | 66,628 | 66,634 | 67,985 | 65,463 | 64,626 |
| Allocated extractions | 15,572 | 16,321 | 16,781 | 17,558 | 18,278 | 20,958 |
| % used | 23% | 24% | 25% | 26% | 28% | 32% |
- Total groundwater allocations in the Melbourne region during 2023–24 were 67 GL, all for individual users. This was similar to the previous year, but 15% above the average of 58 GL.
- Approximately 23% of the allocated groundwater in the Melbourne region was extracted, slightly less than the previous year, and around 12% below the average of 18 GL.
Urban supply system
| Water sources | 2024 | 2023 | 2022 | 2021 | 2020 | 2019 |
| Surface water | 477,338 | 455,286 | 445,263 | 440,125 | 456,047 | 466,270 |
| Groundwater | 51 | 81 | 61 | 76 | 72 | 73 |
| Desalinated water | 0 | 4,182 | 125,000 | 125,000 | 118,132 | 22,374 |
| Total urban water supplied | 477,389 | 459,549 | 570,324 | 565,201 | 574,251 | 488,717 |
- A total of 477 GL of water was sourced for the urban supply system in the Melbourne region, slightly more than the previous year, and close to the average of 464 GL.
- More than 99% of the total urban supply in the Melbourne region came from surface water storages, which was around 5% more than the previous year.
- The remaining volume of water sourced for the urban supply system in the Melbourne region came from groundwater extractions. No water was supplied by the desalination plant during 2023–24.
- In April 2023, the Minister of Water announced that no desalinated water delivery was required during the 2023–24 financial year, due to adequate was availability across the Melbourne region.
- Since first operating in 2016–17, the desalination plant has delivered 455 GL of water to the urban supply system in the Melbourne region.
- For more information on the use of desalinated water in the Melbourne region, visit the Victorian Desalination Plant website.