


Sydney: Climate and water
For the water account period 1 July 2023 to 30 June 2024
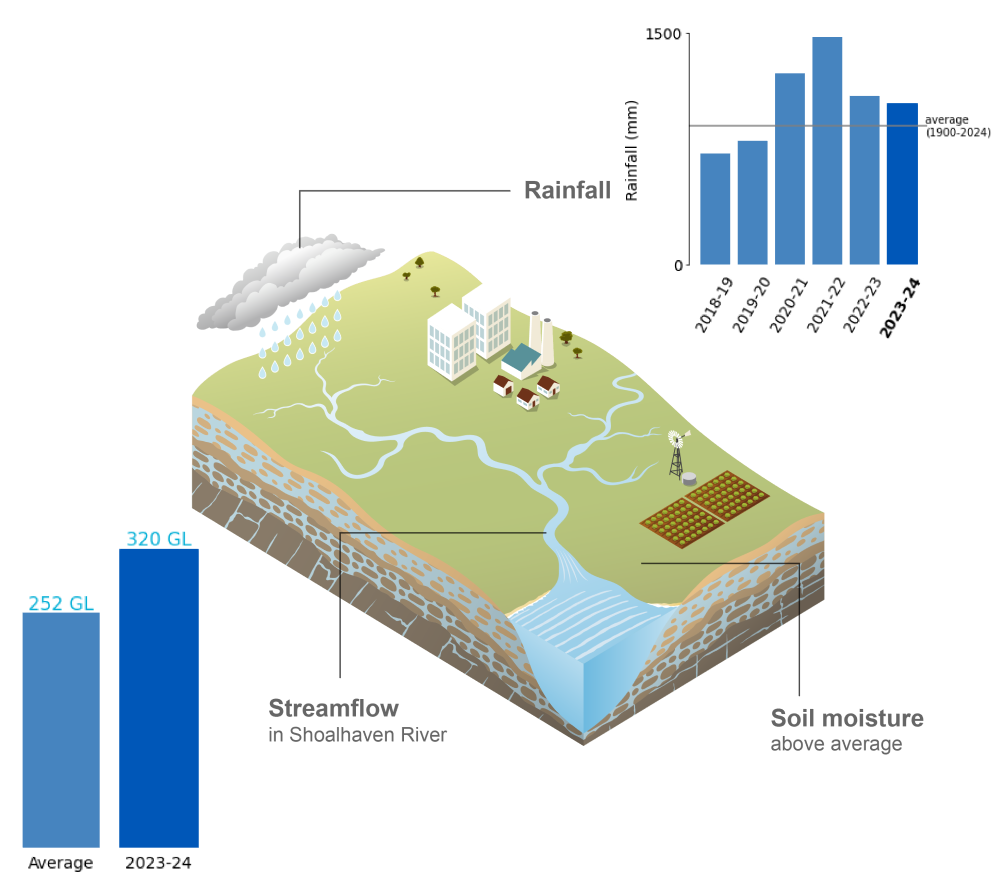
- Annual rainfall in the Sydney region during 2023–24 was above average for the fourth consecutive year, mainly due to a sustained period of wetter-than-average conditions between November and June.
- Soil moisture in the root zone (0–1 m depth) was average across much of the region throughout the reporting period, with below-average conditions prominent in the north.
- Total annual flows in the region's major rivers were above average, driven by high rainfall totals that increased runoff and streamflow throughout summer and autumn.
For further information on the region's climate and water conditions during the 2023-24 year scroll down this page or click on the links below:
About the region
- The Sydney region experiences a temperate climate, characterised by mild to cold winters and warm to hot summers.
- Rainfall is generally consistent throughout the year, with higher monthly totals more common between December and May.
- Streamflows in the region are typically perennial, reflecting the relatively consistent year-round rainfall.
Climate conditions
Rainfall
Figure C1 Annual and monthly rainfall deciles for the Sydney region during the 2023-24 year
- Total area-averaged rainfall in the Sydney region during 2023–24 was 1,041 mm, 16% above the long-term average of 895 mm. This marked the region's fourth consecutive year of above-average rainfall, contributing to the region's fourth-wettest four-year period on record.
- Rainfall from July to October was 55% below the long-term average for this period, due to a lack of rain-bearing systems. July was particularly dry, ranking as the seventh-driest July, contributing to the region's eleventh-driest winter on record.
- In late September, both a positive Indian Ocean Dipole (IOD) and an El Niño event in the tropical Pacific Ocean were declared underway (as stated in this Climate Driver Update). Historically, concurrent positive IOD and El Niño events increase the likelihood of below-average rainfall, particularly during winter and spring.
- Between November and June, rainfall was 43% above the long-term average for this period. Within this timeframe, March was the only month to record below-average rainfall, with the region receiving about half its monthly average.
- By late January, the positive IOD returned to neutral, while the El Niño event began weakening, but despite the gradual decline of the El Niño event throughout autumn, an east coast trough in early April brought 200–300 mm of rain to parts of the region, resulting in the tenth-wettest April on record.
- During mid-May, a surface trough triggered widespread showers and thunderstorms, leading to weekly totals over 200 mm across the region. This, along with the April event, contributed to the region's twentieth-wettest autumn on record, with rainfall ending 42% above the long-term seasonal average.
- At the end of autumn, the El Niño-Southern Oscillation returned to neutral, with its influence on the region's climate gradually waning. Despite this, rainfall in June was 77% above the long-term average, capping off another wet year for the region.
- More information on Australia's climate and water during the 2023–24 reporting period can be found in the Financial Year Climate and Water Statement 2023–24.
Figure C2 Total monthly rainfall for the Sydney region during the 2023-24 year compared with the average and percentiles for the region
- April was the wettest month of the year, with rainfall peaking around the 90th percentile — the only month to reach this level in 2023–24.
- July and September were the only months to record rainfall below the 10th percentile, with July being the driest month of the reporting year.
Actual evapotranspiration
Figure C3 Annual and monthly actual evapotranspiration deciles for the Sydney region during the 2023-24 year
- Total area-averaged actual evapotranspiration was average to above average across much of the Sydney region during 2023–24, with the fourth consecutive year of above-average rainfall maintaining a high level of water availability.
- A lack of significant rainfall from July to October decreased water availability across the region, leading to predominantly below average evapotranspiration from late winter through to the end of spring.
- Evapotranspiration rebounded in December, following above-average rainfall in November and December, and remained average to above average through to early autumn, driven primarily by continued high water availability.
- Following the region’s tenth-wettest April on record, evapotranspiration increased again, particularly in April when conditions were well above average, with above-average rainfall in May and June maintaining high water availability leading into winter.
Soil moisture
Figure C4 Annual and monthly soil moisture deciles for the Sydney region during the 2023-24 year
- Soil moisture in the root zone (0–1 m depth) was average across much of the Sydney region during 2023–24, except in the north, where it was below average, reflecting the distribution of rainfall throughout the reporting year.
- From July to November, soil moisture was below average across much of the region, following a lack of significant rainfall. Some areas, particularly within the Shoalhaven and Hawkesbury–Nepean catchments, experienced their lowest soil moisture on record between July and October, reaching the greatest extent in September.
- Following above-average rainfall in November and December, soil moisture rebounded in December, particularly across the south, where rainfall anomalies were more pronounced.
- In response to the variation in rainfall during summer, above-average soil moisture became most widespread in the southern half of the region. However, on the back of below-average rainfall in March, soil moisture regressed across the region, with below-average conditions becoming prominent in the north.
- As a result of the region's tenth-wettest April on record, soil moisture returned to above average across much of the region and remained predominantly above average until the end of the reporting period.
- More information on the soil moisture conditions across the Sydney region during the 2023–24 reporting year is available on the Australian Water Outlook.
Streamflow responses
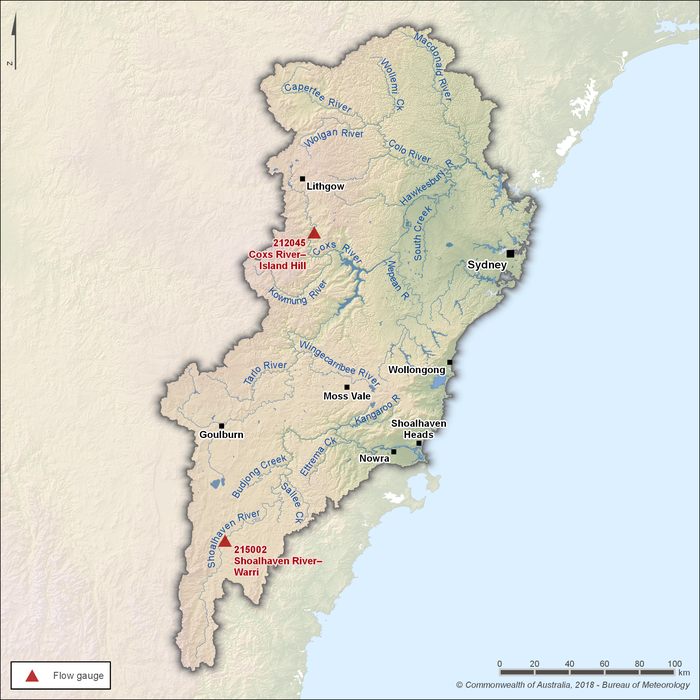
Figure C5 Key flow gauging stations along the main rivers within the Sydney region
- There are three main river systems within the Sydney region: the Hawkesbury–Nepean River, the Shoalhaven River, and the Illawarra and metropolitan Sydney catchments.
- Of these, the Hawkesbury–Nepean and Shoalhaven river systems are the two primary sources of streamflow in the region.
- Two gauging stations—Shoalhaven River at Warri (215002) and Coxs River at Island Hill (212045)—are used to represent seasonal flow patterns in the rivers. Streamflows upstream of these sites are unregulated and not influenced by diversions for consumptive use.
- The Coxs River flows into the region's largest storage—Warragamba Reservoir (Lake Burragorang).
Figure C6 Total monthly flow for major rivers in the Sydney region during the 2023-24 year compared with the average and percentiles
- Total annual flows in the region's major rivers were above average during 2023–24, reflecting the region's fourth consecutive year of above-average rainfall.
- Flows in the Shoalhaven River at Warri (Station 215002), the region's largest river by total volume, recorded 320 GL during the reporting year, 27% above the long-term average of 252 GL.
- Due to a lack of significant rainfall from July to October, streamflows were well below the long-term average. During this period, flows in the Shoalhaven River at Warri were 82% below average, while flows in the Coxs River at Island Hill (Station 212045) were 70% below average.
- Streamflows in the Shoalhaven and Coxs rivers peaked above the 90th percentile during December and January, following above-average rainfall in late spring and early summer.
- Although rainfall was above average in February, streamflows dropped below average across both sites at the start of autumn, following March rainfall that was roughly half of the monthly average.
- After the region's tenth-wettest April on record, streamflows rose in April, with the Coxs River at Island Hill peaking above the 90th percentile. Streamflows at both sites remained well above average through to the end of June.