


Sydney: Supporting information
For the water account period 1 July 2023 to 30 June 2024
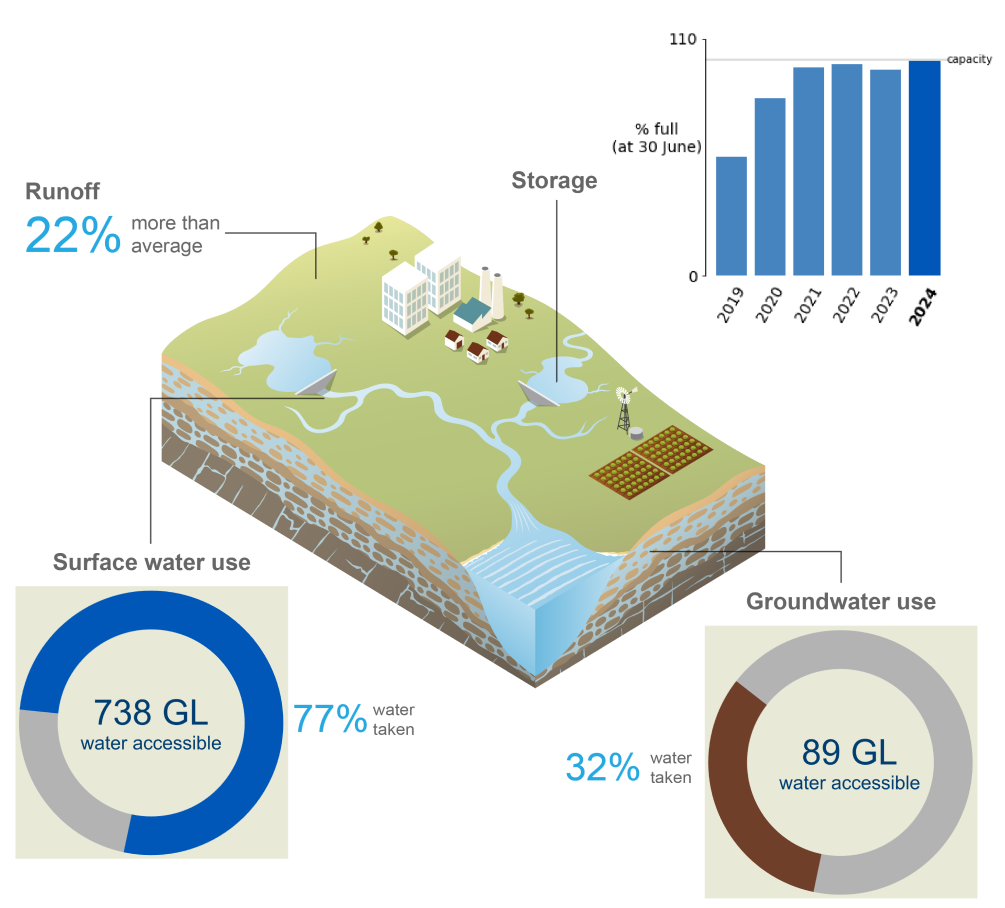
- Annual rainfall in the Sydney region during 2023-24 was above average for the fourth consecutive year, contributing to increased runoff and surface water inflows into the region's surface water storages.
- Total storage volume in the Sydney region increased by 4.5% during the reporting year, finishing at 99.8% full on 30 June 2024—the highest end-of-year storage volume since 1988.
- Approximately 72% of surface water and groundwater resources in the Sydney region were taken, primarily for diversions to the urban system.
For further information on the region's water accounting statements scroll down this page or click on the links below:
Water assets
")
- Total water assets in the Sydney region on 30 June 2024 were 2,772 GL, of which, more than 99% was water held in surface water storages. The remaining amount was water held in rivers.
- There are no groundwater or urban water assets in the Sydney region.
- A detailed breakdown of water assets in the Sydney region is available in the Statement of Water Assets and Water Liabilities.
| Surface water | 2024 | 2023 | 2022 | 2021 | 2020 | 2019 |
| Avon | 146,372 | 122,075 | 144,168 | 140,529 | 124,100 | 76,913 |
| Cataract | 97,055 | 66,107 | 83,657 | 78,668 | 69,463 | 28,039 |
| Cordeaux | 91,564 | 77,857 | 92,049 | 92,603 | 69,184 | 38,291 |
| Fitzroy Falls | 4,826 | 6,980 | 6,667 | 9,815 | 8,256 | 8,158 |
| Greaves Creek | 299 | 188 | 299 | 259 | 211 | 132 |
| Lake Medlow | 332 | 173 | 103 | 123 | 131 | 140 |
| Lower Cascade | 307 | 248 | 298 | 235 | 189 | 216 |
| Middle Cascade | 168 | 105 | 167 | 167 | 112 | 112 |
| Nepean | 68,022 | 53,294 | 65,775 | 63,634 | 44,298 | 31,328 |
| Prospect | 30,323 | 30,680 | 30,649 | 32,337 | 29,295 | 31,366 |
| Tallowa | 84,900 | 82,018 | 84,661 | 85,342 | 87,541 | 82,864 |
| Upper Cascade | 1,725 | 1,754 | 1,328 | 1,642 | 1,738 | 1,207 |
| Warragamba | 2,028,829 | 1,992,683 | 2,005,517 | 1,974,580 | 1,666,906 | 1,077,055 |
| Wingecarribee | 25,519 | 22,615 | 20,119 | 20,934 | 19,728 | 13,796 |
| Woronora | 72,644 | 70,675 | 72,123 | 60,125 | 45,019 | 30,793 |
| Accessible total | 2,652,885 | 2,527,452 | 2,607,580 | 2,560,993 | 2,166,171 | 1,420,410 |
| Dead storage | 108,430 | 108,430 | 108,430 | 108,430 | 108,430 | 108,430 |
| Total storage | 2,761,315 | 2,635,882 | 2,716,010 | 2,669,423 | 2,274,601 | 1,528,840 |
| Total capacity | 2,766,470 | 2,766,470 | 2,766,470 | 2,766,470 | 2,766,470 | 2,766,470 |
| % full | 99.8% | 95.3% | 98.2% | 96.5% | 82.2% | 55.3% |
- The total storage volume in the Sydney region increased by 4.5% during 2023–24, finishing at 99.8% full on 30 June 2024—the highest end-of-year volume since 1988.
- Lake Burragorang (formed by Warragamba Reservoir) holds approximately 75% of the Sydney region's total surface water storage.
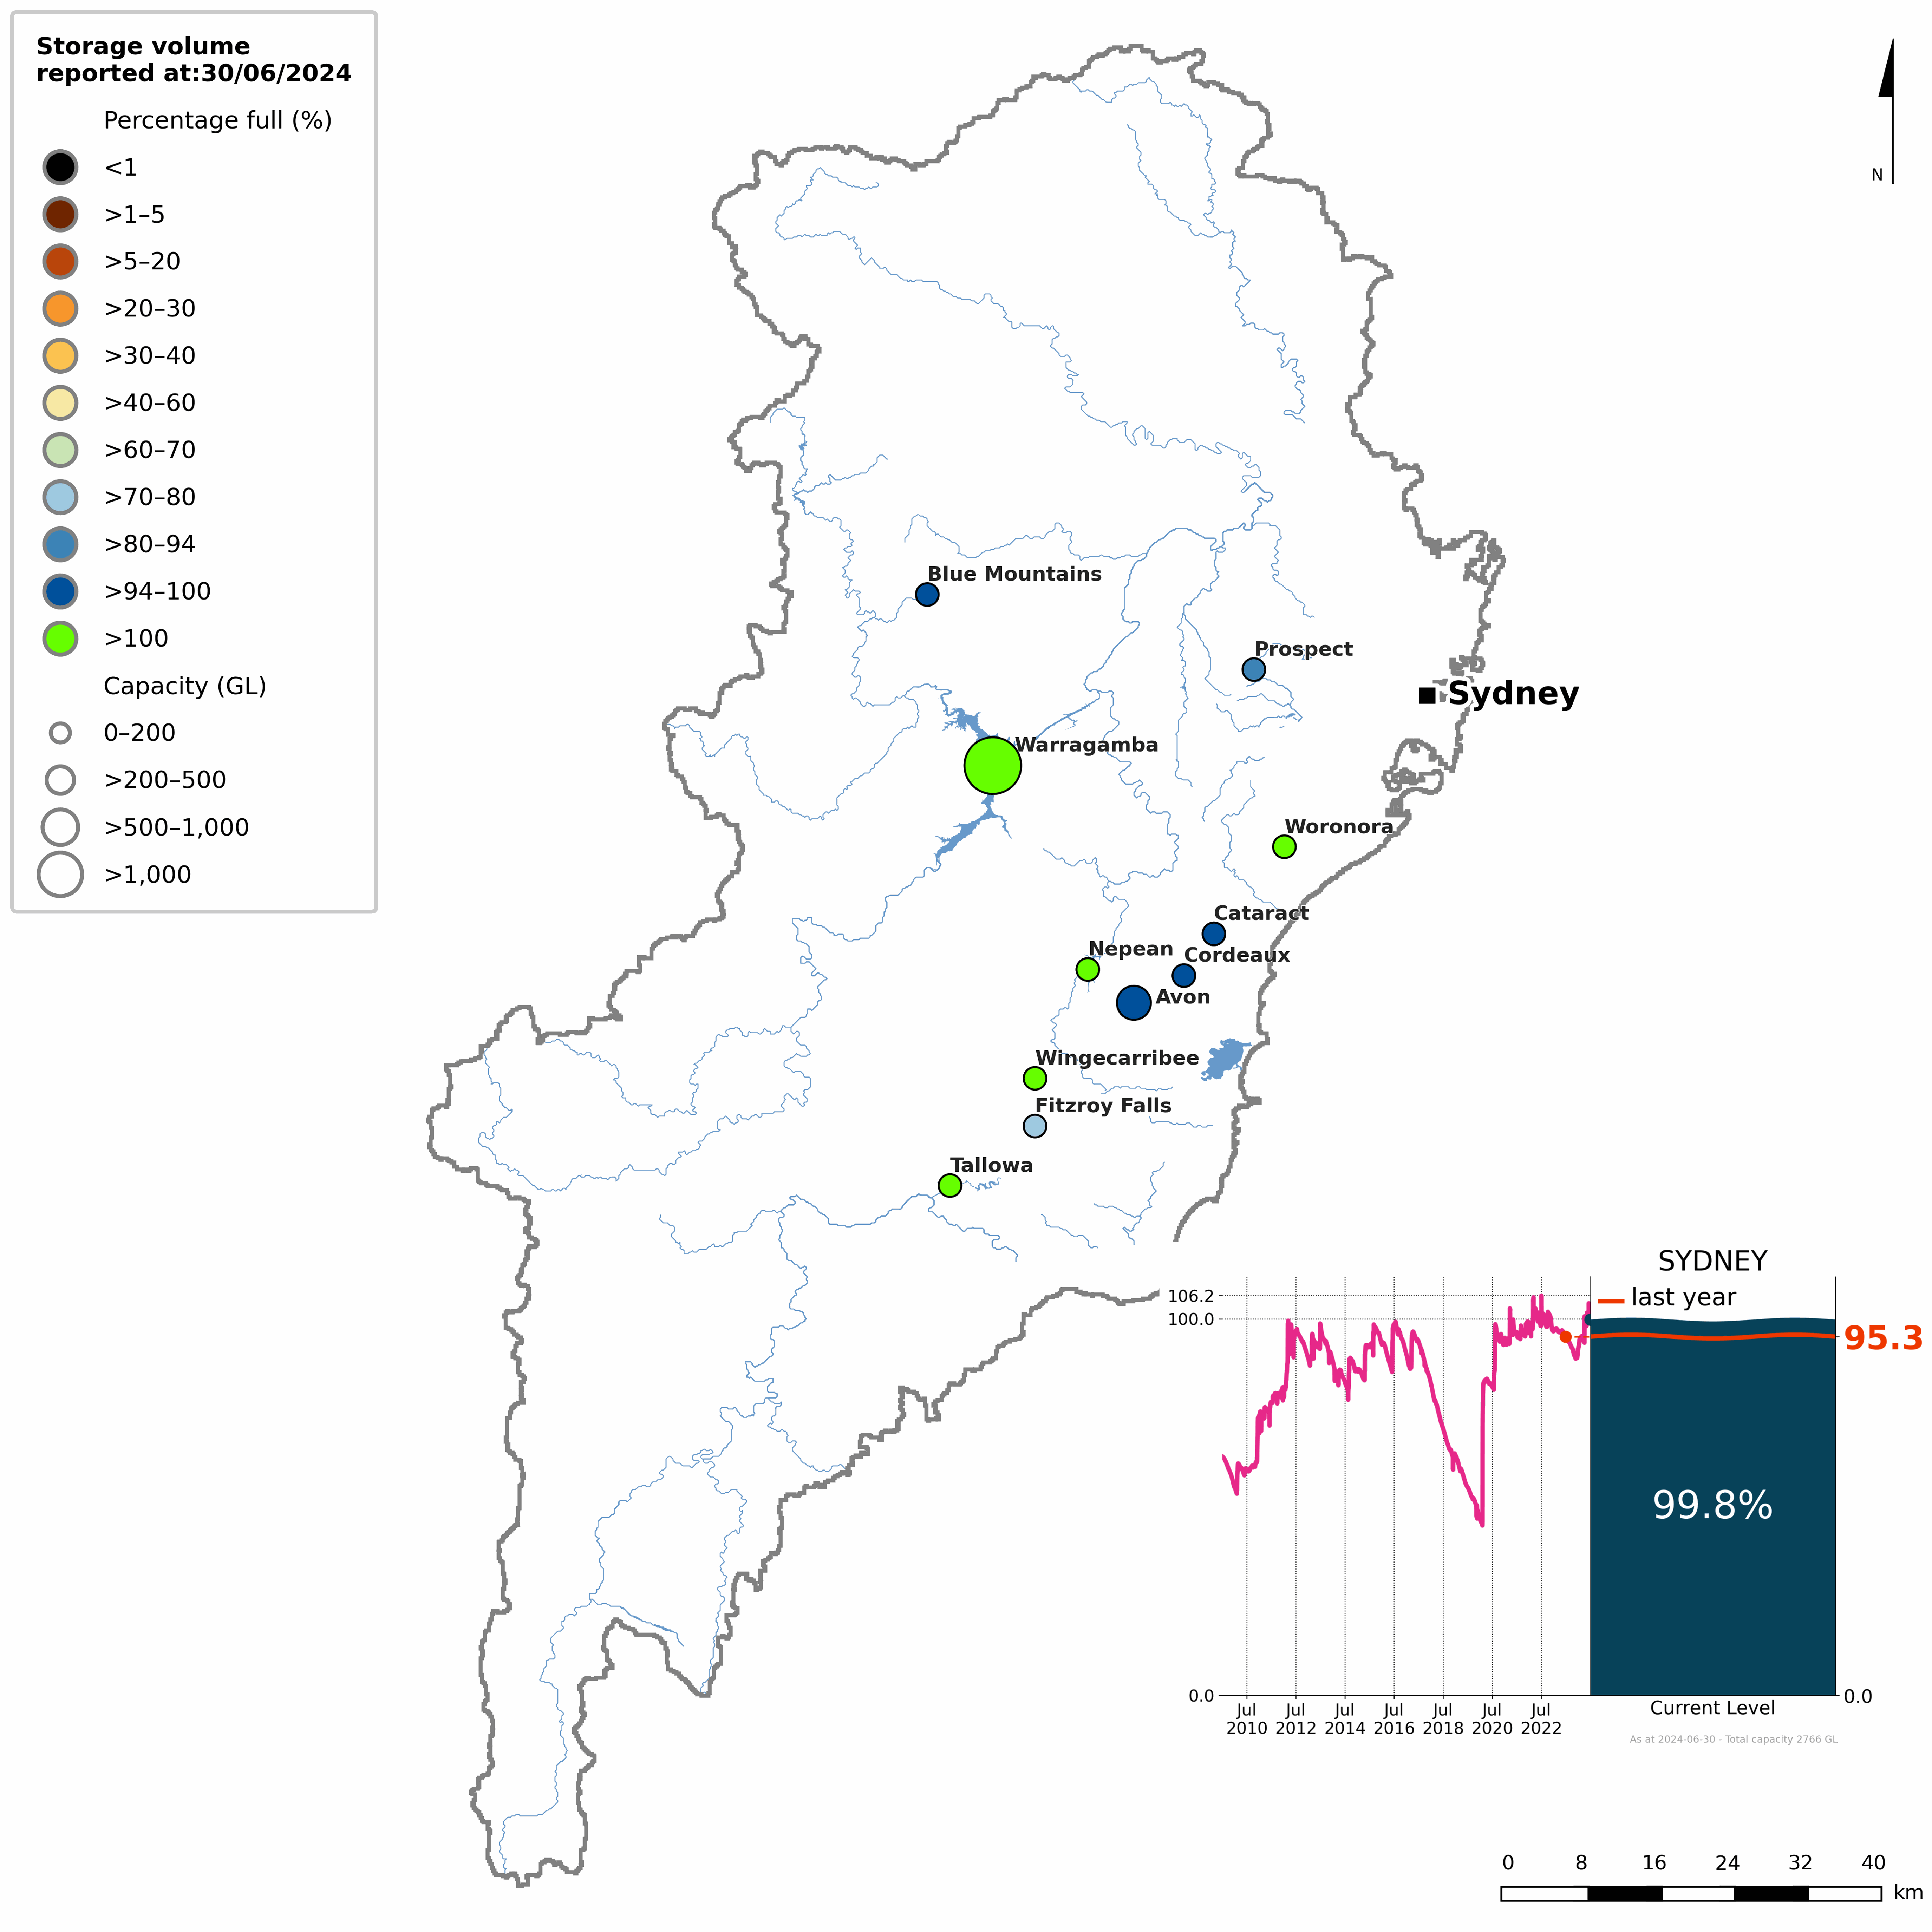
Figure S2 Percentage-full volume on 30 June 2024 for each storage and total storage volume from 2009-2024 (inset)
- The total storage volume in the Sydney region began the 2023–24 year at 95.3% full.
- Due to a lack of rain-bearing systems from July to October, storages gradually dropped to approximately 89% by early November.
- Following above-average rainfall in November and December, storages across the Sydney region steadily increased to around 95% by early February.
- During the end of May, storages peaked at 105%—the highest volume for the reporting year—in response to the Sydney region's twentieth-wettest autumn on record.
- By 30 June 2024, the total storage volume in the Sydney region was 99.8%, with several storages exceeding 100% of their full supply capacity. This was the highest end-of-year storage volume since 1988.
- More detailed information on individual storages in the Sydney region is available on the Bureau of Meteorology's Water Information Dashboard.
Water liabilities
")
- Water liabilities in the Sydney region refer to the volume of allocation remaining on licence entitlements at the end of the reporting year (30 June).
- As carryover cannot be quantified in the Sydney region, any unused portion of allocation is assumed to be forfeited. Consequently, the closing balance for both surface water and groundwater is 0 ML in the Sydney region.
- A more detailed description of water allocations in the Sydney region is provided in the Water use section.
| Description | 2024 | 2023 | 2022 | 2021 | 2020 | 2019 | |
| Opening balance at 01 July | 0 | 0 | 0 | 0 | 0 | 0 | |
| add | Allocation | 178,644 | 179,249 | 179,393 | 159,390 | 159,389 | 159,389 |
| less | Allocated diversion | 6,806 | 3,778 | 2,796 | 2,146 | 8,260 | 13,370 |
| less | Adjustment and forfeiture | 171,837 | 175,471 | 176,597 | 157,244 | 151,129 | 146,019 |
| Closing balance at 30 June | 0 | 0 | 0 | 0 | 0 | 0 | |
| Description | 2024 | 2023 | 2022 | 2021 | 2020 | 2019 | |
| Opening balance at 01 July | 0 | 0 | 0 | 0 | 0 | 0 | |
| add | Allocation | 89,193 | 87,012 | 86,158 | 84,534 | 83,623 | 76,954 |
| less | Allocated diversion | 28,800 | 24,241 | 24,026 | 16,918 | 19,914 | 3,409 |
| less | Adjustment and forfeiture | 60,393 | 62,771 | 62,132 | 67,616 | 63,709 | 73,545 |
| Closing balance at 30 June | 0 | 0 | 0 | 0 | 0 | 0 | |
- Surface water and groundwater allocations in the Sydney region were similar to the previous few years, but were slightly higher than average.
- In total, surface water allocations in the Sydney region were 179 GL, while groundwater allocations were 89 GL.
- At the end of the reporting period, approximately 96% (172 GL) of surface water allocations and 68% (60 GL) of groundwater allocations were forfeited on 30 June, primarily due to increased water availability across the Sydney region reducing demand. No allocated volume was carried over into the 2024–25 water year.
Water flows
")
- Total water inflows into the Sydney region during 2023–24 were 10,287 GL, approximately 28% lower than the previous year.
- Surface water inflows contributed 71% (7,294 GL) of total water inflows, primarily from runoff, accounting for 96% of the total surface water inflows.
- Groundwater inflows contributed 18% (1,855 GL) of total water inflows, with recharge from surface water making up 97% of the total groundwater inflows.
- Urban water inflows contributed 11% (1,138 GL) of total water inflows, in which wastewater collected and diversion of surface water attributed for 97% of the total urban water inflows.
- Total water outflows from the Sydney region during 2023–24 were 9,428 GL, approximately 34% lower than the previous year.
- Surface water outflows contributed 88% (8,284 GL) of total water outflows, mostly from outflow and recharge to groundwater comprising 87% of the total surface water outflows.
- Groundwater outflows contributed less than 1% (29 GL) of total water outflows, entirely from allocated extraction to individual users.
- Urban water outflows contributed 12% (1,115 GL) of total water outflows, largely from discharge to sea and supply of drinking water to residential customers constituting for 73% of the total urban water outflows.
- A detailed breakdown of inflows and outflows for the Sydney region is available in the Statement of Changes in Water Assets and Water Liabilities.
Water availability
| Surface water | 2024 | 2023 | 2022 | 2021 | 2020 | 2019 |
| Water availability | 9,659,150 | 13,128,704 | 18,931,361 | 13,305,195 | 7,584,575 | 4,002,021 |
| Water accessible | 738,145 | 676,817 | 715,356 | 702,133 | 659,250 | 754,928 |
| Water taken | 566,308 | 501,346 | 538,759 | 544,889 | 508,121 | 608,909 |
| % water accessible taken | 77% | 74% | 75% | 78% | 77% | 81% |
- Surface water availability in the Sydney region during 2023–24 was above average for the fifth consecutive year—33% above the long-term average—but 26% lower than the previous year.
- Changes in water availability across the Sydney region are heavily influenced by runoff across the region. Generally, when runoff increases or decreases, water availability responds in a similar way.
- Despite the decrease in water availability, surface water accessible for take was the highest since 2018–19 in the Sydney region, primarily due to increased diversions to the urban system, but remained close to the average of 725 GL.
- Likewise, water taken from surface water resources in the Sydney region were the highest since 2018–19, but remained slightly below the average of 573 GL.
- This increase in water accessible and water taken, despite the decrease in water availability, may reflect the prolonged period of high water availability in recent years easing pressure on water use across the Sydney region.
- Overall, approximately 77% of the surface water accessible for take in the Sydney region was taken, primarily for diversions to the urban system.
Water use
")
Consumptive use
| Surface water | 2024 | 2023 | 2022 | 2021 | 2020 | 2019 |
| Individual users | 6,806 | 3,778 | 2,796 | 2,146 | 8,260 | 13,370 |
| Statutory rights | 38,166 | 32,256 | 32,256 | 32,256 | 32,256 | 32,256 |
| Urban system | 521,335 | 465,312 | 503,707 | 510,487 | 467,605 | 563,283 |
| Total | 566,308 | 501,346 | 538,759 | 544,889 | 508,121 | 608,909 |
| Groundwater | 2024 | 2023 | 2022 | 2021 | 2020 | 2019 |
| Individual users | 28,800 | 24,241 | 24,026 | 16,918 | 19,914 | 3,409 |
| Total | 28,800 | 24,241 | 24,026 | 16,918 | 19,914 | 3,409 |
- A total of 595 GL was taken from surface water and groundwater resources for consumptive use in the Sydney region during 2023–24, 13% more than last year, primarily due to increased surface water diversions to the urban system.
- Surface water diversions across the Sydney region were 566 GL, around 13% higher than the previous year.
- Approximately 92% of surface water diversions in the Sydney region were for urban system supply, almost entirely to Sydney Water. Inter-region users with statutory rights accounted for just under 7% of diversions, while the remaining amount of surface water diverted was taken by individual users (including both allocated and non-allocated diversions).
- Groundwater extractions across the Sydney region were 29 GL, an increase of 19% compared to last year, all of which was extracted by individual users. This marked the highest volume extracted since 2018–19.
Allocations and diversions
| Surface water | 2024 | 2023 | 2022 | 2021 | 2020 | 2019 |
| Individual users | ||||||
| Carryover | 0 | 0 | 0 | 0 | 0 | 0 |
| Allocated announcements | 178,644 | 179,249 | 179,393 | 159,390 | 159,389 | 159,389 |
| Allocated diversions | 6,806 | 3,778 | 2,796 | 2,146 | 8,260 | 13,370 |
| % used | 4% | 2% | 2% | 1% | 5% | 8% |
- Total surface water allocations in the Sydney region during 2023–24 were 179 GL, of which only 4% was taken, all by individual users.
- Allocations for individual users in the Sydney region were slightly lower compared to last year, but 4% above average.
- Although total diversions across the Sydney region were 80% higher than the previous year, they remained 66% below average due to prolonged wet conditions across the region reducing demand for water.
| Groundwater | 2024 | 2023 | 2022 | 2021 | 2020 | 2019 |
| Individual users | ||||||
| Carryover | 0 | 0 | 0 | 0 | 0 | 0 |
| Allocated announcements | 89,193 | 87,012 | 86,158 | 84,534 | 83,623 | 76,954 |
| Allocated extractions | 28,800 | 24,241 | 24,026 | 16,918 | 19,914 | 3,409 |
| % used | 32% | 28% | 28% | 20% | 24% | 4% |
- Total groundwater allocations in the Sydney region during 2023–24 were 89 GL, with 32% of the allocated volume extracted, all for private and commercial use.
- Extractions for individual users across the Sydney region were 19% higher than last year, and the highest volume recorded in the past six years.
Urban supply system
| Water sources | 2024 | 2023 | 2022 | 2021 | 2020 | 2019 |
| Surface water | 517,654 | 461,631 | 500,026 | 509,116 | 464,608 | 556,608 |
| Inter-region | 3,681 | 3,681 | 3,681 | 1,371 | 2,997 | 6,675 |
| Desalinated water | 35,216 | 67,996 | 22,480 | 19,609 | 71,147 | 7,793 |
| Total urban water supplied | 556,551 | 533,308 | 526,187 | 530,096 | 538,752 | 571,076 |
- A total of 557 GL of water was sourced for the urban supply system in the Sydney region, slightly more than the previous year, and close to the average of 545 GL.
- Approximately 93% of the total urban supply in the Sydney region came from surface water storages, which was 12% more than last year.
- Desalinated water contributed around 6% of the total urban supply in the Sydney region, while inter-region inflows accounted for the remainder of water supplied to the urban system.
- The contribution of desalinated water in the Sydney region was nearly half that of the previous year, and 25% below the average for the years in which the plant was operational.
- For more information on the use of desalinated water within the Sydney region, please visit the Sydney Desalination Plant website.