


National Water Account
Northern Australia regions: Overview
- Rainfall was above-average across south and east northern Australia and below average in the north of the Northern Territory.
- Storages in the Burdekin region reached to their highest levels since 2018–19.
- Water taken for consumptive use reduced in all regions compared to last year.
Climate and Water
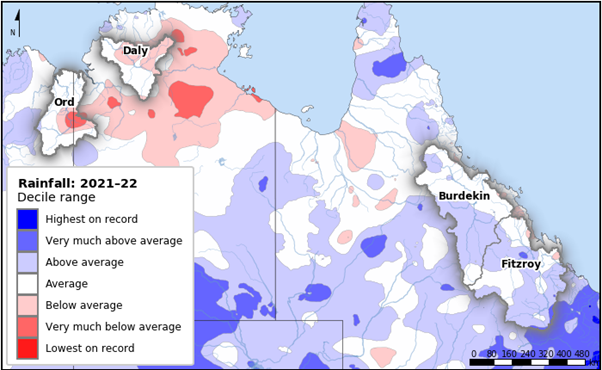
Rainfall across northern Australia during July 2021–June 2022 compared with historical records (1900–2021)
- Below average annual rainfall occurred over much the Top End, including the Ord and Daly regions. Further south in the Burdekin and Fitzroy regions, 2021-2022 rainfall was mostly above average.
- La Nina established in the Pacific Ocean in late Spring and through to April, while an Indian Ocean Dipole was active between July and December - both drivers tend to increase Winter and Spring rainfall over these areas.
- The Burdekin and Fitzroy regions experienced above average totals due to heavy rainfall during the months of November and May (in the highest 10% on record).
- Despite the significant rainfall brought by Tropical Cyclones Seth and Tiffany early in the wet season, the lack of monsoonal activity, particularly during February and March, resulted in below average rainfall in the Ord and Daly regions.
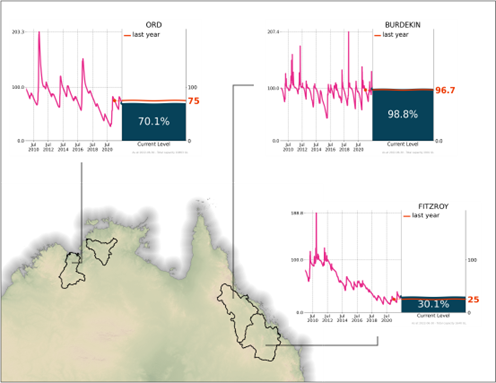
Percentage-full volume during 1 July 2010–30 June 2022 for northern Australian regions storages
- End-of-year storage volumes in the Burdekin and Fitzroy regions increased from last year. The Ord region recorded a decrease in end-of-year storage volumes.
- The Fitzroy region had the highest end-of-year storage volume since 2017-18.
- In the Daly region, the dry conditions resulted in a return to an annual decrease in aquifer storage volumes.
Water sources and supply
| Surface water | Groundwater | Total | |
| Burdekin | 697,437 | 106,635 | 804,072 |
| Daly | 9,381 | 50,594 | 59,975 |
| Fitzroy | 607,850 | 105,049 | 712,899 |
| Ord | 248,889 | 6,171 | 255,060 |
| Total | 1,563,557 | 268,449 | 1,832,006 |
| % | 85% | 15% |
- Total water sourced by the northern regions was 1,832 GL.
- Surface water made up 85% of total water supply and was the predominant source of water in all northern regions except for Daly.
- Total water supplied was higher than the previous years but not as high as the 2019–20 levels.
- Water supplied in the Fitzroy region was up 20% on last year which may be influenced by the increase in water availability.
| Agriculture | Cultural | Industrial | Irrigation | Mining | Stock & Domestic | Urban | Other | Total | |
| Burdekin | 0 | 0 | 17,659 | 604,289 | 556 | 29,074 | 1,977 | 150,517 | 804,072 |
| Daly | 45,443 | 1,376 | 415 | 0 | 86 | 0 | 3,006 | 9,649 | 59,975 |
| Fitzroy | 180,387 | 0 | 76,677 | 201,969 | 16,292 | 1,625 | 12,852 | 223,097 | 712,899 |
| Ord | 29,305 | 0 | 1,182 | 214,665 | 5,325 | 420 | 3,400 | 763 | 255,060 |
| Total | 255,135 | 1,376 | 95,933 | 1,020,923 | 22,259 | 31,119 | 21,235 | 384,026 | 1,832,006 |
| % | 14% | >1% | 5% | 56% | 1% | 2% | 1% | 21% |
- 56% of total water supply was used for irrigation users while 21% was for others users and 14% for agriculture.
- In the Daly region, where there are no irrigation schemes, most of the water was sourced from the Tindall Limestone and Oolloo Dolostone aquifers for agricultural purposes.
- In these sparsely populated areas, town water supply made up only around 1% of water use.