


Murray–Darling Basin region
Overview: 2013–14
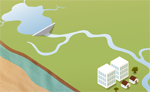
The Murray–Darling Basin (MDB) region covers an area of over 1 million km2, which is equal to 14% of mainland Australia. This includes 75% of New South Wales, more than 50% of Victoria, large portions of Queensland and South Australia, and all of the Australian Capital Territory. The region is defined by the catchment areas of Australia's two longest rivers: the Darling River (2,740 km) and the River Murray (2,520 km). The region has a population of over 2 million, and irrigated agriculture is a major industry.
In the 2013–14 year, there were distinct differences in the rainfall pattern in the northern section (the Northern Basin) and the southern section (the Southern Basin) of the MDB region. Rainfall in the Northern Basin was well below average, with some areas experiencing their lowest rainfall on record. It was the Northern Basin's second consecutive year of below average rainfall, resulting in drought in parts of Queensland and New South Wales. Conversely, the Southern Basin experienced generally average rainfall conditions.
Successive below average rainfall conditions for the MDB region contributed to decreased inflows into the storages, resulting in a 12% reduction in storage volume from 69% of capacity at 30 June 2013 to 57% at 30 June 2014. As a result of the decrease in surface water availability in the region, surface water diversions decreased during the 2013–14 year; an increase in groundwater availability resulted in increased extractions during the 2013–14 year.
Closing net water assets for the MDB region were 16,921,345 ML at the end of the 2013–14 year compared with 19,001,937 ML at the end of the 2012–13 year. For more information on the region's water assets, refer to Water accounting statements.
The key water account information for the MDB region during the 2013–14 year is presented in the following table. Information on the uncertainty associated with the volumes presented is provided in the relevant sections of the account.
Contextual information
 | 2013–14 | 2012–13 | Long–term average (1900–2014) |
| Rainfall: 388 mm | Rainfall: 377 mm | Rainfall: 470 mm | |
| For more detail on the MDB climate, refer to Climate overview. | |||
 | River Murray at Doctors Point (Albury) | Darling River at Bourke | Ovens River at Peechelba |
| below mean annual flow | well below mean annual flow | above mean annual flow | |
| For more detail on streamflow in the MDB region, refer to Water overview. | |||
 | 2013–14 | 2012–131 | |
| Total water assets as at 30 June (ML) | 19,947,757 | 23,350,732 | |
| Total water liabilities as at 30 June (ML) | 3,026,412 | 4,348,795 | |
| Change in net water assets (ML) | (2,080,592) | (2,970,036) | |
| Closing net water assets (ML) | 16,921,345 | 19,001,937 | |
| For more detail on water assets and water liabilities, refer to Water accounting statements. | |||
1These volumes vary from those published in the 2013 Account. Please refer to Water accounting policies for more details.
Notes: supporting information
 | 30 June 2014 | 30 June 2013 | |||
| Total capacity | Volume | % of capacity | Volume | % of capacity | |
| 23,203,628 ML | 13,156,647 ML | 57% | 16,021,763 ML | 69% | |
| For more detail on surface water in the MDB region, refer to Surface water. | |||||
 | Total water abstracted | ||
| 2013–14 | 2012–13 | Recent activity | |
| Surface water: 8,420,121 ML1 | Surface water: 11,547,686 ML | Surface water diversions decreased and groundwater extractions increased. | |
Groundwater: Environmental surface water: Environmental groundwater: | Groundwater: Environmental surface water: | ||
| For more detail on the water abstraction in the MDB region, refer to Surface water store and Groundwater store. | |||
1The volume includes basic right diversions and excludes change in storage volumes in Waranga Basin (see downloadable table for details). Surface water non-environmental diversion volumes for South Australia were not available at time of account publication.
2Surface water environmental diversion volumes for South Australia were not available at time of account publication.
 | Total water supplied | ||
| 2013–14 | 2012–13 | Recent activity | |
| 370,117 ML | 422,571 ML | Abstraction decreased for urban water supply. | |
| For more detail on the urban water supplied in the MDB region, refer to Surface water and Groundwater store. | |||
 | Total water supplied | ||
| 2013–14 | 2012–13 | Recent activity | |
Surface water: Groundwater: | Surface water: Groundwater: | Surface water use decreased. | |
| For more detail on the irrigation water supply in the MDB region, refer to Irrigation note. | |||
1Surface water diversion volumes for South Australia were not available at the time of account publication.
 | Volume traded | ||
| 2013–14 | 2012–13 | Recent activity | |
| Entitlement: 1,957,514 ML | Entitlement: 961,334 ML | Increased entitlement trade and decreased allocation trade. | |
Allocation: | Allocation: 5,985,629 ML | ||
| For more detail on surface water trade in the MDB region, refer to Water market activity. | |||