This page provides details about the region, its water resources, land use and water-related infrastructure
Area: 4202 km²
Population: 400,001 in 2010, consisting of total Australian Capital Territory (ACT) population plus Queanbeyan population (ABS 2011a)
The location of the Canberra region in the context of Australia is shown in Figure P1. The rivers of the Canberra region form part of the Murray-Darling Basin, the location of the Canberra region in the context of the Murray-Darling Basin is shown in Figure P2.
The Canberra region boundary is shown in Figure P3 and shows the extension of the boundaries of the Canberra region beyond the ACT into parts of New South Wales (NSW). It was necessary to extend the Canberra region boundary beyond the ACT boundaries to more accurately reflect the extent of the water supply system of Queanbeyan and the ACT. The ACT and NSW Governments administer the part of the region that is within their respective jurisdictions. The headwaters of the Upper Murrumbidgee catchment were not included in this account as the majority of the rainfall run-off from this region is diverted to the Snowy River scheme in NSW.

Figure P1. Location map of the Canberra region within Australia
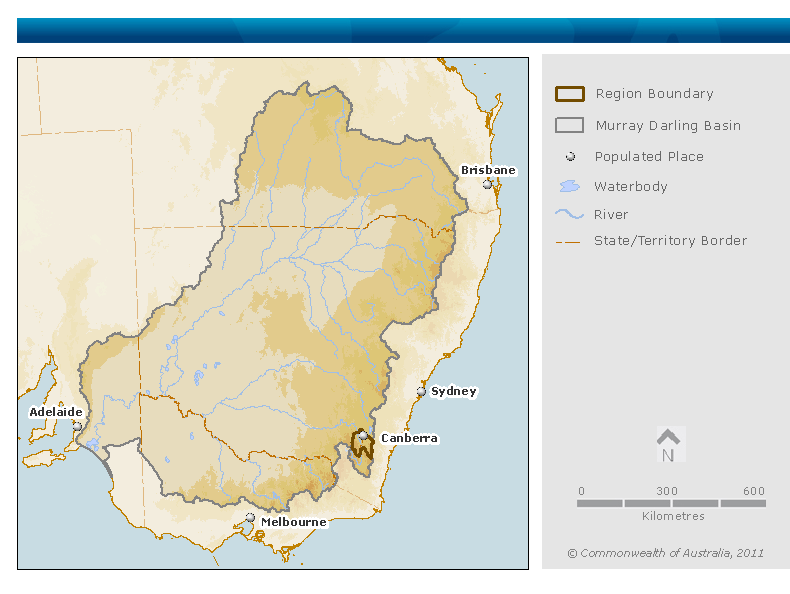
Figure P2. Location map of the Canberra region in the context of the Murray-Darling Basin
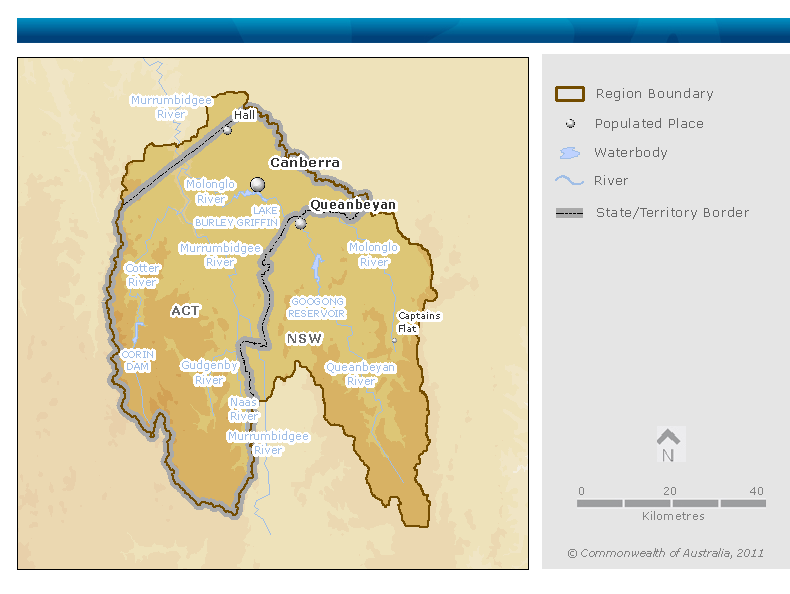
Figure P3. Contextual map of the Canberra region
The Canberra region includes:
The Canberra region in the National Water Account 2010 (the 2010 Account) reflects the water supply catchments, the water assets and water management plans for the ACT and parts of NSW.
The following elements are excluded from the region:
The Canberra region is characterised by forested mountains in the south and west of the region, and plains to the north of the region (ABS 2007).
The major urban centres in the region, along with their population (ABS 2011a), are:
Figure P4 shows that urban land use is concentrated within the Canberra and Queanbeyan metropolitan areas of the region. Land use classifications were derived from the National Scale Land Use Mapping Technical Specifications.
In addition to urban, major land uses in the Canberra region include conservation areas, natural environment and grazing. Conservation areas and natural environment are extensive throughout the Canberra region and particularly dominant through the forested mountains in the south and west of the region. Grazing occurs across much of the plains within the region (Figure P4).
Table P1 shows the percentage areas of each major land use within the Canberra region (ABRS 2010).
Table P1. Land use in the Canberra region
|
Land use |
Area (km2) |
Area % of total |
|---|---|---|
|
Conservation and natural environments |
1975 |
47 |
|
Grazing |
1241 |
29 |
|
Forestry |
204 |
5 |
|
Dryland agriculture |
279 |
7 |
|
Irrigated agriculture |
2 |
<1 |
|
Urban |
450 |
11 |
|
Other intensive uses |
2 |
<1 |
|
Mining |
2 |
<1 |
|
Water |
47 |
1 |
|
TOTAL |
4202 |
100 |
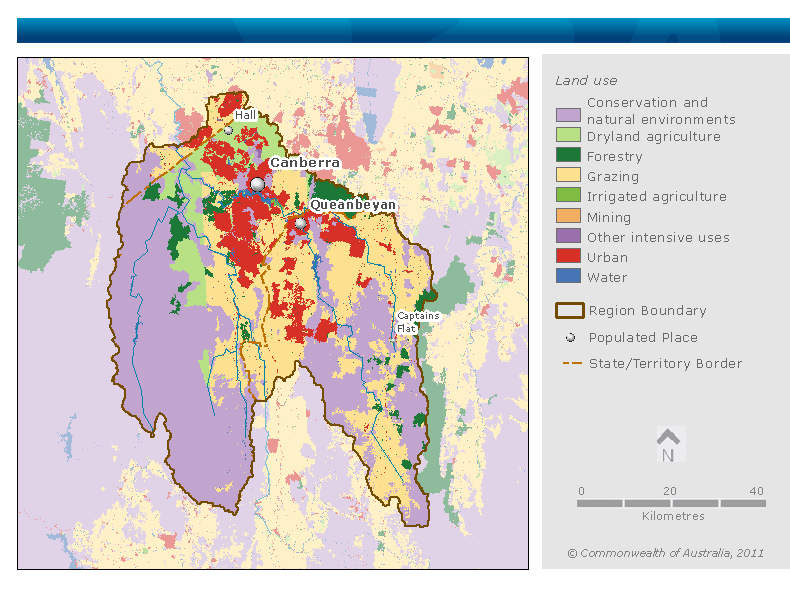
Figure P4. Map of land use in the Canberra region
The Canberra region contains the Ginini Flats Wetland Complex Ramsar-listed wetland, located in the Namadgi National Park. It consists of a series of interconnected flats known as the Ginini Flats and the Cheyenne Flats.
The Canberra region also contains 12 nationally important wetlands, listed in the Directory of Important Wetlands in Australia.
In the Canberra region, most water used is surface water. In recent years, prolonged low streamflow conditions led to an increase in the demand for groundwater. However, use of groundwater is still low in comparison to surface water. Recycled wastewater is also used in the region.
The Water Resources Determination 2007 of the Water Resources Act 2007 (ACT) set an allowable surface water and groundwater abstraction limit of 273 gigalitres (GL). The current level of abstraction in the ACT is well under this limit. However, future development will be limited by the Murray-Darling Basin cap (refer to Water rights: Operating rules and constraints: Murray-Darling Basin cap).
The water resource in the NSW portion of the Canberra region is already well-developed under the current long-term cap for the Murray-Darling Basin (refer to Water rights: Operating rules and constraints: Murray-Darling Basin cap).
The Murrumbidgee is the major river system which flows through the Canberra region within the Murray-Darling Basin. All rivers and creeks in the ACT drain into the Murrumbidgee River (NWC 2010a). The three main rivers which flow through the Canberra region into the Murrumbidgee are the Molonglo, Cotter and Queanbeyan Rivers.
Figure P5 shows mean monthly flow in the three main rivers of the Canberra region along with rainfall. While there is no real seasonality in the rainfall of the region, streamflow in these three main rivers does vary seasonally, with flows being lowest in autumn and highest in winter and spring. The average rainfall for the Canberra region is similar from month to month, however, the evaporation is much higher in summer than winter months. This causes the catchments to dry out during summer. In autumn and winter, the catchments typically become saturated, leading to high run-off in spring. Streamflow in the Cotter River in spring (August to October) is also influenced by snowmelt and sphagnum moss bog release.
Figure P6 shows the locations of the flow gauging stations (and their station number) used to generate the mean monthly flow data along these main rivers. Flow data collected at these stations were used to represent the seasonal flow patterns along these rivers in Figure P5.

Figure P5. Graph of mean monthly flows along the Molonglo, Cotter and Queanbeyan Rivers and mean monthly rainfall for the Canberra region
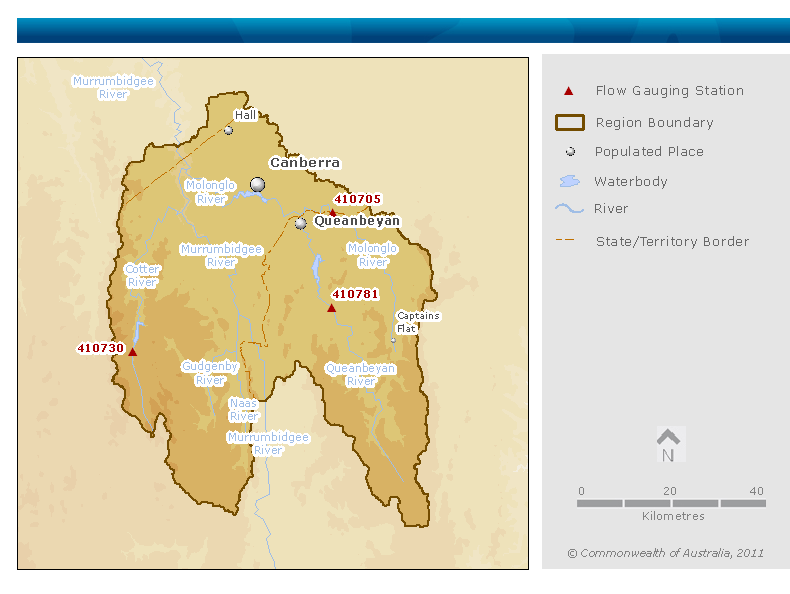
Figure P6. Map of key flow gauging stations along the main rivers in the Canberra region
The Canberra region contains a number of major storages used for urban water supply and others that are used for pollution control and recreational purposes (ANRA 2009). These storages are listed in Tables P2 and P3, and shown in Figure P7.
Table P2. Major storages in the Canberra region
|
Major storage |
Total storage capacity (ML) |
Dead storage capacity (ML) |
Purpose |
|---|---|---|---|
|
Corin Reservoir |
70,787 |
110 |
Urban supply |
|
Cotter Reservoir |
3847 |
9 |
Urban supply |
|
Bendora Reservoir |
11,446 |
96 |
Urban supply |
|
Googong Reservoir |
119,409 |
1674 |
Urban supply |
|
Total |
205,489 |
1889 |
|
Table P3. Other major storages in the Canberra region
|
Major storage |
Total storage capacity (ML) |
Purpose |
|---|---|---|
|
Lake Ginninderra |
3700 |
Pollution control Landscape and recreation |
|
Lake Tuggeranong |
1800 |
Pollution control Landscape and recreation |
|
Lake Burley Griffin |
33,000 |
Landscape and recreation |
|
Total |
38,500 |
|
The urban water supply network for Canberra and Queanbeyan consists of:
The layout of the supply system is shown in Figure P7. Water from the connected surface water stores in the Canberra region is supplied to 45 services reservoirs in the region’s water supply system (ActewAGL 2011). Fyshwick and Queanbeyan WWTP are also shown in Figure P7.
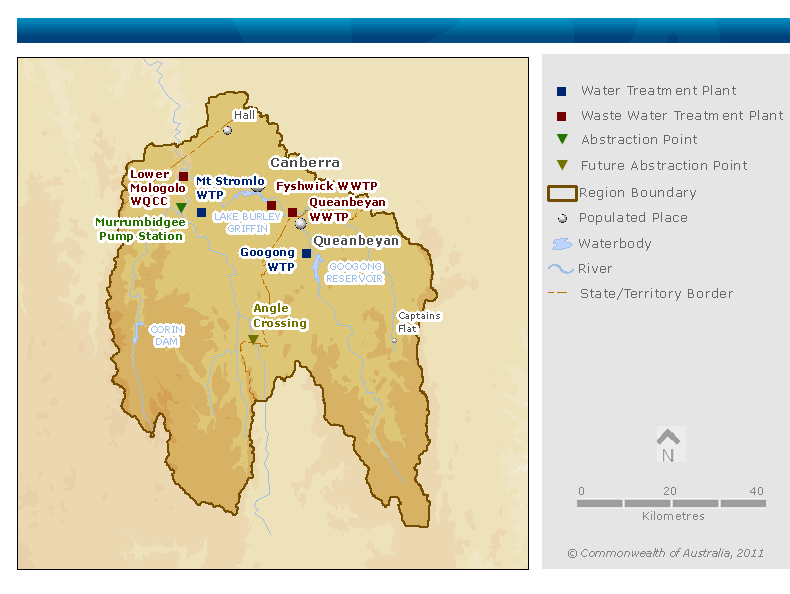
Figure P7. Map of surface water infrastructure within the Canberra region
The Canberra region falls within the Lachlan Fold Belt formation. The region sits on low yield fractured volcanic aquifers overlain in places by minor, high yielding aquifers in superficial, unconsolidated, alluvium/colluvium. The alluvial aquifers can be a locally significant source of water, but groundwater is a small resource in the Canberra region (ANRA 2009).
Within the ACT, groundwater is managed as a combined resource with surface water as part of the water management areas. In NSW, groundwater is managed separately to surface water within two groundwater management areas.
Groundwater in the NSW part of the Canberra region is divided into two groundwater management areas (GMA) as shown in Figure P8:
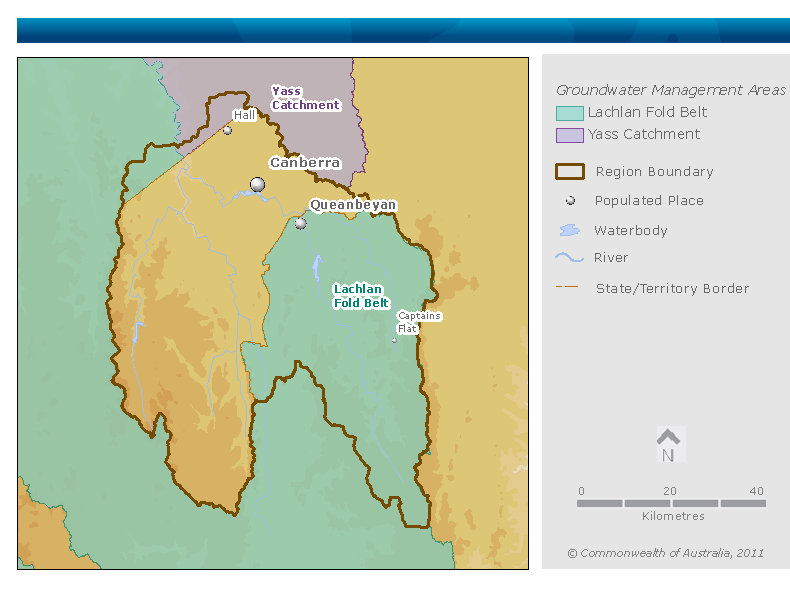
Figure P8. Map of groundwater management areas in the NSW part of the Canberra region
Three wastewater reuse schemes operate in the ACT. These schemes are listed in Table P4. The majority of the water recycled at Lower Molonglo Water Quality Control Centre (LMWQCC) is reused within the treatment process.
Table P4. Recycled water schemes in the Canberra region
|
Scheme |
Purpose |
Volume supplied 2009–10 (ML) |
Area supplied (km2) |
|---|---|---|---|
|
Southwell Park Watermining Project |
Irrigation of sports fields |
2 |
0.1 |
|
North Canberra Water Reuse Scheme |
Irrigation of sports fields |
17 |
0.7 |
|
Lower Molonglo Water Quality Control Centre Effluent Reuse Scheme |
Irrigation of vineyards, golf courses and use within the Lower Molonglo Water Quality Control Centre |
4228 |
1.3 |
|
Total |
|
4247 |
2.1 |
National Water Account 2010
Related links
Water links
