Figure 1 and tables 1–5 summarise the water distribution for City West Water (CWW) for 2009–10. The tables provide a breakdown for values shown in Figure 1. Notes for the values provided in tables 1–5 are available after Table 5.
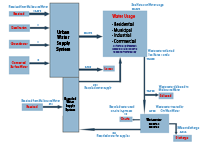
Figure 1. Urban note – summary of City West Water*
*All volumes are in megalitres (ML)
Differences between the urban water distribution system components are attributed to unaccounted water losses, and limitations in the calculations of volumes sourced, treated and supplied for consumption and other uses.
Note 1: Direct comparison of the total volume of water supplied (via the urban water supply system and the recycled water supply system) and the total volume of wastewater generated is not feasible due to data limitations on:
Note 2: Part of the wastewater collected is treated by Melbourne Water.
Note 3: Total water usage (84,535 ML) is estimated as: (1) volume of water supplied via the urban water supply system (excluding nonrevenue water) (84,155 ML) plus (2) volume of water supplied via the recycled water supply system (380 ML).
Note 4: Volume of wastewater treated by City West Water (4,738 ML) = volume of effluent discharge (4,584 ML) + volume of recycled water produced (154 ML).
Note 5: Volume of recycled water produced (154 ML) = recycled water used on-site in-process (90 ML) + recycled water for supplies (64 ML).
Note 6: Recycled water for supplies (64 ML) + recycled water received from Melbourne Water (316 ML) = total recycled water supplied (380 ML).
| Sources of water | Volume (ML) | Note | |
|---|---|---|---|
| Delivered via the water supply system (connected areas) | Water sourced from external entity (Melbourne Water) |
90,878 |
CWW_U4 |
| Water sourced from surface water |
0 |
||
| Water sourced from groundwater |
0 |
||
| Water sourced from desalination |
0 |
||
| Water sourced from recycle |
See Table 4 |
||
| Total water sourced to supply connected areas |
90,878 |
||
| Directly abstracted water * | Water sourced from surface water |
– |
|
| Water sourced from groundwater |
– |
||
| Water sourced from farm dam |
– |
||
| Water sourced from rainwater tank |
– |
||
| Total water directly sourced |
– |
||
| Total (excluding recycled water) |
90,878 |
||
| Item | Water usage | Volume (ML) | Note |
|---|---|---|---|
| 1 | Residential – potable water |
44,910 |
CWW_U9 |
| 2 | Residential – non-potable water |
0 |
|
| 3 | Commercial, industrial, municipal – potable water |
39,245 |
CWW_U10 |
| 4 | Commercial, industrial, municipal – non-potable water |
0 |
|
| 5 | Other including agricultural – potable water |
0 |
|
| 6 | Agricultural – non-potable water |
0 |
|
| 7 | Environment – potable water |
0 |
|
| 8 | Environment – non-potable water |
0 |
|
| Total |
84,155 |
Items 1 +3 | |
| Item | Wastewater produced and treated | Volume (ML) | Note |
|---|---|---|---|
| 1 | Wastewater collected by City West Water |
75,468 |
CWW_U19a |
| 2 | Wastewater received from other water authorities within the region |
0 |
|
| 3 | Wastewater delivered to Melbourne Water |
70,730 |
CWW_U21 |
| 4 | Total wastewater treated |
4,738 |
Item 1 less item 3, CWW_U19b |
| 5 | Wastewater treated for recycling |
154 |
CWW_U30 |
| 6 | Wastewater (treated) discharged to surface water |
0 |
|
| 7 | Wastewater (treated) discharged to ocean |
4,584 |
CWW_U23 |
| 8 | Total treated wastewater discharged |
4,584 |
Item 7 |
| Item | Recycled water produced and supplied | Volume (ML) | Note |
|---|---|---|---|
| 1 | Total recycled water produced |
154 |
CWW_U30 |
| 2 | Total recycled water received from other organisations within the region |
316 |
CWW_U28 |
| 3 | Recycled water use on-site or on-site in-process |
90 |
CWW_U34 |
| 4 | Recycled water supplied to residential |
0 |
|
| 5 | Recycled water supplied to commercial, industrial, municipal |
380 |
CWW_U30 |
| 6 | Recycled water supplied to agricultural |
0 |
|
| 7 | Recycled water supplied to environment |
0 |
|
| 8 | Recycled water supplied to artificial recharge |
0 |
|
| 9 | Total recycled water supplied |
380 |
Item 5 |
| Losses | Volume (ML) | Note |
|---|---|---|
| Losses from potable, non-potable water supplies* |
6,723 |
CWW_U11 |
| Losses from recycled water supplies |
– |
|
| Total water losses |
6,723 |
CWW_U4: 90,878 ML
City West Water: database.
City West Water.
This item represents the metered volume of bulk water supplied by Melbourne Water. Metered volumes are based on Melbourne Water bulk meters.
+/–5%.
Nil.
CWW_U9: 44,910 ML
City West Water: Gentrack billing system.
City West Water.
The item represents the metered volume of potable water supplied for residential use. City West Water has over 320,000 meters; residential meters are read on a quarterly basis. Generally, those nonresidential customers consuming greater than 10 ML per annum are read monthly and those that consume less than 10 ML are read quarterly.
Volumes are derived from monthly and quarterly meter readings, which are used to bill nonresidential and residential customers. Gentrack, City West Water's billing system, collates all meter readings from residential and nonresidential customers. Volumes are applicable to 2009–10.
+/–5%.
These volumes are only applicable to water use within the City West Water area inside the Melbourne region. There was no supply to Little River during 2009–10.
CWW_U10: 39,245 ML
City West Water: Gentrack billing system.
City West Water.
The item represents the metered volume of potable water supplied for commercial, industrial and municipal use.
City West Water has over 320,000 meters; residential meters are read on a quarterly basis. Generally, those nonresidential customers consuming greater than 10 ML per year are read monthly and those that consume less than 10 ML are read quarterly.
Volumes are derived from monthly and quarterly meter readings which are used to bill nonresidential and residential customers. Gentrack, City West Water's billing system, collates all meter readings from residential and nonresidential customers. Volumes are applicable to 2009–10.
+/–5%.
These volumes are only applicable to water use within the City West Water area inside the Melbourne region. There was no supply to Little River for 2009–10.
CWW_U11: 6,723 ML
City West Water: database.
City West Water.
This item represents the volume of nonrevenue water. Nonrevenue water is calculated as bulk supplied water minus metered and billed domestic and nondomestic water consumption.
+/–5%.
This item is calculated from other figures, and its accuracy can be inferred from the other fields used to calculate the figures.
and
CWW_U15 + CWW_U17: 4,495 ML
City West Water: database.
City West Water.
This item represents the total losses and leakage from the potable water supply system. It is part of the nonrevenue water (U11) that is attributed to losses and leakage.
+/–5%.
Nil.
CWW_U19a: 75,468 ML
City West Water: spreadsheet; supervisory control and data acquisition (SCADA) database.
City West Water.
This item represents the metered volume of wastewater collected by City West Water and the metered volume of wastewater taken at the Sunshine Golf Club sewer mining plant. Bulk meters are the property of Melbourne Water; information regarding meter locations and reading frequency must be sourced from Melbourne Water. For wastewater flows associated to City West Water assets, flow meters are located at the Altona Treatment Plant and Sunshine Golf Club and are read on a daily basis.
| Wastewater collected | Volume (ML) |
|---|---|
| Wastewater collected by City West Water |
75,404 |
| Wastewater taken from Sunshine Golf Club sewer mining plant |
64 |
| Total |
75,468 |
+/–10%.
Nil.
CWW_U19b: 4,738 ML
City West Water: supervisory control and data acquisition (SCADA) database.
City West Water.
This item represents the metered volume of wastewater treated at City West Water wastewater treatment plants and sewer mining plants. Meters are located at both these plants and are read on a daily basis.
| Wastewater treated | Volume (ML) |
|---|---|
| Altona Wastewater Treatment Plant |
4,674 |
| Sunshine Golf Club sewer mining plant |
64 |
| Total |
4,738 |
+/–5%.
Nil.
CWW_U21: 70,730 ML
City West Water: spreadsheet on weekly purchases for Summary Audit Report – Regulatory Audit of AGL Energy Limited, October 2010 (ESC 2010).
City West Water.
This item represents the metered volume of wastewater exported to Melbourne Water’s Western Treatment Plant. The volume is determined by Melbourne Water flow meter readings. Bulk meters are the property of Melbourne Water; information regarding meter locations and reading frequency must be sourced from Melbourne Water.
+/–10%.
Nil.
CWW_U23: 4,584 ML
City West Water: supervisory control and data acquisition (SCADA) database.
City West Water.
This item represents the metered volume of treated wastewater discharged from the Altona Wastewater Treatment Plant into Port Phillip Bay. Meters are located at the Altona plant and are read on a daily basis. The line item is calculated by deducting the metered volume of water used in-process within the treatment plant from the metered wastewater discharge value.
+/–5%.
Nil.
CWW_U28: 316 ML
City West Water: spreadsheet; Summary Audit Report – Regulatory Audit of AGL Energy Limited, October 2010 (ESC 2010).
City West Water.
This item represents the metered volume of recycled water purchased and received from Melbourne Water’s Western Treatment Plant.
| Recycled water received from other water authorities within the region | Data collection method | Volume (ML) | |
|---|---|---|---|
| Recycled water purchased from Melbourne Water’s Western Treatment Plant | Water treatment plant standpipes | Flow meter |
38 |
| Mackillop College | Flow meter |
151 |
|
| Werribee Technology Precinct | Electronic logger capture system |
127 |
|
| Total volume of recycled water received from Melbourne Water |
316 |
||
+/–5%.
Nil.
CWW_30: 154 ML
City West Water: supervisory control and data acquisition (SCADA) system.
City West Water.
This item represents the metered volume of recycled water produced at City West Water’s Altona Wastewater Treatment Plant and Sunshine Golf Club sewer mining plant. Metered volumes from flow meters connected to City West Water’s SCADA system.
| Recycled water produced | Volume (ML) |
|---|---|
| Recycled water produced by City West Water’s Altona Wastewater Treatment Plant |
90 |
| Recycled water produced by Sunshine Golf Club sewer mining plant |
64 |
| Total |
154 |
+/–5%.
Nil.
CWW_32: 380 ML
City West Water: database.
City West Water.
This item represents the metered volume of recycled water supplied for commercial, industrial and municipal use, including the metered volume of recycled water used at the Sunshine Golf Club for irrigation. Meters are read on a daily basis.
| Recycled water supplied for commercial, industrial and municipal use | Volume (ML) |
|---|---|
| Recycled water produced by Sunshine Golf Club sewer mining plant (for irrigation) |
64 |
| Recycled water supplied to commercial, industrial and municipal use |
316 |
| Total |
380 |
+/–5%.
Nil.
CWW_34: 90 ML
City West Water: supervisory control and data acquisition (SCADA) system.
City West Water.
Ungraded.
Nil.
National Water Account 2010
Related links
Water links
